

Abstract
The basal ganglia (BG) are impaired in Parkinson's disease (PD), but it remains unclear which nuclei are impaired during the performance of motor tasks in early‐stage PD. Therefore, this study was conducted to determine which nuclei function abnormally, and whether cortical structures are also affected by early‐stage PD. The study also determined if cerebellar hyperactivity is found early in the course of PD. Blood oxygenation level dependent activation was compared between 14 early‐stage drug‐naïve PD patients and 14 controls performing two precision grip force tasks using functional magnetic resonance imaging at 3 T. The grip tasks used in this study were chosen because both tasks are known to provide robust activation in BG nuclei, and the two tasks were similar except that the 2‐s task required more switching between contraction and relaxation than the 4‐s task. The 4‐s task revealed that PD patients were hypoactive relative to controls only in putamen and external globus pallidus, and thalamus. In the 2‐s task, PD patients were hypoactive throughout all BG nuclei, thalamus, M1, and supplementary motor area. There were no differences in cerebellar activation between groups during either task. Regions of interest analysis revealed that the hypoactivity observed in PD patients during the 2‐s task became more pronounced over time as patients performed the task. This suggests that a motor task that requires switching can accentuate abnormal activity throughout all BG nuclei of early‐stage, drug‐naive PD, and that the abnormal activity becomes more pronounced with repeated task performance in these patients. Hum Brain Mapp, 2010. © 2010 Wiley‐Liss, Inc.
Keywords: fMRI, Parkinson's disease, force
INTRODUCTION
Human neuroimaging techniques such as functional magnetic resonance imaging (fMRI) and positron emission tomography (PET) have lead to a greater understanding of the motor deficits of Parkinson's disease (PD). In general, studies have shown that PD leads to reduced regional cerebral blood flow (rCBF) and reduced blood oxygenation level dependent (BOLD) activation in the striatum, prefrontal cortex, and supplementary motor area (SMA) (Dirnberger et al., 2005; Grafton et al., 2006; Playford et al., 1992; Samuel et al., 1997; Yu et al., 2007). Two fMRI studies found that PD patients of moderate severity who had been treated with anti‐parkinsonian medications for many years had increased BOLD activation compared to controls in the primary motor cortex (M1) when studied following a 12‐h withdrawal from medication (Sabatini et al., 2000; Yu et al., 2007). However, in early‐stage, drug‐naïve PD patients BOLD activation in M1 is reduced compared with controls (Buhmann et al., 2003). Most neuroimaging studies have examined PD patients that have been chronically exposed to anti‐Parkinson medication. This can lead to results that are different from those seen in drug‐naïve patients early in the course of the disease because there may be reorganization in the basal ganglia (BG)‐thalamo‐cortical loop due to disease progression and/or chronic drug therapy (Buhmann et al., 2003).
Three important issues concerning the pathophysiology in drug naïve PD are unresolved. First, it remains unclear whether only specific nuclei of the BG function abnormally or whether all BG nuclei function abnormally early on in the clinical course of PD. Only one published fMRI study to date has examined drug naïve PD patients and it was restricted to examining cortical activation differences (Buhmann et al., 2003). Second, a feature of movement in patients who have had PD for many years is that the performance of repetitive movements becomes progressively impaired across time (Fleminger, 1992; Georgiou et al., 1994; Penn et al., 1998; Rand and Stelmach, 1999; Stelmach et al., 1987). However, the extent to which the performance of repetitive movements is impaired in early‐stage PD is unknown as is whether the dynamics of the neural signals in the brain become abnormal with repetitive task performance. Previously it has been shown that in dystonia the dynamic properties of the BOLD signal become progressively hyperactive during repeated finger movements (Blood et al., 2004). As PD is a hypokinetic movement disorder and dystonia is a hyperkinetic movement disorder, the current study tests the hypothesis that when the grip force task requires greater switching between contraction and relaxation, the dynamics of the BOLD signal in the BG will be progressively hypoactive over time in patients with PD. Third, previous work has shown that the cerebellum is hyperactive in PD patients who have had the disease for many years and were treated for many years, and that this hyperactivation compensates for deficits in the BG (Wu and Hallett, 2005; Yu et al., 2007). It remains unclear whether the cerebellum is hyperactive in early‐stage, drug‐naïve PD, when such compensation may not yet have occurred. The current study addresses all three issues using grip force tasks that vary in the number of required switching on and off force contractions to study the BG, thalamus, cerebellum, and cortex in early‐stage, drug‐naïve patients with PD.
METHODS
Subjects
This research is a prospective case‐controlled study that included 28 subjects, with 14 drug‐naive patients with PD and 14 healthy controls. These same 28 patients participated in a previous study using diffusion tensor imaging (Vaillancourt et al., 2009). Patients were recruited from the Movement Disorders Section at Rush University Medical Center. Patients were included if they were not on anti‐parkinsonian medications, had never been treated with anti‐parkinsonian medications, and had a Mini Mental State Examination greater than 26. Anti‐parkinsonian medication was defined to include any drug designed to alter symptoms of PD or posited to slow the progression of PD. All patients were diagnosed with PD by a movement disorders neurologist and met the PD Society Brain Bank diagnostic criteria (Hughes et al., 2001; Hughes et al., 1992). Table I shows the characteristics of each patient and control subject. The 14 healthy control subjects were recruited from advertisements in the Chicagoland area, and were matched for age, sex, and handedness to each patient with PD. The age of the PD group (mean = 57.2 years) was not different from the control group (mean = 57.6 years) (t = −0.10, df = 26, P = 0.92). All subjects gave written informed consent consistent with the Declaration of Helsinki, which was approved by the Institutional Review Boards at Rush University Medical Center and the University of Illinois at Chicago.
Table I.
Patient characteristics
| ID | Age | Handedness | Hand tested | UPDRS | HY stage |
|---|---|---|---|---|---|
| PD 1 | 47 | R | R | 10 | I |
| PD 2 | 72 | R | L | 31 | II |
| PD 3 | 66 | R | L | 20 | II |
| PD 4 | 55 | R | L | 12 | I |
| PD 5 | 57 | L | R | 25 | II |
| PD 6 | 60 | R | R | 12 | I |
| PD 7 | 69 | R | L | 18 | II |
| PD 8 | 45 | R | L | 18 | II |
| PD 9 | 57 | R | L | 18 | II |
| PD 10 | 36 | R | L | 4 | I |
| PD 11 | 55 | L | R | 31 | II |
| PD 12 | 60 | R | R | 11 | II |
| PD 13 | 58 | R | R | 16 | II |
| PD 14 | 64 | R | L | 25 | II |
Force Data Acquisition
Subjects produced force against a custom fiber optic force transducer (Aither Engineering). PD patients used their most affected limb. Since control subjects were matched for handedness, each control subject used the same hand as the matched patient. The force transducer was constructed from rigid, nonmetallic material to allow for its use inside the magnetic resonance environment. When prompted, subjects produced force against the transducer and the force signal was transmitted via fiber optic wire to the Si425 Fiber Optic Interrogator (Micron Optics) outside the fMRI environment. The Si425 Fiber Optic Interrogator digitized the force data at 125 Hz and customized software written in LabView collected the force data and converted it to Newtons. The force transducers were factory calibrated by Aither Engineering and had a resolution of 0.025 Newtons. The output from the force transducer was presented to the subject using a visual display inside the MRI scanner and was updated at each sampling interval. The feedback was projected via the parallax biofeedback system (Thulborn, 1999), similar to previous experiments (Vaillancourt et al., 2003). A mirror located inside the MR environment displayed visual feedback onto a video screen located 35 cm from the subject's eyes. The force output was displayed on the screen at a resolution of 640 × 480 pixels and a refresh rate of 60 Hz. The force data were lowpass filtered using a Butterworth filter at 30 Hz (4th order dual pass).
MRI Data Acquisition
Magnetic resonance images were collected using a quadrature volume head coil inside a 3 T MR Scanner (GE Healthcare 3T94 Excite 2.0). The subjects lay supine in the scanner while performing the force tasks. The subject's head was stabilized using adjustable padding and then fitted with the projector‐visor system for displaying visual feedback. The functional images were obtained using a T2*‐sensitive, single shot, gradient‐echo echo‐planar pulse sequence (echo‐time 25 ms; time to repeat (TR) 2,500 ms; flip angle 90o; field of view 200 mm2; imaging matrix 64 × 64; 42 axial slices at 3 mm thickness; 0 mm gap between slices). The T1 anatomical scans were obtained using a T1‐weighted fast spoiled gradient echo pulse sequence (echo‐time 1.98 ms; repeat‐time 9 ms; flip angle 25o; field of view 240 mm2; imaging matrix 256 × 256; 120 axial slices at 1.5 mm thickness; 0 mm gap between slices). The T2 anatomical scans were obtained using a T2‐weighted fast spin echo pulse sequence (echo‐time 97.536 ms; repeat‐time 6,800 ms; flip angle 90o; field of view 200 mm2; imaging matrix 512 × 512; 42 axial slices at 3 mm thickness; 0 mm gap between slices).
Experimental Design
Before scanning, each subject participated in a 1‐h training session outside the scanner to minimize motor learning effects when inside the scanner. Each subject's maximum voluntary contraction (MVC) was calculated using a separate force transducer (Jamar Hydraulic Pinch Gauge) before entering the MR environment. The subjects were asked to produce a contraction of maximum force using a pinch grip (thumb, index, and middle finger) for three consecutive trials. Each trial was separated by a 60 s period of rest. The MVC was calculated as the peak force amplitude reached during the sustained maximum force contraction. Throughout the experiment, patients produced force with their most affected hand and matched controls used the same hand as the patient they were matched with.
The fMRI experiment had two tasks completed across two functional scans: (1) the 4‐s task and (2) the 2‐s task. Both tasks used a blocked‐design paradigm that consisted of alternating 30 s rest and 30 s task blocks with rest positioned at the beginning and end of the sequence. Each task had a total of five rest blocks and four task blocks. During the rest blocks, subjects fixated on a stationary red target and stationary white cursor but did not produce force. During both types of task blocks, the subjects completed pulse‐hold contractions using a pinch grip. The target always represented 15% of the individual subject's MVC and was displayed on the screen as a fixed horizontal bar. The cursor was displayed on the screen as a moveable horizontal white bar. The vertical position of the cursor with respect to the target was directly related to the force produced by the subject. The subjects viewed the target and cursor bar throughout all functional scans.
Actual force traces from a single control subject and a single PD subject for a task block of the 4‐ and 2‐s tasks are depicted in Figure 1A and B. During the 4‐s task, the 30‐s task blocks consisted of 4‐s sustained pulses separated by 1 s of rest (Fig. 1A). Each 4‐s pulse began as the target bar turned green and remained green for 4 s. Subjects were trained to quickly and accurately produce force to 15% MVC and maintain the contraction for this 4 s period. The 4‐s pulse ended when the target bar turned red for 1 s, indicating rest. This sequence was repeated six times per task block. Thus, each individual subject performed six pulses during each of four task blocks for a total of 24 pulses per scan.
Figure 1.
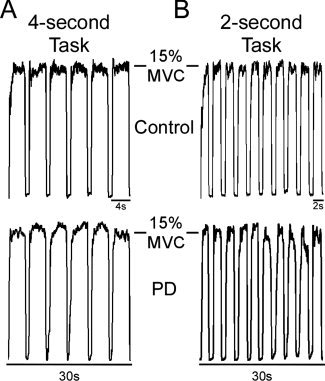
Depicts actual force traces of the motor tasks performed by a single control subject (top) and a single PD patient (bottom). (A) The 4‐s task required subjects to produce 4 s sustained force pulses to 15% of their maximum voluntary contraction separated by 1 s of rest. Subjects performed six pulses per 30 s block of the 4‐s task. (B) The 2‐s task required subjects to produce 2 s sustained force pulses separated by 1 s of rest. Subjects performed 10 pulses per 30s block of the 2‐s task.
The 2‐s task also used a 30‐s task block, but required subjects to produce 2 s pulses separated by 1 s of rest (Fig. 1B). Each 2‐s pulse began as the target bar turned green and remained green for 2 s. Subjects were trained to quickly and accurately produce force to 15% MVC and maintain the contraction for this 2 s period. The 2‐s pulse ended when the target bar turned red for 1 s, indicating rest. This sequence was repeated 10 times per task block. Thus, each individual subject performed 10 pulses during each of four task blocks for a total of 40 pulses per scan.
Force Data Analysis
Quantifying force dependent measures
After the force output was collected, a visual inspection of the data was performed and four specific time points were marked for each pulse (Spraker et al., 2009). Point 1 was marked at the onset of force. Points 2 and 3 were marked at the beginning and end of the sustained force period, respectively. Point 4 was marked at the offset of force. Four main variables were calculated during force data analysis. First, mean force amplitude was calculated as the mean force output between the beginning and end of the sustained force period (points 2 and 3) for the 4‐ and 2‐s pulses separately. Second, the mean duration of each pulse was calculated as the time difference between the onset of force and the offset of force (points 1 and 4). Third, the rate of change of increasing force was obtained by averaging the first derivative of force between the onset of force and the beginning of the sustained force period for the 4‐ and 2‐s pulses separately (points 1 and 2). Similarly, the rate of change of decreasing force was obtained by averaging the first derivative of force between the end of the sustained force period and the offset of force for the 4‐ and 2‐s pulses separately (points 3 and 4). Calculations were carried out for each individual pulse of each task. This resulted in 24 values per subject for each dependent measure for the 4‐s task (six pulses, four blocks) and 40 values per subject for each dependent measure for the 2‐s task (10 pulses, four blocks).
Statistical Analysis of Force Data
The force data were analyzed in order to compare the behavioral performance of the control and PD groups at each pulse within a task block. In the 4‐s task, the dependent measure for each of the six pulses per task block was averaged so that the same pulse dependent measure was averaged across the four task blocks. This provided four mean dependent measures for each of the six pulses within the 4‐s task block for each subject. In the 2‐s task, the dependent measure for each of the 10 pulses per task block was averaged so that the same pulse dependent measure was averaged across the four task blocks. This provided four mean dependent measures for each of the 10 pulses within the 2‐s task block for each subject. The difference in group means across the task blocks in the 4‐ and 2‐s tasks were analyzed using separate two‐way (group by pulse within a task block) repeated‐measures ANOVAs for each dependent measure and each task. Mauchly's sphericity test determined that sphericity was consistently violated in the ANOVAs, so the Greenhouse‐Geisser correction was implemented and this P‐value was used. All tests were evaluated as significant if the P‐value was less than 0.05.
fMRI Data Analysis
AFNI, the public domain software (http://afni.nimh.nih.gov/afni/), was used to process and analyze the fMRI data sets. Before analysis, the fMRI data were transposed for those subjects that used their left hand so that the left and right hemispheres in all datasets were contralateral and ipsilateral to the tested hand, respectively. First, the methods for head motion analysis will be described. Then, the methods used for two separate group analyses will be described: (1) voxel‐wise analysis and (2) region of interest (ROI) analysis.
Head Motion Analysis and Motion Correction
After importing the acquired data, motion detection and correction functions were applied to each functional time series. To determine if head motion was different between groups or tasks, three time series for displacement (x, y, and z) were examined for each scan (4‐ and 2‐s). Head motion was quantified by calculating the absolute value of displacement at each volume and then averaging across each time series. The average head motion for each PD and control subject was <1 mm. A between group ANOVA comparing head motion in patients with PD and control subjects indicated that head motion was not different between groups in either task (all P > 0.24).
Voxel‐wise Analysis
A voxel‐wise analysis was performed on the whole brain fMRI data to identify group differences in BOLD activation in each task. Motion‐corrected individual datasets were normalized by dividing the instantaneous signal in each voxel at each point in the time series by the mean signal in that voxel across each scan. After this, a Gaussian filter was applied to the resultant datasets (full‐width half‐maximum at 3 mm). Then, the time series data were regressed to a simulated hemodynamic response function for the task sequence (3Ddeconvolve, AFNI). The dependent variable at this level of analysis was the estimated β‐coefficient of the regressed time series and its associated t‐statistic. Before group analysis, each subject's anatomical dataset was manually transformed to Talairach space using AFNI. Then, each subject's individual functional datasets were transformed to Talairach space using the normalized anatomical dataset as a template.
The output data for the 4‐ and 2‐s tasks were analyzed using separate mixed‐effect two‐way ANOVAs with the group (control, PD) as a fixed factor and the subject as a random factor. This yielded the estimated difference in group means (control‐PD) for task minus rest for the 4‐ and the 2‐s tasks. These data were corrected for Type I error using a Monte Carlo Simulation model (AFNI, Alphasim). The datasets were thresholded to remove all voxels with t < 3 with an activation cluster minimum of 205 μL (P < 0.05, corrected). The corrected t‐statistic associated within each voxel is displayed in the final group maps.
Regions of Interest Analysis
A ROI analysis of group mean BOLD percent signal change was used to verify the voxel‐wise results and to investigate the time course of the BOLD signal. Percent signal change data were acquired by first calculating the mean signal within each voxel across all rest blocks for each individual motion‐corrected functional time series. The mean percent signal change within each voxel was then calculated separately for each individual dataset at each volume acquisition (i.e., TR) using the following equation:
in which μT is the instantaneous signal at each TR and μR is the mean signal during rest. Therefore, the output data at this level of the analysis represented the percent signal change at each TR in each voxel for each individual subject dataset. The analysis focused on a specific 42.5‐s time period that was repeated four times during each task: 12.5 s (5 TRs) of rest preceding task blocks and the 30 s (12 TRs) task block. Each respective TR in this time period was averaged across the four task blocks within each task to give the mean percent signal change within each voxel per subject per task. These values were averaged across subjects within each group to provide group mean percent signal change at each of the 17 TRs within each voxel per task.
The ROIs used for the BG have been validated and published as part of the Basal Ganglia Human Area Template (Prodoehl et al., 2008). The ROIs used in the substantia nigra (SN) and thalamus were drawn a priori based on previous experience (Spraker et al., 2009; Vaillancourt et al., 2009) and specific areas of motor cortex were drawn using the Human Motor Area Template (Mayka et al., 2006). The difference in the group mean percent signal change across the 12 task block TRs was analyzed using separate two‐way (group by TR) repeated‐measures ANOVAs for each ROI and each task. Mauchly's sphericity test found that sphericity was consistently violated, so the Greenhouse‐Geisser corrected P‐value was used. All tests were evaluated as significant if the P‐value was <0.05. Post‐hoc t‐tests were used to examine the locus of the group by TR interactions for the BOLD signal.
RESULTS
fMRI results
Basal ganglia
Figure 2 depicts the ROIs for the individual BG nuclei and the voxel‐wise comparison of control (task‐rest) minus PD (task‐rest) for the 4‐ and 2‐s tasks. During the 4‐s task, voxel‐wise analysis revealed that PD patients had reduced BOLD activation relative to controls only in the contralateral anterior putamen, posterior putamen, and external globus pallidus (GPe) (see Fig. 2). During the 2‐s task, PD patients were hypoactive contralaterally in caudate nucleus and bilaterally in anterior and posterior putamen, GPe, internal globus pallidus (GPi), and subthalamic nucleus (STN) (see Fig. 2). No areas within the brain, including the cerebellum, were found where PD patients were hyperactive.
Figure 2.
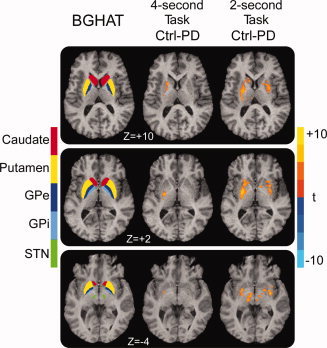
The basal ganglia human area template (BGHAT) and the results of the voxel‐wise comparison of control (force‐rest) minus PD (force‐rest) for the 4‐ and 2‐s tasks are depicted. The BGHAT is provided for reference purposes. The superior (Z = +10) and middle (Z = +2) slices demonstrate that PD patients were hypoactive relative to controls in contralateral GPe and putamen during the 4‐s task, while BOLD hypoactivation during the 2‐s task was observed in bilateral caudate, putamen, GPe, and GPi (P < 0.05, corrected). The inferior slice (Z = −4) demonstrates that there was no difference between controls and PD patients in STN during the 4‐s task, but that PD patients were hypoactive in bilateral STN during the 2‐s task (P < 0.05, corrected). The color bar ranges from t = −10 (PD > control) to t = +10 (control > PD). [Color figure can be viewed in the online issue, which is available at wileyonlinelibrary.com.]
The average time course of the BOLD percent signal change during the 4‐s task within the contralateral anterior putamen, posterior putamen, and GPe ROIs are depicted in Figure 3, and the corresponding center of mass Talairach coordinates are shown in Table II. Analysis of the 12 task‐related TRs of the 4‐s task revealed that BOLD percent signal change was reduced for PD compared to controls within contralateral anterior putamen, posterior putamen, and GPe (Table II). BOLD percent signal change was different across TRs for these ROIs, but the group by TR interaction for contralateral anterior putamen, posterior putamen, and GPe was not significant (Table II).
Figure 3.
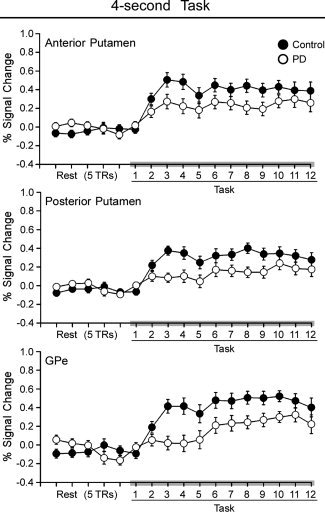
Average BOLD percent signal change is plotted for five pretask TRs of rest and the 12 TRs of task blocks for controls (filled circles) and PD patients (empty circles) during the 4‐s task. Each value represents the average BOLD percent signal change across blocks and subjects at each TR. Error bars indicate standard error for the group mean. Anterior putamen, posterior putamen, and GPe are shown during the 4‐s task. These structures are depicted because they were all hypoactive during the 4‐s task in PD patients relative to control subjects in Figure 2.
Table II.
Control > PD for 4‐s task
| ROI | Center of mass X, Y, Z in talairach | Group (df = 1,26) | TR (df = 11,286) | Interaction (df = 11,286) |
|---|---|---|---|---|
| Basal ganglia | ||||
| C A putamen | (−22.3, 7.0, 6.8) | F = 4.70, P < 0.05 | F = 6.53, P < 0.01 | F = 0.96, P = 0.48 |
| C P Putamen | (−26.7, −5.4, 3.8) | F = 9.93, P < 0.01 | F = 10.28, P < 0.001 | F = 1.99, P = 0.09 |
| C GPe | (−19.8, −4.0, 3.9) | F = 6.48, P < 0.05 | F = 6.72, P < 0.001 | F = 2.02, P = 0.07 |
| Thalamus | ||||
| C Medial | (−19.2, −23.1, 13.4) | F = 7.10, P < 0.05 | F = 7.03, P < 0.001 | F = 1.15, P = 0.33 |
| C Lateral | (−23.0, −24.6, 13.5) | F = 11.71, P < 0.01 | F = 4.74, P < 0.001 | F = 1.69, P = 0.12 |
The average time courses of BOLD percent signal change during the 2‐s task within contralateral caudate, anterior putamen, posterior putamen, GPe, GPi, and STN are depicted in Figure 4. The corresponding center of mass Talairach coordinates are shown in Table III. PD patients had lower BOLD percent signal change than controls within bilateral caudate, anterior putamen, posterior putamen, GPe, GPi, and STN (Table III). Additionally, BOLD percent signal change was different across TRs in all of these ROIs, except ipsilateral caudate (Table III). In contrast to the 4‐s task, the group by TR interaction during the 2‐s task was significant within bilateral caudate, anterior putamen, posterior putamen, GPe, GPi, and STN (Table III).
Figure 4.
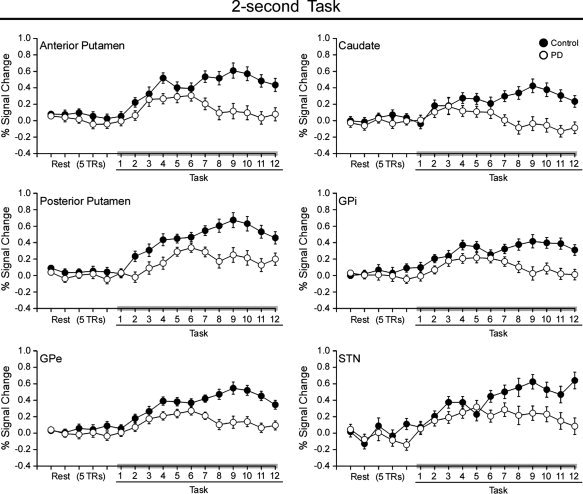
Average BOLD percent signal change is plotted for five pretask TRs of rest and the 12 TRs of task blocks for controls (filled circles) and PD patients (empty circles) during the 2‐s task. Each value represents the average BOLD percent signal change across blocks and subjects at each TR. Error bars indicate standard error for the group mean. Caudate, anterior putamen, posterior putamen, GPe, GPi, and STN are shown during the 2‐s task. These structures are depicted because they were all hypoactive during the 2‐s task in PD patients relative to control subjects in Figure 2.
Table III.
Control > PD for 2‐s task
| ROI | Center of mass X, Y, Z in Talairach | Group (df = 1,26) | TR (df = 11,286) | Interaction (df = 11,286) | Difference TR2/3 (C‐PD) | t‐test TR 2/3 (C‐PD) | Difference TR9/10 (C‐PD) | t‐test TR 9/10 (C‐PD) |
|---|---|---|---|---|---|---|---|---|
| Basal ganglia | ||||||||
| C Caudate | (−11.2, 9.0, 11.2) | F = 9.49, P < 0.01 | F = 2.57, P < 0.05 | F = 5.51, P < 0.001 | 0.04 | P = 0.71 | 0.44 | P < 0.001 |
| I Caudate | (12.2, 9.0, 11.3) | F = 8.77, P < 0.01 | F = 2.19, P = 0.08 | F = 4.45, P < 0.01 | 0.02 | P = 0.84 | 0.42 | P = 0.001 |
| C A Putamen | (−22.3, 7.0, 6.8) | F = 12.19, P < 0.01 | F = 8.21, P < 0.001 | F = 5.16, P < 0.001 | 0.11 | P = 0.22 | 0.48 | P < 0.001 |
| I A Putamen | (22.3, 7.0, 6.8) | F = 9.67, P < 0.01 | F = 5.92, P < 0.001 | F = 5.26, P < 0.001 | 0.06 | P = 0.45 | 0.40 | P < 0.001 |
| C P Putamen | (−26.7, −5.4, 3.8) | F = 13.15, P = 0.001 | F = 14.36, P < 0.001 | F = 3.65, P < 0.01 | 0.23 | P < 0.05 | 0.42 | P < 0.005 |
| I P Putamen | (26.7, −5.4, 3.8) | F = 12.68, P = 0.001 | F = 5.91, P < 0.001 | F = 5.26, P < 0.01 | 0.12 | P = 0.23 | 0.40 | P < 0.005 |
| C GPe | (−19.8, −4.0, 3.9) | F = 15.09, P < 0.001 | F = 11.12, P < 0.001 | F = 5.65, P < 0.001 | 0.10 | P = 0.18 | 0.40 | P < 0.001 |
| I GPe | (19.8, −4.0, 3.9) | F = 11.48, P < 0.01 | F = 6.17, P < 0.001 | F = 4.37, P < 0.001 | 0.01 | P = 0.87 | 0.35 | P = 0.001 |
| C GPi | (−16.0, −4.4, 1.6) | F = 9.08, P < 0.01 | F = 4.69, P < 0.001 | F = 3.68, P = 0.001 | 0.10 | P = 0.20 | 0.35 | P = 0.001 |
| I GPi | (16.0, −4.4, 1.6) | F = 5.51, P < 0.05 | F = 4.44, P < 0.001 | F = 4.21, P < 0.001 | 0.08 | P = 0.35 | 0.35 | P < 0.001 |
| C STN | (−10.7, −13.7, −3.4) | F = 8.07, P < 0.01 | F = 4.62, P < 0.001 | F = 3.44, P < 0.01 | 0.12 | P = 0.16 | 0.34 | P < 0.01 |
| I STN | (10.1, −13.3, −3.4) | F = 4.85, P < 0.05 | F = 3.41, P < 0.01 | F = 2.88, P < 0.05 | −0.07 | P = 0.48 | 0.39 | P < 0.005 |
| C SN | (−13.9, −19.8, −5.1) | F = 5.53, P < 0.05 | F = 4.18, P < 0.001 | F = 4.73, P < 0.001 | 0.04 | P = 0.69 | 0.64 | P < 0.001 |
| I SN | (13.6, −19.0, −5.6) | F = 2.45, P = 0.13 | F = 2.07, P = 0.06 | F = 1.68, P = 0.13 | N/A | N/A | N/A | N/A |
| Thalamus | ||||||||
| C Medial | (−19.2, −23.1, 13.4) | F = 19.99, P < 0.001 | F = 4.62, P = 0.001 | F = 2.40, P < 0.05 | 0.14 | P = 0.23 | 0.59 | P = 0.001 |
| C Lateral | (−23.0, −24.6, 13.5) | F = 20.09, P < 0.001 | F = 7.40, P < 0.001 | F = 1.86, P = 0.11 | N/A | N/A | N/A | N/A |
| Cortex | ||||||||
| C M1 | (−37.0, −22.2, 44.4) | F = 14.91, P < 0.001 | F = 23.50, P < 0.001 | F = 7.09, P < 0.001 | 0.28 | P < 0.05 | 0.65 | P < 0.001 |
| I SMA | (6.8, 19.1, 58.5) | F = 3.53, P = 0.07 | F = 17.86, P < 0.001 | F = 3.82, P = 0.01 | 0.11 | P = 0.47 | 0.58 | P < 0.05 |
Voxel‐wise analysis of the SN demonstrated that PD patients and controls had similar BOLD activation during the 4‐s task, but PD patients became hypoactive relative to controls during the 2‐s task (Figure 5A and B). The voxel‐wise results superimposed on a T2‐weighted image show that hypoactivation associated with PD was localized to STN and SN, but not red nucleus (Fig. 5B). ROI analysis revealed that PD patients had lower BOLD percent signal change relative to controls in contralateral SN and that the BOLD percent signal change across the TRs was different (Fig. 5C, Table III). Additionally, the group by TR interaction was significant in contralateral SN (Table III). The ipsilateral SN did not reach significance in the ROI analysis.
Figure 5.
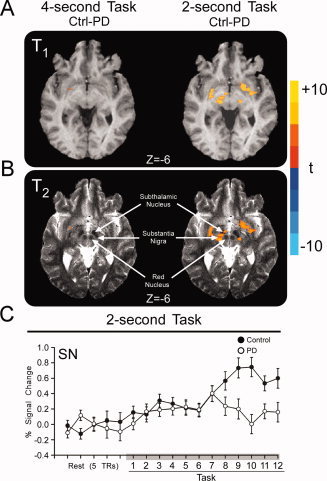
Results of the voxel‐wise and ROI analysis for contralateral substantia nigra. (A) Voxel‐wise results are depicted over the T1‐weighted high resolution anatomical scan of a single subject. There were no differences between PD patients and controls during the 4‐s task (left panels), but PD patients were hypoactive in substantia nigra during the 2‐s task (right panels) (P < 0.05, corrected). (B) The same voxel‐wise results depicted over the T2‐weighted high resolution anatomical scan of a single subject confirms that relative hypoactivity observed for PD is localized to STN and substantia nigra, but not red nucleus. (C) Average BOLD percent signal change within the contralateral substantia nigra (SN) of controls (filled circles) and PD patients (empty circles) is plotted for five pretask TRs of rest and the 12 TRs of the 4‐ and 2‐s task blocks. Each value represents the average BOLD percent signal change across blocks and subjects at each TR. Error bars indicate standard error for the group mean. [Color figure can be viewed in the online issue, which is available at wileyonlinelibrary.com.]
Post‐hoc t‐tests were used to determine the locus of the group by TR interaction for each BG nucleus. In the task block (see Fig. 4), the average percent signal change at TRs 2 and 3 was averaged and compared to the average percent signal change of TRs 9 and 10 for each subject. An unpaired t‐test compared the difference. Table III shows that except for contralateral posterior putamen, the percent signal change in all BG nuclei was not different at TRs 2 and 3 between PD patients and control subjects. In contrast, in all BG nuclei where an interaction was observed, there was a significant difference between groups in percent signal at TRs 9 and 10.
In summary, PD patients were hypoactive only in anterior putamen, posterior putamen, and GPe during the 4‐s task, but they were hypoactive in all BG nuclei during the 2‐s task (i.e., caudate, anterior and posterior putamen, GPe, GPi, STN, and SN). Additionally, ROI analysis found significant group by TR interactions in all BG nuclei during the 2‐s task, indicating that the time course of the BOLD signal was different for controls and PD patients when subjects produce repeated 2‐s force pulses over a 30‐s time period.
Thalamus
Voxel‐wise analysis identified a lateral cluster and a medial cluster in the thalamus where PD patients were hypoactive relative to controls during both the 4‐ and 2‐s tasks. Statistical analysis confirmed that PD patients had lower BOLD signal relative to controls and that BOLD activation was different across TRs in the lateral and medial thalamic ROIs during the 4‐s task (Table II) and the 2‐s task (Table III). The group by TR interaction was not significant for either thalamic ROI during the 4‐s task (Table II). However, the group by TR interaction was significant within the medial thalamus during the 2‐s task (Table III). Post‐hoc t‐tests determined that the percent signal change in medial thalamus was not different at TRs 2 and 3 between PD patients and control subjects, but was significantly reduced in PD patients at TRs 9 and 10 (Table III).
Motor cortex
Voxel‐wise analysis found no difference in BOLD activation between PD patients and controls during the 4‐s task. However, PD patients were hypoactive in contralateral M1 and ipsilateral SMA during the 2‐s task (Fig. 6A). The group by TR interaction was significant in contralateral M1 and SMA during 2‐s (Table III). Post‐hoc t‐tests determined that the percent signal change in M1 was significantly reduced at TRs 2 and 3 and TRs 9 and 10 in PD patients compared with control subjects. In SMA, post‐hoc t‐tests indicated that PD patients were only hypoactive at TRs 9 and 10 (Table III).
Figure 6.
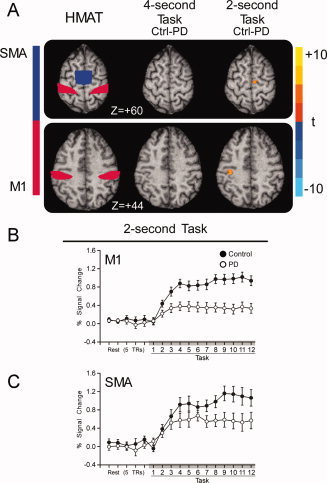
Results of the voxel‐wise and ROI analysis for motor cortex. (A) M1 and SMA regions from the human motor area template (HMAT) (Mayka et al., 2006) and the voxel‐wise results for 4‐ and 2‐s tasks are depicted. There were no differences between PD patients and controls during the 4‐s task, but PD patients were hypoactive in M1 and SMA during the 2‐s task (P < 0.05, corrected). (B) Average BOLD percent signal change within M1 of controls (filled circles) and PD patients (empty circles) is plotted for five pretask TRs of rest and the 12 TRs of the 4‐ and 2‐s task blocks. Each value represents the average BOLD percent signal change across blocks and subjects at each TR. Error bars indicate standard error for the group mean. (C) Average BOLD percent signal change within SMA of controls (filled circles) and PD patients (empty circles) is plotted for five pretask TRs of rest and the 12 TRs of the 4‐ and 2‐s task blocks. [Color figure can be viewed in the online issue, which is available at wileyonlinelibrary.com.]
In summary, there were no differences in cortical BOLD activation between controls and PD patients during the 4‐s task, but PD patients were hypoactive in contralateral M1 and SMA during the 2‐s task. Similar to the BG, ROI analysis shows that the time course of the BOLD signal was different between PD and controls when subjects produced force pulses that required switching force on and off more often. Using a voxel‐wise analysis, in the cerebellum there was no evidence of either hyperactivation or hypoactivation in either the 4‐ or 2‐s tasks. Also, there was no evidence of hyperactivation in any other parts of the brain, even when using an uncorrected threshold of P < 0.01.
Force Output Results
Force output for individual pulses
Figure 7A shows that the force amplitude was not different between controls and PD patients for either the 4‐s task [F(1,26) = 0.84, P = 0.37] or the 2‐s task [F(1,26) = 0.64, P = 0.43]. The force amplitude was not different across pulses during the 4‐s [F(5,130) = 1.35, P = 0.27] and 2‐s tasks [F(5,130) = 2.69, P = 0.06]. The group by pulse interaction was also not significant for the 4‐s [F(5,130) = 1.49, P = 0.23] or 2‐s tasks [F(5,130) = 0.54, P = 0.63].
Figure 7.
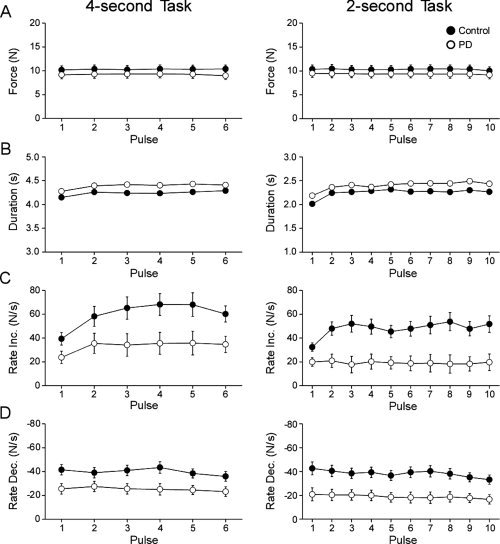
(A) Force amplitude. (B) Duration of force. (C) Rate of change of increasing force. (D) Rate of change of decreasing force. Group mean parameters for each task (4‐ and 2‐s) are plotted for control subjects (filled circles) and PD patients (empty circles). Error bars indicate standard error for the group mean.
Figure 7B demonstrates that mean duration of force was longer for PD patients than for controls during the 4‐s [F(1,26) = 12.49, P < 0.01) and 2‐s tasks [F(1,26) = 10.77, P < 0.01]. The duration was different across pulses for the 4‐s [F(5,130) = 8.41, P < 0.01] and 2‐s [F(9,234) = 19.21, P < 0.01] tasks, but the group by pulse interactions for the 4‐s [F(5,130) = 0.50, P = 0.64] and 2‐s tasks [F(9,234) = 0.91, P = 0.47] were not significant.
Figure 7C shows that mean rate of increasing force was greater for controls than PD patients during the 4‐s task [F(1,26) = 5.81, P < 0.05) and the 2‐s task [F(1,26) = 11.58, P < 0.01]. Also, the rate of force increased across the task block for both the 4‐s [F(5,130) = 11.56, P < 0.01] and 2‐s tasks [F(9,234) = 3.80, P < 0.01]. The group by pulse interaction was not significant for the 4‐s task [F(5,130) = 2.23, P = 0.08], but became highly significant for the 2‐s task [F(9,234) = 4.80, P < 0.01].
Figure 7D shows that controls relaxed force faster than PD patients during both the 4‐s [F(1,26) = 6.30, P < 0.05] and the 2‐s tasks [F(1,26) = 9.96, P < 0.01]. Additionally, there was a main effect of force pulse for the 4‐s task [F(5,130) = 3.74, P < 0.01] and the 2‐s task [F(9,234) = 6.65, P < 0.01]. The group by pulse interaction was not significant for either the 4‐s task [F(5,130) = 1.85, P = 0.13] or the 2‐s task [F(9,234) = 1.56, P = 0.18].
In summary, patients with early‐stage PD had a reduced rate of increasing and decreasing force compared with healthy control subjects. Importantly however, performance stayed consistent across pulse repetitions and did not decline as was found in the BOLD signal (Figs. 3 and 4).
DISCUSSION
This study used fMRI during a precision grip force task to study the dynamics of hypoactivity in the cortex and subcortex of early‐stage, drug‐naïve PD patients. There were three novel findings. First, this is the first study to show that all BG nuclei including caudate, anterior putamen, posterior putamen, GPe, GPi, STN, and SN are hypoactive in early‐stage, drug‐naïve PD during specific, repetitive tasks. This generalized hypoactivity occurred during the 2‐s task, while only GPe and putamen were hypoactive during the 4‐s task. Second, the dynamics of the BG hypoactivity became impaired with repeated force pulses during the 2‐s task, and this occurred without any decline in the force performance of PD patients with repeated pulses. Third, the cerebellum was not hyperactive in drug naïve PD patients for either grip force task, suggesting that cerebellar compensation has yet to occur in early stages of the disease prior to treatment. Each of these three novel findings are discussed below.
Hypoactivation in the Basal Ganglia‐Thalamo‐Cortical Loop
A previous fMRI study of drug‐naïve PD patients found reduced activation in the bilateral SMA and contralateral M1 compared to controls during a finger tapping task (Buhmann et al., 2003). The current observations are in agreement with this previous study, although the current study found BOLD hypoactivation in M1 and SMA only during the 2‐s task. The 2‐s task, which required more switching between contracting and relaxing of muscle than the 4‐s task, is more similar to the finger tapping task used in the study by Buhmann et al. (2003). Most importantly, the current findings extend the work of Buhmann et al. (2003) by providing the first demonstration in humans that all BG nuclei are functioning abnormally during the performance of specific repetitive tasks in PD patients who have not yet started medication.
Other human neuroimaging work has identified BG regions where there are differences between PD patients and controls at rest. For instance, PET (Eckert et al., 2007; Eidelberg et al., 1997; Ma et al., 2007) and single photon emission tomography (SPECT) (Feigin et al., 2007) studies have shown that, when at rest, PD patients off medication have increased perfusion and glucose metabolism relative to controls in putamen and globus pallidus. This increased metabolism at rest could result in a reduced BOLD response during force production. As such, the two BG areas (putamen and globus pallidus) that were hypoactive in the 4‐s force task could be caused by altered metabolism at rest. However, as we found additional areas with hypoactive BOLD in the PD group during the 2‐s task, it seems unlikely that hypermetabolism at rest explains the findings in caudate, STN, and SN. In addition, the group by TR interaction was not significant for the 4‐s task, but was significant for the 2‐s task (Tables II and III). This difference in the dynamics between the 2‐s task and the 4‐s task suggests that mechanisms related to the force task may explain the dynamics of the BOLD signal in BG nuclei in the current study rather than increased resting metabolism. Further studies are required to explain the relationship between resting metabolic changes in PD and the BOLD response underlying movement tasks in different BG nuclei.
Other PET work has found that the density of dopaminergic terminals (Ouchi et al., 2005) and dopamine uptake (Bruck et al., 2006) in the striatum was significantly reduced in drug naïve PD compared to controls. Moreover, dopamine uptake was more affected in the dorsocaudal putamen than the rostrocaudal putamen, and the caudate was least affected (Bruck et al., 2006; Thobois et al., 2004). These metabolic deficiencies complement observations of functional studies in which PD patients express abnormal BG activity while performing different motor tasks. For instance, two PET studies found that the putamen has reduced rCBF in PD compared to controls during self‐initiated finger movements (Jahanshahi et al., 1995) and joystick movements (Playford et al., 1992). Also, an fMRI study observed reduced BOLD activation in putamen of PD patients relative to controls during a finger‐tapping task (Yu et al., 2007). Therefore, the current observations that the putamen and GPe are deficient in drug naïve PD during both tasks are in line with previous neuroimaging findings. Moreover, the current study has shown that all BG nuclei including the caudate, putamen, GPe, GPi, STN, and SN are hypoactive in drug‐naïve PD when compared to controls during the 2‐s task. This raises the question as to why the current study found such robust differences in all BG nuclei during the 2‐s task, whereas previous neuroimaging studies of PD have only detected differences in selective BG nuclei.
The most likely explanation for the current observations is that deficient neural activation only becomes detectable in all BG nuclei during tasks that require rapid switching between the production and cessation of force. Previous studies have proposed that the BG are involved in regulating the switching from one movement to another (Cools et al., 1984; Giladi et al., 1997; Weiss et al., 1997). Whereas the 4‐s task required subjects to quickly produce force and sustain force for six, 4 s pulses, the 2‐s task required subjects to produce force for shorter duration ten 2‐s pulses. There was a greater number of force increases and force decreases (i.e., switching) during the 2 s task. Thus, it could be that a greater number of transitions between increasing and decreasing force revealed such robust effects in the BOLD signal during the 2 s task. It is also a fact that there were behavioral differences between the PD group and the healthy group in the performance of the tasks that include differences in the rate of force increase and decrease. For example, it is possible that producing more contractions and relaxations during the 2 s task amplified the bradykinetic effects of the PD patients, and this resulted in the robust effects in the BOLD signal during the 2 s task.
Previous work using finger tapping has shown that when PD patients perform repetitive sequences of movements, their movements become more bradykinetic with repeated task performance (Georgiou et al., 1994; Penn et al., 1998; Rand and Stelmach, 1999; Stelmach et al., 1987). While the current study found that drug‐naïve patients with PD were bradykinetic, the bradykinesia was not accentuated as the task block progressed. In contrast, there was greater hypoactivity in BOLD activation of the PD patients later in the task blocks than earlier. Previous work that has shown a time‐dependent behavioral effect has only investigated patients that have been chronically exposed to anti‐Parkinson medications. Thus, one possible explanation for this discrepancy is that enhanced bradykinetic deficits with repeated task performance are not observed in early‐stage, drug‐naïve PD patients. It is also possible that the current study would have observed enhanced bradykinetic effects over time if the trial length and number of pulses increased. Nevertheless, the current findings suggest that the BOLD signal in the BG may detect changes that precede a behavioral deficit in early‐stage PD.
Previous research has examined the dynamic time course of BOLD activation in focal hand dystonia during a bimanual finger‐tapping task (Blood et al., 2004). Blood et al. (2004) found that the caudate, putamen, and globus pallidus of dystonic patients became hyperactive relative to controls. The authors also found that the hyperactivity became progressively worse during the block and remained hyperactive after patients stopped performing the task. The authors posited that the abnormal hyperactivity may reflect dysfunctional inhibitory control within the BG. As dystonia is characterized as a hyperkinetic movement disorder and PD is characterized as a hypokinetic movement disorder, the current observation of progressively impaired hypoactivity in the BOLD signal of PD patients is consistent with this model of PD as a hypokinetic movement disorder.
BOLD Activation in the Cerebellum
Previous neuroimaging work found that the cerebellum is hyperactive in PD compared to controls during motor tasks. A SPECT study was the first to observe that the ipsilateral cerebellum of PD patients off anti‐Parkinson medication had greater rCBF than controls during sequential finger‐to‐thumb opposition movements (Rascol et al., 1997). When PD patients were on anti‐Parkinson medication, the relative increase in cerebellar rCBF was not observed. fMRI studies also found that the cerebellum is hyperactive in PD patients relative to controls during sequential finger movements (Wu and Hallett, 2005) and repetitive thumb movements (Yu et al., 2007). Also, BOLD activation in the cerebellum was negatively correlated with the BOLD signal in the putamen during the thumb movement task (Yu et al., 2007). All of these studies suggest that hyperactivation in the cerebellum of PD patients may be compensating for dysfunctional BG signaling (Rascol et al., 1997; Wu and Hallett, 2005; Yu et al., 2007). In the current study there were no differences in BOLD activation in the cerebellum between PD patients and controls during either motor task. The current study investigated early‐stage, drug‐naïve PD patients while the other studies tested PD patients with greater disease severity that had been chronically exposed to anti‐Parkinson medication. Thus, the current results support the hypothesis that cerebellar hyperactivation is indeed compensatory, and that the cerebellar compensation may only emerge at a later stage of PD or following chronic levodopa therapy.
In summary, these findings provide the first evidence that early on in the course of PD, all nuclei of the BG are hypoactive during the performance of a motor task that requires more switching, and that this hypoactivity becomes more pronounced with repeated task performance. Dynamic changes in the BOLD signal in the BG may precede a behavioral deficit in early‐stage PD, and early‐stage PD may not yet show compensatory mechanisms in the cerebellum.
Acknowledgements
We thank the patients for their time and commitment to this research.
REFERENCES
- Blood AJ,Flaherty AW,Choi JK,Hochberg FH,Greve DN,Bonmassar G,Rosen BR,Jenkins BG ( 2004): Basal ganglia activity remains elevated after movement in focal hand dystonia. Ann Neurol 55: 744–748. [DOI] [PubMed] [Google Scholar]
- Bruck A,Aalto S,Nurmi E,Vahlberg T,Bergman J,Rinne JO ( 2006): Striatal subregional 6‐[18F]fluoro‐L‐dopa uptake in early Parkinson's disease: A two‐year follow‐up study. Mov Disord 21: 958–963. [DOI] [PubMed] [Google Scholar]
- Buhmann C,Glauche V,Sturenburg HJ,Oechsner M,Weiller C,Buchel C ( 2003): Pharmacologically modulated fMRI—cortical responsiveness to levodopa in drug‐naive hemiparkinsonian patients. Brain 126 ( Pt 2): 451–461. [DOI] [PubMed] [Google Scholar]
- Cools AR,Jaspers R,Schwarz M,Sontag KH,Vrijmoed‐de Vries M,van den Bercken J ( 1984): Basal ganglia and switching motor programs In: McKenzie JS, Kemm RE, Wilcock LN, editors. The Basal Ganglia Structure and Function. New York: Plenum Press, pp 513–544. [Google Scholar]
- Dirnberger G,Frith CD,Jahanshahi M ( 2005): Executive dysfunction in Parkinson's disease is associated with altered pallidal‐frontal processing. Neuroimage 25: 588–599. [DOI] [PubMed] [Google Scholar]
- Eckert T,Tang C,Eidelberg D ( 2007): Assessment of the progression of Parkinson's disease: A metabolic network approach. Lancet Neurol 6: 926–932. [DOI] [PMC free article] [PubMed] [Google Scholar]
- Eidelberg D,Moeller JR,Kazumata K,Antonini A,Sterio D,Dhawan V,Spetsieris P,Alterman R,Kelly PJ,Dogali M,Fazzini E,Beric A ( 1997): Metabolic correlates of pallidal neuronal activity in Parkinson's disease. Brain 120 ( Pt 8): 1315–1324. [DOI] [PubMed] [Google Scholar]
- Feigin A,Kaplitt MG,Tang C,Lin T,Mattis P,Dhawan V,During MJ,Eidelberg D ( 2007): Modulation of metabolic brain networks after subthalamic gene therapy for Parkinson's disease. Proc Natl Acad Sci USA 104: 19559–19564. [DOI] [PMC free article] [PubMed] [Google Scholar]
- Fleminger S ( 1992): Control of simultaneous movements distinguishes depressive motor retardation from Parkinson's disease and neuroleptic parkinsonism. Brain 115 ( Pt 5): 1459–1480. [DOI] [PubMed] [Google Scholar]
- Georgiou N,Bradshaw JL,Iansek R,Phillips JG,Mattingley JB,Bradshaw JA ( 1994): Reduction in external cues and movement sequencing in Parkinson's disease. J Neurol Neurosurg Psychiatry 57: 368–370. [DOI] [PMC free article] [PubMed] [Google Scholar]
- Giladi N,Kao R,Fahn S ( 1997): Freezing phenomenon in patients with parkinsonian syndromes. Mov Disord 12: 302–305. [DOI] [PubMed] [Google Scholar]
- Grafton ST,Turner RS,Desmurget M,Bakay R,Delong M,Vitek J,Crutcher M ( 2006): Normalizing motor‐related brain activity: Subthalamic nucleus stimulation in Parkinson disease. Neurology 66: 1192–1199. [DOI] [PubMed] [Google Scholar]
- Hughes AJ,Ben‐Shlomo Y,Daniel SE,Lees AJ ( 2001): What features improve the accuracy of clinical diagnosis in Parkinson's disease: A clinicopathologic study. Neurology 57 ( 10 Suppl. 3): S34–S38. [PubMed] [Google Scholar]
- Hughes AJ,Daniel SE,Kilford L,Lees AJ ( 1992): Accuracy of clinical diagnosis of idiopathic Parkinson's disease: A clinico‐pathological study of 100 cases. J Neurol Neurosurg Psychiatry 55: 181–184. [DOI] [PMC free article] [PubMed] [Google Scholar]
- Jahanshahi M,Jenkins IH,Brown RG,Marsden CD,Passingham RE,Brooks DJ ( 1995): Self‐initiated versus externally triggered movements. I. An investigation using measurement of regional cerebral blood flow with PET and movement‐related potentials in normal and Parkinson's disease subjects. Brain 118 ( Pt 4): 913–933. [DOI] [PubMed] [Google Scholar]
- Ma Y,Tang C,Spetsieris PG,Dhawan V,Eidelberg D ( 2007): Abnormal metabolic network activity in Parkinson's disease: Test–retest reproducibility. J Cereb Blood Flow Metab 27: 597–605. [DOI] [PMC free article] [PubMed] [Google Scholar]
- Mayka MA,Corcos DM,Leurgans SE,Vaillancourt DE ( 2006): Three‐dimensional locations and boundaries of motor and premotor cortices as defined by functional brain imaging: A meta‐analysis. Neuroimage 31: 1453–1474. [DOI] [PMC free article] [PubMed] [Google Scholar]
- Ouchi Y,Yoshikawa E,Sekine Y,Futatsubashi M,Kanno T,Ogusu T,Torizuka T ( 2005): Microglial activation and dopamine terminal loss in early Parkinson's disease. Ann Neurol 57: 168–175. [DOI] [PubMed] [Google Scholar]
- Penn RD,Kroin JS,Reinkensmeyer A,Corcos DM ( 1998): Injection of GABA‐agonist into globus pallidus in patient with Parkinson's disease. Lancet 351: 340–341. [DOI] [PubMed] [Google Scholar]
- Playford ED,Jenkins IH,Passingham RE,Nutt J,Frackowiak RS,Brooks DJ ( 1992): Impaired mesial frontal and putamen activation in Parkinson's disease: A positron emission tomography study. Ann Neurol 32: 151–161. [DOI] [PubMed] [Google Scholar]
- Prodoehl J,Yu H,Little DM,Abraham I,Vaillancourt DE ( 2008): Region of interest template for the human basal ganglia: Comparing EPI and standardized space approaches. Neuroimage 39: 956–965. [DOI] [PMC free article] [PubMed] [Google Scholar]
- Rand MK,Stelmach GE ( 1999): Effects of increased stroke number on sequential arm movements in Parkinson's disease subjects. Parkinsonism Relat Disord 5: 27–35. [DOI] [PubMed] [Google Scholar]
- Rascol O,Sabatini U,Fabre N,Brefel C,Loubinoux I,Celsis P,Senard JM,Montastruc JL,Chollet F ( 1997): The ipsilateral cerebellar hemisphere is overactive during hand movements in akinetic parkinsonian patients. Brain 120 ( Pt 1): 103–110. [DOI] [PubMed] [Google Scholar]
- Sabatini U,Boulanouar K,Fabre N,Martin F,Carel C,Colonnese C,Bozzao L,Berry I,Montastruc JL,Chollet F et al. ( 2000): Cortical motor reorganization in akinetic patients with Parkinson's disease: A functional MRI study. Brain 123 ( Pt 2): 394–403. [DOI] [PubMed] [Google Scholar]
- Samuel M,Ceballos‐Baumann AO,Turjanski N,Boecker H,Gorospe A,Linazasoro G,Holmes AP,DeLong MR,Vitek JL,Thomas DG et al. ( 1997): Pallidotomy in Parkinson's disease increases supplementary motor area and prefrontal activation during performance of volitional movements an H2(15)O PET study. Brain 120 ( Pt 8): 1301–1313. [DOI] [PubMed] [Google Scholar]
- Spraker MB,Corcos DM,Vaillancourt DE ( 2009): Cortical and subcortical mechanisms for precisely controlled force generation and force relaxation. Cereb Cortex 19: 2640–2650. [DOI] [PMC free article] [PubMed] [Google Scholar]
- Stelmach GE,Worringham CJ,Strand EA ( 1987): The programming and execution of movement sequences in Parkinson's disease. Int J Neurosci 36: 55–65. [DOI] [PubMed] [Google Scholar]
- Thobois S,Jahanshahi M,Pinto S,Frackowiak R,Limousin‐Dowsey P ( 2004): PET and SPECT functional imaging studies in Parkinsonian syndromes: From the lesion to its consequences. Neuroimage 23: 1–16. [DOI] [PubMed] [Google Scholar]
- Thulborn KR ( 1999): Visual feedback to stabilize head position for fMRI. Magn Reson Med 41: 1039–1043. [DOI] [PubMed] [Google Scholar]
- Vaillancourt DE,Spraker MB,Prodoehl J,Abraham I,Corcos DM,Zhou XJ,Comella CL,Little DM ( 2009): High‐resolution diffusion tensor imaging in the substantia nigra of de novo Parkinson disease. Neurology 72: 1378–1384. [DOI] [PMC free article] [PubMed] [Google Scholar]
- Vaillancourt DE,Thulborn KR,Corcos DM ( 2003): Neural basis for the processes that underlie visually guided and internally guided force control in humans. J Neurophysiol 90: 3330–3340. [DOI] [PubMed] [Google Scholar]
- Weiss P,Stelmach GE,Hefter H ( 1997): Programming of a movement sequence in Parkinson's disease. Brain 120 ( Pt 1): 91–102. [DOI] [PubMed] [Google Scholar]
- Wu T,Hallett M ( 2005): A functional MRI study of automatic movements in patients with Parkinson's disease. Brain 128 ( Pt 10): 2250–2259. [DOI] [PubMed] [Google Scholar]
- Yu H,Sternad D,Corcos DM,Vaillancourt DE ( 2007): Role of hyperactive cerebellum and motor cortex in Parkinson's disease. Neuroimage 35: 222–233. [DOI] [PMC free article] [PubMed] [Google Scholar]