

Abstract
The neural functions of signaling are carried out by the interconnection of neurons via neuronal fibers. Diffusion tensor imaging has recently become an established technique that enables the in vivo visualization of white matter (WM) fibers. Studies of normal aging have suggested the disruption of WM fiber microstructures with anterior–posterior gradient. Because neuronal activity is tightly coupled with glucose metabolism, neuronal death or a decrease in synaptic activity with aging may cause a decrease in glucose metabolism in the brain. We examined whether the disruption of callosal fiber microstructures in the healthy elderly is accompanied by changes in regional glucose metabolism (rMGlu) in the brain. Fifteen healthy volunteers in their seventies participated. Fractional anisotropies (FAs) of the genu and splenium of the corpus callosum (CC) were measured for each subject, and their correlations with rMGlu were analyzed using SPM2 software. We found a statistically significant positive correlation of rMGlu in the bilateral frontal cortices with the FA of the genu of the CC, whereas there was no correlation of the FA of the splenium of the CC and rMGlu. By voxel‐based morphometry, we found no decrease in gray matter concentration associated with FA. The results indicate that neuronal activity in the frontal cortices may decrease with the disruption of the microstructures of the CC without corresponding gray matter atrophy. Hum Brain Mapp, 2008. © 2007 Wiley‐Liss, Inc.
Keywords: diffusion tensor imaging, aging, glucose metabolism, frontal cortex, corpus callosum, fractional anisotropy
INTRODUCTION
Neuronal activity is tightly coupled with glucose utilization [Magistretti, 2000; Shulman et al., 2004]; therefore, neuronal death or a decrease in synaptic activity with aging likely results in a decrease in glucose metabolism in the brain. Glucose metabolism in the human brain has been measured by positron emission tomography (PET) and 18F‐fluoro‐d‐deoxyglucose (18F‐FDG) to resolve changes with healthy aging, and results have been discrepant in terms of global and regional glucose metabolisms [Creasey and Rapoport, 1985]. The discrepancies in the results of previous studies are partly attributed to differences in PET apparatus and analytical methods used as well as to differences in the selection of subjects, because cerebral glucose metabolism has been reported to reduce in the frontal cortex in association with severe white matter (WM) hyperintensity [DeCarli et al., 1995] as well as in several parts of the cerebral cortex and subcortical nuclei in association with hypertension [Salerno et al., 1995]. Recent studies, however, have consistently demonstrated both global and regional decreases in glucose metabolism, particularly in the frontal and perisylvian cortices in healthy aging [Moeller et al., 1996; Petit‐Taboue et al., 1998; Willis et al., 2002]. On the other hand, brain atrophy in the elderly causes partial volume averaging of the brain with expanded cerebrospinal fluid (CSF) space in PET images due to limited spatial resolution. Several studies depicted that the partial volume averaging results in an apparent decrease in cerebral blood flow (CBF) [Meltzer et al., 2000] and cerebral glucose metabolism [Ibanez et al., 1998, 2004; Yanase et al., 2005] in the elderly, which could be corrected using high‐resolution anatomic magnetic resonance imaging (MRI).
Recent studies using MRI have demonstrated volume loss with age in the gray matter (GM) [Good et al., 2001; Pfefferbaum et al., 1994; Taki et al., 2004] or WM [Guttmann et al., 1998], or both, although more prominent in the GM [Courchesne et al., 2000; Raz et al., 1997; Resnick et al., 2003]. In spite that the volume loss of brain tissues measured by MRI has been observed more prominently in the GM, histopathological studies have demonstrated the age‐related loss of myelinated fibers and degenerations of myelin in the WM [Marner et al., 2003; Meier‐Ruge et al., 1992; Peters, 2002]; however, neuronal loss in the GM is not prominent [Morrison and Hof, 1997; Peters et al., 1998]. For the investigation of the integrity of WM fiber microstructures, diffusion tensor imaging (DTI) has recently become an established technique that provides information on tissue microstructures and architectures for each voxel [Basser et al., 1994a, b; Le Bihan, 2003]. DTI provides several quantitative measures such as mean diffusivity and fractional anisotropy (FA) [Basser and Pierpaoli, 1996]. Mean diffusivity (〈D〉) is the directionally averaged magnitude of diffusion within a voxel, and is usually high in tissues with a large fraction of mobile fluid [Pfefferbaum and Sullivan, 2003; Pierpaoli et al., 2001]. On the other hand, FA is a measure of the orientational coherence of water diffusion and indexes WM integrity [Pierpaoli and Basser, 1996]. FA is higher in tissues with anisotropic structures, such as in the corpus callosum (CC) and pyramidal tract, lower in tissues where fiber orientations are more inhomogeneous, such as with crossing fibers and degenerated fibers, and much lower in more isotropic regions such as in the GM and CSF space [Abe et al., 2002; Head et al., 2004; Pfefferbaum et al., 2000; Pierpaoli and Basser, 1996; Pierpaoli et al., 2001]. Several studies of normal aging showed a significant reduction in FA in the whole brain [Rovaris et al., 2003] and in the CC and centrum semiovale [Pfefferbaum and Sullivan, 2003], as well as in deep WM regions [Head et al., 2004; Pfefferbaum et al., 2000]. A decrease in FA could be associated with an increase in 〈D〉, which suggests that tissue loss is replaced by free water accumulation in the interstitial tissue, whereas a small change in 〈D〉 suggests that tissue loss is replaced by gliosis or an extracellular matrix [Basser, 1995; Pierpaoli et al., 2001]. Recent studies, however, have shown a decrease in FA and an increase in 〈D〉 in age‐related changes of the brain [Abe et al., 2002; Bhagat and Beaulieu, 2004; Head et al., 2004; O'Sullivan et al., 2001; Pfefferbaum and Sullivan, 2003], and a decrease in the FA of the WM with aging has been considered to reflect nerve fiber loss and myelin degeneration. Because the neural functions of signaling are carried out by the interconnection of neurons via neuronal fibers, the degeneration of WM fiber microstructures could be associated with deterioration in the neural activity of the GM. Several studies have also demonstrated that there is an anterior–posterior gradient in the effect of age during normal aging in callosal fibers, that is, the FA decrease, as well as the 〈D〉 increase, is more prominent in the anterior callosum than in the posterior callosum in healthy aging [Abe et al., 2002; Head et al., 2004; Pfefferbaum et al., 2000]. Changes in regional glucose metabolism (rMGlu) associated with the deterioration of microstructures of the anterior callosal fibers, thereafter, would be greater than that associated with the posterior callosal fibers. The anterior callosal fibers have been shown to connect the lateral, medial, and basal anterior frontal cortex between hemispheres, and the posterior CC fibers have been shown to connect cortices in the posterior part of the brain between hemispheres [Abe et al., 2004; Nieuwenhuys et al., 1988]. The association of rMGlu with FA or 〈D〉, therefore, could be greater in the anterior part of the brain in the healthy elderly.
In this study, we examined whether the deterioration of callosal fiber microstructures is associated with a change in rMGlu in the brain, as measured by 18F‐FDG PET in normal elderly subjects. We also performed voxel‐based morphometry (VBM) for the GM and WM to examine whether there is a correlation between FA or 〈D〉 and regional GM or WM concentration, to examine possible morphological changes in the GM or WM that correlate with FA or 〈D〉, which could result in an apparent correlation of FA or 〈D〉 with rMGlu due to partial volume averaging.
MATERIALS AND METHODS
Subjects
Fifteen healthy volunteers in their seventies (8 males, 7 females; mean age 73.0 ± 2.2 year, range 70−78 years) participated. The subjects were recruited from participants of a research program on brain aging among city dwellers conducted by the Tohoku University, who were screened to exclude subjects having dementia or depression by assessing cognitive function on the basis of the Mini Mental State Examination (MMSE) [Folstein et al., 1975] score > 23 and depressive symptoms on the basis of the Geriatric Depression Scale (GDS) [Yesavage et al., 1982] score < 15. Of the 224 participants, only those who did not have a history of a major medical disease including diabetes and hypertension, as well as neurological or psychiatric disease, and who had normal T1‐ and T2‐weighted MR brain images or minor deep WM hyperintensities (DWMH) or minor periventricular hyperintensities (PVH) on a T2‐weighted image were recruited for this study. Hyperintense signal abnormalities were rated using Fazekas' rating scale, which provides 2 scores on a 0–3 scale that is graded as follows: PVH = 0 (absence), 1 (“caps” or pencil‐lining), 2 (smooth “halo”), 3 (irregular PVH extending into the deep WM); and DWMH = 0 (absence), 1 (punctuate foci), 2 (beginning confluence of foci), 3 (large confluent areas) [Fazekas et al., 1987]. Subjects who had silent infarctions or subcortical lacunae were excluded. The MMSE and GDS scores of the present subjects were 29.2 ± 0.9 and 5.1 ± 2.9, respectively. The Fazekas' scale of the present subjects was 9 subjects in 0 grade and 6 subjects in 1 grade of PVH, and 7 subjects in 0 grade, 7 subjects in 1 grade, and 1 subject in 2 grade of DWMH. The study was approved by the local ethics committees of the Department of Medicine and the Cyclotron Radioisotope Center, Tohoku University. Written informed consent was obtained from all the subjects after a proper explanation of the study being conducted, according to the Code of Ethics of the World Medical Association.
Positron Emission Tomography
All the subjects fasted for at least 5 h before 18F‐FDG injection. Blood glucose level was measured before the injection, and the mean blood glucose level of the subjects was 100 ± 12 mg/dl. The mean injected dose of 18F‐FDG was 217 ± 32 MBq. PET scans were obtained using a SET2400W scanner (Shimadzu, Kyoto, Japan), which acquired 63 planes simultaneously over a 200‐mm axial field of view (FOV) with an in‐plane spatial resolution of 3.9 mm at full width at half maximum (FWHM) and an axial spatial resolution of 4.5‐mm FWHM [Fujiwara et al., 1997]. An emission scan was obtained for 10 min, starting 45 min after the injection of 18F‐FDG. The subjects were instructed to sit quietly on a sofa with their eyes closed in a dimly lit room during the period from the injection to the scanning. A transmission scan was obtained for 7–10 min with a 68Ge/68Ga rod source for attenuation correction before or after the emission scan after the tracer injection. PET images were reconstructed by filtered back projection using a Butterworth‐ramp filter (order, 2; cutoff frequency, 8 mm) with measured attenuation, dead time, and decay correction factors.
Magnetic Resonance Imaging
All MR imaging studies were performed using the Symphony 1.5‐T system (Siemens, Erlangen, Germany) equipped with gradient coils producing a maximum amplitude of 30 mT/m for fast image acquisition. The subjects were imaged in the standard Siemens circularly polarized head RF coil. A three‐dimensional volumetric T1‐weighted image (T1WI) was obtained as a gapless series of thin transverse sections using a MPRAGE sequence (TE/TR, 5.5/2,180 ms; 25‐cm FOV; acquisition matrix, 256 × 256; slice thickness, 1.5 mm). A T2‐weighted image and a proton density image were acquired using a dual echo sequence (TE/TE/TR, 14/86/9,610 ms; 25‐cm FOV; acquisition matrix, 256 × 256; slice thickness, 3.0 mm).
Diffusion‐weighted images were acquired by single‐shot diffusion‐weighted spin‐echo echo planar imaging with the following parameters: TE/TR, 115/5,600 ms; NEX, 4; acquisition matrix, 128 × 128; 25 cm FOV, and thirty 5.0‐mm‐thick axial slices with a 0.5‐mm interslice gap, aligned with the anterior and posterior commissures (AC‐PC). The in‐plane resolution was 1.95 × 1.95 mm2. The diffusion tensor was acquired for each slice with six sets involving diffusion gradients placed along noncollinear directions (b = 1,000 s/mm2): (x,y,z) = [(1,1,0), (0,1,1), (1,0,1), (−1,1,0), (0,−1,1), (1,0,−1)], and an individual set without diffusion weighting (b = 0 s/mm2) [Basser and Pierpaoli, 1998]. Total scan time for diffusion‐weighted images were 14 min. DTIs were processed offline using Dr. View/LINUX software (Asahi Kasei Information Systems, Tokyo, Japan) to generate FA and 〈D〉 images [Basser and Pierpaoli, 1996].
ROI Measurement of FA, 〈D〉, and Area of CC
To measure FA and 〈D〉 of CC, regions of interest (ROIs) were drawn on each b0 image using a 3D ROI function of MRIcro software (v. 1.38) [Rorden and Brett, 2000]. ROIs were placed on the splenium (SCC) and genu (GCC) of the CC (Fig. 1). The b0 images were used for ROI setting to avoid using FA images, because this would exclude WM regions with a low FA and bias the selection of the ROI site. To place an ROI, a seed point was first determined in the middle of the GCC and SCC, respectively, on axial slices of a b0 image where each structure was most reliably visible, using sagittal slices of the b0 image as well as T1WI and T2WI as visual references. An ROI with a radius of 6 mm was then drawn to include the neighboring axial slices. Voxels that had a difference of more than 10% in signal intensity from the seed point in the b0 image were excluded to prevent partial volume averaging with voxels including CSF, which had significantly high signal intensity. Therefore, ROIs were irregularly shaped due to the exclusion of the CSF based on the intensity threshold. Because we found correlations between the FA as well as 〈D〉 of the GCC and rMGlu of the frontal cortex as described later, we also placed ROIs on deep WM of the frontal lobe (FDWM) to check if possible fiber changes in the FDWM would associate with cortical rMGlu. A ROI was placed in the similar manner as described earlier on the FDWM of each hemisphere on the anterolateral part of the anterior horn of the lateral ventricle, where the upper part of the thalamus was visible to avoid CC, internal capsule, as well as GM and the lateral ventricle (Fig. 1).
Figure 1.
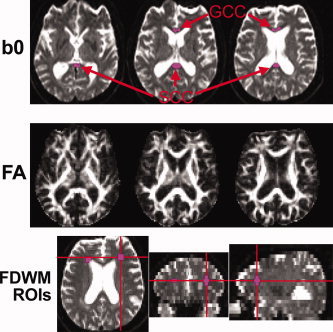
Example of regions of interest (ROIs) placed on the genu and splenium of corpus callosum (GCC and SCC, respectively) and on the deep WM of the frontal lobe (FDWM) bilaterally using each subject's b0 images on the slice with the seed point as well as on the neighboring upper and lower slices. ROIs were overlaid on the fractional anisotropy (FA) and mean diffusivity (〈D〉) images (not shown) for analysis. The subject in this figure was a 74‐year‐old male. In this subject, the GCC ROI did not extend to the lower slice because of intensity thresholding.
CC areas were also measured to check the possible effect of CC atrophy on rMGlu using the Analyze software (http://www.mayo.edu/bir/Software/Analyze/Analyze.html). The AC‐PC was manually identified on the volumetric T1WI, and the T1WI was oriented by rotations with the AC as the pivot point. The image volumes were then aligned so that an image that passed through the AC‐PC line was a straight axial section. At the midsagittal plane, the GCC and SCC were subdivided using intensity thresholding and vertical lines perpendicular to an axial plane through the inner edge of the GCC and SCC, respectively (Fig. 2). Intracranial volumes were measured separately on the T1WI using the cross‐sectional version of the Structural Imaging Evaluation of Normalized Atrophy software [Smith et al., 2002], and applied to correct the CC areas.
Figure 2.
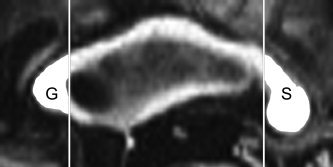
CC areas were measured in the GCC (G) and SCC (S) on the midsagittal image of a volumetric T1WI that was aligned as the AC‐PC line was on a straight axial section.
Image Processing
The image processing and correlation analyses of PET images and VBM analysis were performed using Matlab 6.5.1 (Mathworks, Natick, USA) and SPM2 software (http://www.fil.ion.ucl.ac.uk/spm/). Each PET image was coregistered to a corresponding T1WI. Linear and nonlinear parameters for anatomical normalization to the ICBM 152 template T1WI (Montreal Neurological Institute) were estimated for each T1WI, and applied to the anatomical normalization of both PET image and T1WI [Ashburner and Friston, 1999]. PET images were smoothed using a Gaussian kernel of 16 mm FWHM to compensate for individual anatomical differences. Each whole brain T1WI was segmented into the GM, WM, and CSF images using a clustering algorithm, calculating a Bayesian probability of belonging to each tissue for each voxel using a priori probability images of the GM, WM, and CSF with inhomogeneity correction for the magnetic field [Ashburner and Friston, 1997, 2000]. GM and WM images were then smoothed using a Gaussian kernel of 12‐mm FWHM.
Analysis
The correlations of FA, 〈D〉, age, MMSE score, and GDS score were assessed using SPSS 11.0J software (SPSS, Chicago) and Spearman's rank correlation coefficient (Spearman's ρ) with a statistical threshold of P < 0.05. The correlations between FA as well as 〈D〉 and the area of the GCC and SCC, respectively, were also tested in the same manner.
Statistical analysis for PET images was performed using the “single subject and covariate only” model of SPM2. The global counts of qualitative PET images were scaled to the global mean value of 100 for analysis, and the global counts were treated as a covariate. Because we found a highly significant correlation between FA and 〈D〉 as expected, only the FA for each ROI was used as a covariate. The fibers of the GCC connect the lateral, medial, and basal anterior frontal cortex between hemispheres, and those of the SCC connect cortices in the posterior part of the brain between hemispheres [Abe et al., 2004; Nieuwenhuys et al., 1988]. Therefore, we restricted the voxels of the PET images to be analyzed using the ROI function of WFU PickAtlas software [Maldjian et al., 2003]. Practically, the correlation of FA in the GCC with rMGlu was analyzed using ROIs of frontal gyri, anterior cigulate, subcallosal gyrus, rectal gyrus, and orbital gyrus bilaterally. For analysis of the correlation of the FA of the SCC with rMGlu, the ROIs of the parietal, temporal, and occipital gyri, angular gyrus, supramarginal gyrus, posterior cingulate, cuneus, precuneus, parahippocampal gyrus, lingual gyrus, and fujiform gyrus were applied. We also performed VBM analysis of the GM and WM [Ashburner and Friston, 2000; Good et al., 2001] to examine whether there are correlations of GM and WM concentrations with FA that would cause an apparent correlation of rMGlu with FA due to partial volume averaging. The same model and statistical threshold used in the analysis of the PET images were used for VBM analysis. The statistical threshold of image analysis using SPM2 was set at P < 0.05 (false discovery rate corrected for multiple comparisons) [Genovese et al., 2002].
RESULTS
The means ± SD values of FA and 〈D〉, and Spearman's ρ for the correlation of FA with 〈D〉 for each CC ROI were 0.64 ± 0.08, 0.98 ± 0.13 (10−3 mm2/s), ρ = −0.78 (P < 0.01) in the GCC, and 0.74 ± 0.07, 0.85 ± 0.06 (10−3 mm2/s), ρ = −0.87 (P < 0.01) in the SCC, respectively. Neither FA nor 〈D〉 showed statistically significant correlation with age, MMSE, GDS, or corresponding corrected areas of CC, except that there was a statistically significant correlation between 〈D〉 for SCC and corrected areas of SCC, as summarized in Table I. FA of the FDWM (right: 0.24 ± 0.03, left: 0.27 ± 0.03) did not show statistically significant correlation with FA or 〈D〉 of the GCC, though there were statistically significant correlations between 〈D〉 of the FDWM (right: 0.81 ± 0.05, left: 0.82 ± 0.05 (10−3 mm2/s)) and FA and/or 〈D〉 of the GCC (Table I).
Table I.
Correlation coefficient (Spearman's ρ; upper row) and statistical significance of the correlation(lower row) of fractional anisotropy (FA) and mean diffusivity (〈D〉) for each CC ROI with age, MMSE, GDS‐corrected CC areas, and FA and 〈D〉 for deep white matter of the frontal lobe (FDWM)
| ROI | Age | MMSE | GDS | C‐GCCa | C‐SCCa | Rt‐FDWM FA | Rt‐FDWM〈D〉 | Lt‐FDWMFA | Lt‐FDWM〈D〉 |
|---|---|---|---|---|---|---|---|---|---|
| GCC FA | −0.39 | 0.16 | −0.12 | 0.15 | — | 0.36 | −0.65* | 0.37 | −0.51* |
| P > 0.1 | P > 0.5 | P > 0.6 | P > 0.5 | P > 0.1 | P < 0.01 | P > 0.1 | P < 0.05 | ||
| GCC 〈D〉 | 0.39 | −0.31 | −0.10 | −0.34 | — | −0.38 | 0.65* | −0.48 | 0.43 |
| P > 0.1 | P > 0.2 | P > 0.7 | P > 0.2 | P > 0.1 | P < 0.01 | P = 0.05 | P > 0.1 | ||
| SCC FA | −0.31 | 0.25 | 0.12 | — | 0.45 | — | — | — | — |
| P > 0.2 | P > 0.3 | P > 0.6 | P = 0.09 | ||||||
| SCC 〈D〉 | −0.03 | −0.39 | 0.07 | — | −0.62* | — | — | — | — |
| P > 0.9 | P > 0.1 | P > 0.8 | P < 0.05 |
GCC, genu of corpus callosum; SCC, splenium of corpus callosum; C‐GCCa/SCCa, areas of GCC/SCC corrected for intracranial volumes; Rt, right; Lt, left.
Statistically significant (P < 0.05) correlation.
We found a statistically significant positive correlation of the FA of the GCC with rMGlu in the homotopic regions of the bilateral superior frontal gyri, whose peak t values and MNI coordinates were, respectively, [right; t = 7.1, (x, y, z) = (28, 52, 34), left; t = 5.3, (x, y, z) = (−24, 48, 34)] and of the bilateral middle frontal gyrus [right; t = 7.7, (x, y, z) = (50, 12, 38), left; t = 5.3, (x, y, z) = (−46, 6, 38)] (Fig. 3a). Statistical analysis for PET images using 〈D〉 as a covariate instead of FA yielded similar results, although the correlations obtained were inversed to those obtained using FA as a covariate (Fig. 3b,c). We did not find statistically significant correlations of rMGlu either with the FA as well as 〈D〉 of the SCC or FA as well as 〈D〉 of the FDWM. In the VBM analysis, we found no statistically significant correlation of GM or WM concentration with the FA of the GCC or SCC. The corrected areas of GCC and SCC did not show statistically significant correlations with rMGlu and GM or WM concentrations.
Figure 3.
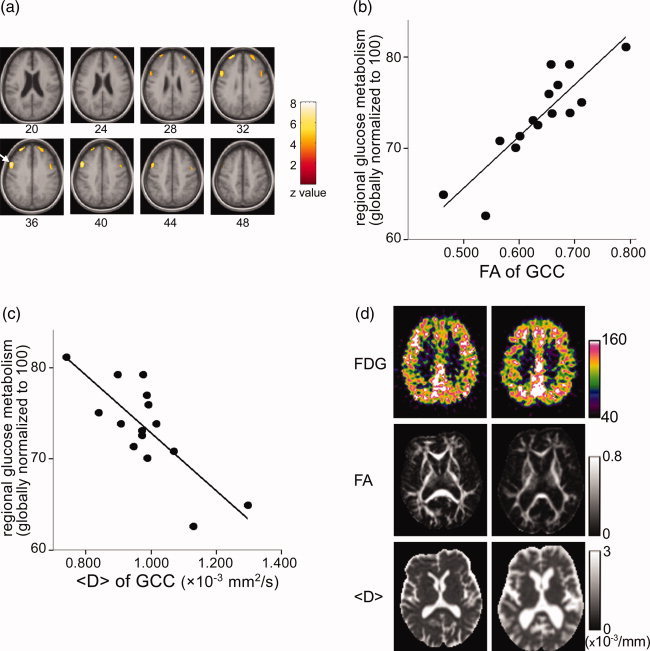
Areas that showed a statistically significant positive correlation of rMGlu with the FA of the GCC (P < 0.05, corrected for multiple comparison) (a). The right hemisphere is on the left side of the image. Numbers under the images represent the height from the AC‐PC line. The arrow points a cluster on the right middle frontal gyrus, of which a plot of the relationship between rMGlu (globally normalized to an arbitrary value of 100) and the FA (b), and the <D> (c) of the GCC is shown. Images of the representative subjects (d). The right hemisphere is on the left side of the image. The left column is a 74‐year‐old male whose GCC FA value was the highest among the subjects, and the right column is a 76‐year‐old female who had the lowest GCC FA value. FDG images had been anatomically normalized, and scaled to achieve the global mean of 100. Both images were the same height from the AC‐PC line (36 mm), to include areas that showed significant correlation of rMGlu and FA as well as <D>. FA and <D> images were quantitative images without anatomical normalization, corresponding to the height at which the seed point of the GCC ROI was placed.
DISCUSSION
In this study, we investigated the metabolic changes associated with callosal fiber microstructures by examining the correlations of the FAs of the GCC and SCC with rMGlu. The FA and 〈D〉 measured in the present study were in the range consistent with those reported for elderly [Abe et al., 2002; Bhagat and Beaulieu, 2004; Head et al., 2004; Madden et al., 2004; O'Sullivan et al., 2001; Pfefferbaum et al., 2000]. The observed correlations between FA, and 〈D〉, of the CC ROIs with the subject's age were comparable with those previously reported in CC using ROI measurement [Head et al., 2004; Pfefferbaum et al., 2000] and in the regional or global brain using histographic analysis [Benedetti et al., 2006; Rovaris et al., 2003]. The fact that all the subjects were in their seventies and small number of subjects might account for lack of statistical significant correlations between age and FA as well as 〈D〉 in the present study. We found that rMGlu in the homotopic areas of the bilateral frontal cortices decreased with a decrease in the FA of the GCC, without the corresponding GM or WM atrophy. We also found a negative correlation of 〈D〉 of the GCC with rMGlu, and the results were considered to indicate the association of the fiber microstructures of the GCC with rMGlu in the cortices similar to the association of FA with rMGlu, considering the highly significant inverse correlation of FA with 〈D〉 [Basser, 1995; Pierpaoli et al., 2001].
The inverse correlation of FA with 〈D〉 is, however, also caused by partial volume averaging between the WM and the GM or CSF [Pfefferbaum and Sullivan, 2003]. In this study, we placed ROIs on b0 images using intensity thresholding as well as T1WI and T2WI as visual references to prevent the inclusion of neighboring GM and CSF. The partial volume averaging in the b0, FA, and 〈D〉 images, however, inevitably exist in voxels at the boundary between tissues. We might have included in ROIs some voxels that contained the GM or CSF to some extent, and we might have excluded voxels that contained some WM, because it was not possible to strictly delineate voxels that were influenced by partial volume averaging. There was no reason, however, to assume that the partial volume averaging could cause systematic bias in the measurements of FA and 〈D〉 among the subjects using the present method of ROI setting by the same intensity thresholding on b0 images, but not on FA or 〈D〉 images. It was not unlikely, therefore, to consider a low FA with a high 〈D〉 in the present subjects reflecting the degeneration of neural fibers similar to those reported in aging [Abe et al., 2002; Bhagat and Beaulieu, 2004; Head et al., 2004; O'Sullivan et al., 2001; Pfefferbaum and Sullivan, 2003].
Contrary to the statistically significant correlation between the FA of the GCC and frontal rMGlu, we did not find a statistically significant correlation between the FA of the SCC and rMGlu in the posterior part of the brain. Teipel et al. [1999] found the correlation of the anterior–posterior ratio of the CC area with the frontal–parietal ratio of cortical glucose metabolism in patients of Alzheimer's disease but not in healthy controls. The decreases in the anisotropy of the posterior and the anterior part of the CC have also been reported in Alzheimer's disease [Hanyu et al., 1999]. On the other hand, in normal aging, several previous studies have shown the anterior–posterior gradient in the FA of the CC [Abe et al., 2002; Head et al., 2004; Pfefferbaum et al., 2000]. The GCC has been shown to be composed of a relatively large proportion of small‐diameter lightly myelinated fibers [Aboitiz et al., 1992], which may easily degenerate compared with large diameter fibers [Marner et al., 2003], although the pathological basis of the anterior–posterior difference as affected by age in the callosal fiber remains to be elucidated. The present results were considered to indicate that the vulnerability of anterior callosal fibers in normal aging is associated with decreases in rMGlu in the bilateral frontal cortices. However, there was little change in rMGlu in the posterior part of the brain that was correlated with the FA of the SCC, where the age effect is minimal in normal elderly.
There have been studies showing that an age‐related decrease in CBF or glucose metabolism in the brain is partly associated with partial volume averaging of brain with expanded CSF spaces caused by brain atrophy [Giovacchini et al., 2004; Ibanez et al., 2004; Meltzer et al., 2000; Yanase et al., 2005]. In this study, however, we did not find any statistically significant atrophy of the GM or WM in correlation with FA. Therefore, the results indicate that a decrease in rMGlu with a decrease in the FA of the GCC is not likely a reflection of partial volume averaging. In aged subjects, an extensive loss of myelinated nerve fibers [Marner et al., 2003; Meier‐Ruge et al., 1992] and the degenerative changes of myelin sheaths in the WM have been demonstrated [Peters, 2002; Peters and Rosene, 2003]. Neuronal loss in the GM, on the other hand, has been considered to be not substantial in normal aging [Morrison and Hof, 1997; Peters et al., 1998]. The loss or degeneration of myelinated fibers may decrease synaptic activity among neurons, and therefore, may be associated with a decrease in cortical glucose metabolism without any accompanying measurable GM changes using the VBM analysis of MR images.
In the present study, we did not find a statistically significant correlation between both GCC and SCC areas and other measures, except that the SCC areas had a statistically significant negative correlation with the 〈D〉 of the SCC, and showed a trend of positive correlation with the FA of the SCC. Considering that FA and 〈D〉 reflect changes in WM microstructures, it is not surprising that areas of the WM bundle and FA as well as 〈D〉 are correlated, and the subject with the lowest FA of the GCC in the present study had a more atrophic brain than the subject with the highest FA of the GCC (Fig. 3d). However, we did not find such correlation in the GCC, where we found correlation between FA as well as 〈D〉 and rMGlu. The degeneration in WM microstructures would be associated with atrophy of the macroscopic shapes WM fiber bundles; however, the association of micro‐ and macrostructural changes could be dissociated when the degeneration in fiber microstructures was not severe enough to cause visually apparent atrophy of WM structures.
There was statistically significant correlation of FA as well as 〈D〉 of the GCC with 〈D〉 of the FDWM, which indicated fiber degeneration in the FDWM as well as in the CC, but not with FA of the FDWM (Table I). The deep WM includes many fiber tracts other than those consist of CC, so that there should be many crossing fibers in the FDWM ROIs. FA depends strongly on the pre‐existing structures of WM, therefore, it will not necessarily reflect loss of fibers [Pierpaoli et al., 2001]. Nevertheless, we did not find statistically significant correlation between 〈D〉 as well as FA of the FDWM and frontal rMGlu, and association of the frontal rMGlu with WM microstructures were only significant in the GCC. The relationship between areas of WM structures and other quantitative measures of WM structures such as FA, 〈D〉, as well as quantitative fiber tracking methods [Xu et al., 2002], however, requires further research.
The association of cortical glucose metabolism with WM signal hyperintensity on T2WI has also been examined in some studies. However, results have been conflicting. Some studies have shown that subjects with WM hyperintensity have reduced global and frontal glucose metabolisms with extensive hyperintensity [DeCarli et al., 1995; Takahashi et al., 2000] or without a possible threshold effect on the extent of hyperintensity [Tullberg et al., 2004] Another study has shown a low glucose metabolism in the right dorsolateral prefrontal cortex in nondemented subjects with subcortical lacunar infarctions, but WM changes were not evaluated [Kwan et al., 1999]. Still, other studies did not show the association of WM hyperintensity with global and regional glucose metabolisms [Sabri et al., 1999] as well as with CBF [O'Sullivan et al., 2002; Sabri et al., 1999]. The subjects of this study had minor WM hyperintensities in the deep or periventricular WM region, because WM hyperintensities are common in the elderly that we could not recruit subjects without WM hyperintensities, although the subjects did not have subcortical lacunae. Considering the previous conflicting results on the association of WM hyperintensities with cortical glucose metabolisms with a possible threshold effect, the effect of WM hyperintensity on rMGlu should be, if any, negligible in this study.
In the present study, the subjects were in a resting state with their eyes closed and performing no specific tasks. Studies using functional MRI have demonstrated that CBF in several cortical and subcortical regions fluctuates synchronously during rest [Cordes et al., 2000, 2001; Lowe et al., 1998], suggesting that many functionally related regions in the brain are active during rest. Because the activities of cortical and subcortical regions are mediated via connecting fibers, the degeneration of connecting fibers would weaken such cortical and subcortical activities by compromising signal transduction among neurons in those regions. In a recent study using functional MRI, a decrease in interhemispheric functional connectivity has been reported during rest as well as during listening and finger‐tapping tasks in patients with corpus callosal agenesis [Quigley et al., 2003]. The associations of FA decline with age and scores in neuropsychological tests [O'Sullivan et al., 2001], and response time in a visual detection task [Madden et al., 2004] have also been reported. These suggest that the age‐related decline in cognitive ability accompanied with healthy aging could be partly due to a compromise in neural signaling via axonal fibers resulting from the loss of WM fibers. The present results may reflect differences among the healthy elderly in some kind of their cognitive activities that depend on interhemispheric signal transduction, although we could not control their cognitive activities in rest, and the present subjects were not cognitively deteriorated or depressed, assessed with their MMSE and GDS scores.
In this study, the method of ROI placement in the CC could have caused a limitation of the study. To prevent partial volume averaging with the surrounding tissues or CSF space, the ROI on the GCC was placed in the middle of the relatively dorsal part of the GCC and did not include the rostrum as well as the ventral part of the GCC, which constitute fibers connecting the basal and medial parts of the frontal cortex [Abe et al., 2004; Nieuwenhuys et al., 1988]. Okumura et al. [2005] reported a reduction in glucose metabolism in the medial frontal cortex as well as the FA in the CC in patients with diffuse axonal injury. This could be due to the ROI placement in which we did not find any statistically significant correlations of the FA of the GCC with rMGlu in the medial and basal parts of the frontal cortex. In addition, we did not measure FA as well as 〈D〉 in the regional GM, where we found correlations between the FA of the GCC and rMGlu, because we could not reliably measure them while avoiding partial volume averaging with CSF. We did not observe a statistically significant correlation of the FA of the GCC and regional GM concentration, however, the findings did not rule out possible changes in the microstructures in the corresponding regional GM. These possible limitations can be resolved by DTI acquisition at a higher spatial resolution as well as by using methods that could alleviate partial volume effects such as CSF suppression [Bhagat and Beaulieu, 2004]. The thinner, gapless, DTI acquisition that we were unable to apply in the present study would also have been useful for other methods of assessment of changes in WM microstructures, such as DTI fiber tracking [Xu et al., 2002].
In conclusion, the present results suggest that the deterioration of fiber microstructures in the CC would be associated with a decrease in cortical glucose metabolism without corresponding brain atrophy in healthy elderly subjects, although a larger sample of subjects and more comprehensive DTI protocols would be confirmatory. DTI, which provides information on tissue microstructures, may be used as an additional index for examining changes in tissue metabolism.
Acknowledgements
The authors thank the technical staffs of Cyclotron and Radioisotope Center, Tohoku University, for PET data acquisition.
REFERENCES
- Abe O, Aoki S, Hayashi N, Yamada H, Kunimatsu A, Mori H, Yoshikawa T, Okubo T, Ohtomo K ( 2002): Normal aging in the central nervous system: Quantitative MR diffusion‐tensor analysis. Neurobiol Aging 23: 433–441. [DOI] [PubMed] [Google Scholar]
- Abe O, Masutani Y, Aoki S, Yamasue H, Yamada H, Kasai K, Mori H, Hayashi N, Masumoto T, Ohtomo K ( 2004): Topography of the human corpus callosum using diffusion tensor tractography. J Comput Assist Tomogr 28: 533–539. [DOI] [PubMed] [Google Scholar]
- Aboitiz F, Scheibel AB, Fisher RS, Zaidel E ( 1992): Fiber composition of the human corpus callosum. Brain Res 598: 143–153. [DOI] [PubMed] [Google Scholar]
- Ashburner J, Friston K ( 1997): Multimodal image coregistration and partitioning—A unified framework. Neuroimage 6: 209–217. [DOI] [PubMed] [Google Scholar]
- Ashburner J, Friston KJ ( 1999): Nonlinear spatial normalization using basis functions. Hum Brain Mapp 7: 254–266. [DOI] [PMC free article] [PubMed] [Google Scholar]
- Ashburner J, Friston KJ ( 2000): Voxel‐based morphometry—The methods. Neuroimage 11(6, Part 1): 805–821. [DOI] [PubMed] [Google Scholar]
- Basser PJ ( 1995): Inferring microstructural features and the physiological state of tissues from diffusion‐weighted images. NMR Biomed 8: 333–344. [DOI] [PubMed] [Google Scholar]
- Basser PJ, Pierpaoli C ( 1996): Microstructural and physiological features of tissues elucidated by quantitative‐diffusion‐tensor MRI. J Magn Reson B 111: 209–219. [DOI] [PubMed] [Google Scholar]
- Basser PJ, Pierpaoli C ( 1998): A simplified method to measure the diffusion tensor from seven MR images. Magn Reson Med 39: 928–934. [DOI] [PubMed] [Google Scholar]
- Basser PJ, Mattiello J, LeBihan D ( 1994a): Estimation of the effective self‐diffusion tensor from the NMR spin echo. J Magn Reson B 103: 247–254. [DOI] [PubMed] [Google Scholar]
- Basser PJ, Mattiello J, LeBihan D ( 1994b): MR diffusion tensor spectroscopy and imaging. Biophys J 66: 259–267. [DOI] [PMC free article] [PubMed] [Google Scholar]
- Benedetti B, Charil A, Rovaris M, Judica E, Valsasina P, Sormani MP, Filippi M ( 2006): Influence of aging on brain gray and white matter changes assessed by conventional, MT, and DT MRI. Neurology 66: 535–539. [DOI] [PubMed] [Google Scholar]
- Bhagat YA, Beaulieu C ( 2004): Diffusion anisotropy in subcortical white matter and cortical gray matter: Changes with aging and the role of CSF‐suppression. J Magn Reson Imaging 20: 216–227. [DOI] [PubMed] [Google Scholar]
- Cordes D, Haughton VM, Arfanakis K, Wendt GJ, Turski PA, Moritz CH, Quigley MA, Meyerand ME ( 2000): Mapping functionally related regions of brain with functional connectivity MR imaging. AJNR Am J Neuroradiol 21: 1636–1644. [PMC free article] [PubMed] [Google Scholar]
- Cordes D, Haughton VM, Arfanakis K, Carew JD, Turski PA, Moritz CH, Quigley MA, Meyerand ME ( 2001): Frequencies contributing to functional connectivity in the cerebral cortex in “resting‐state” data. AJNR Am J Neuroradiol 22: 1326–1333. [PMC free article] [PubMed] [Google Scholar]
- Courchesne E, Chisum HJ, Townsend J, Cowles A, Covington J, Egaas B, Harwood M, Hinds S, Press GA ( 2000): Normal brain development and aging: Quantitative analysis at in vivo MR imaging in healthy volunteers. Radiology 216: 672–682. [DOI] [PubMed] [Google Scholar]
- Creasey H, Rapoport SI ( 1985): The aging human brain. Ann Neurol 17: 2–10. [DOI] [PubMed] [Google Scholar]
- DeCarli C, Murphy DG, Tranh M, Grady CL, Haxby JV, Gillette JA, Salerno JA, Gonzales‐Aviles A, Horwitz B, Rapoport SI, Schapiro MB( 1995): The effect of white matter hyperintensity volume on brain structure, cognitive performance, and cerebral metabolism of glucose in 51 healthy adults. Neurology 45: 2077–2084. [DOI] [PubMed] [Google Scholar]
- Fazekas F, Chawluk JB, Alavi A, Hurtig HI, Zimmerman RA ( 1987): MR signal abnormalities at 1.5 T in Alzheimer's dementia and normal aging. AJR Am J Roentgenol 149: 351–356. [DOI] [PubMed] [Google Scholar]
- Folstein MF, Folstein SE, McHugh PR ( 1975): “Mini‐mental state”. A practical method for grading the cognitive state of patients for the clinician. J Psychiatr Res 12: 189–198. [DOI] [PubMed] [Google Scholar]
- Fujiwara T, Watanuki S, Yamamoto S, Miyake M, Seo S, Itoh M, Ishii K, Orihara H, Fukuda H, Satoh T, Kitamura K, Tanaka K, Takahashi S ( 1997): Performance evaluation of a large axial field‐of‐view PET scanner: SET‐2400W. Ann Nucl Med 11: 307–313. [DOI] [PubMed] [Google Scholar]
- Genovese CR, Lazar NA, Nichols T ( 2002): Thresholding of statistical maps in functional neuroimaging using the false discovery rate. Neuroimage 15: 870–878. [DOI] [PubMed] [Google Scholar]
- Giovacchini G, Lerner A, Toczek MT, Fraser C, Ma K, DeMar JC, Herscovitch P, Eckelman WC, Rapoport SI, Carson RE ( 2004): Brain incorporation of 11C‐arachidonic acid, blood volume, and blood flow in healthy aging: A study with partial‐volume correction. J Nucl Med 45: 1471–1479. [PubMed] [Google Scholar]
- Good CD, Johnsrude IS, Ashburner J, Henson RN, Friston KJ, Frackowiak RSJ ( 2001): A voxel‐based morphometric study of ageing in 465 normal adult human brains. Neuroimage 14(1, Part 1): 21–36. [DOI] [PubMed] [Google Scholar]
- Guttmann C, Jolesz F, Kikinis R, Killiany R, Moss M, Sandor T, Albert M ( 1998): White matter changes with normal aging. Neurology 50: 972–978. [DOI] [PubMed] [Google Scholar]
- Hanyu H, Asano T, Sakurai H, Imon Y, Iwamoto T, Takasaki M, Shindo H, Abe K ( 1999): Diffusion‐weighted and magnetization transfer imaging of the corpus callosum in Alzheimer's disease. J Neurol Sci 167: 37–44. [DOI] [PubMed] [Google Scholar]
- Head D, Buckner RL, Shimony JS, Williams LE, Akbudak E, Conturo TE, McAvoy M, Morris JC, Snyder AZ ( 2004): Differential vulnerability of anterior white matter in nondemented aging with minimal acceleration in dementia of the Alzheimer type: Evidence from diffusion tensor imaging. Cereb Cortex 14: 410–423. [DOI] [PubMed] [Google Scholar]
- Ibanez V, Pietrini P, Alexander GE, Furey ML, Teichberg D, Rajapakse JC, Rapoport SI, Schapiro MB, Horwitz B ( 1998): Regional glucose metabolic abnormalities are not the result of atrophy in Alzheimer's disease. Neurology 50: 1585–1593. [DOI] [PubMed] [Google Scholar]
- Ibanez V, Pietrini P, Furey ML, Alexander GE, Millet P, Bokde AL, Teichberg D, Schapiro MB, Horwitz B, Rapoport SI ( 2004): Resting state brain glucose metabolism is not reduced in normotensive healthy men during aging, after correction for brain atrophy. Brain Res Bull 63: 147–154. [DOI] [PubMed] [Google Scholar]
- Kwan LT, Reed BR, Eberling JL, Schuff N, Tanabe J, Norman D, Weiner MW, Jagust WJ ( 1999): Effects of subcortical cerebral infarction on cortical glucose metabolism and cognitive function. Arch Neurol 56: 809–814. [DOI] [PMC free article] [PubMed] [Google Scholar]
- Le Bihan D ( 2003): Looking into the functional architecture of the brain with diffusion MRI. Nat Rev Neurosci 4: 469–480. [DOI] [PubMed] [Google Scholar]
- Lowe MJ, Mock BJ, Sorenson JA ( 1998): Functional connectivity in single and multislice echoplanar imaging using resting‐state fluctuations. Neuroimage 7: 119–132. [DOI] [PubMed] [Google Scholar]
- Madden DJ, Whiting WL, Huettel SA, White LE, MacFall JR, Provenzale JM ( 2004): Diffusion tensor imaging of adult age differences in cerebral white matter: Relation to response time. Neuroimage 21: 1174–1181. [DOI] [PubMed] [Google Scholar]
- Magistretti PJ ( 2000): Cellular bases of functional brain imaging: Insights from neuron‐glia metabolic coupling. Brain Res 886: 108–112. [DOI] [PubMed] [Google Scholar]
- Maldjian JA, Laurienti PJ, Kraft RA, Burdette JH ( 2003): An automated method for neuroanatomic and cytoarchitectonic atlas‐based interrogation of fMRI data sets. Neuroimage 19: 1233–1239. [DOI] [PubMed] [Google Scholar]
- Marner L, Nyengaard JR, Tang Y, Pakkenberg B ( 2003): Marked loss of myelinated nerve fibers in the human brain with age. J Comp Neurol 462: 144–152. [DOI] [PubMed] [Google Scholar]
- Meier‐Ruge W, Ulrich J, Bruhlmann M, Meier E ( 1992): Age‐related white matter atrophy in the human brain. Ann NY Acad Sci 673: 260–269. [DOI] [PubMed] [Google Scholar]
- Meltzer CC, Cantwell MN, Greer PJ, Ben‐Eliezer D, Smith G, Frank G, Kaye WH, Houck PR, Price JC ( 2000): Does cerebral blood flow decline in healthy aging? A PET study with partial‐volume correction. J Nucl Med 41: 1842–1848. [PubMed] [Google Scholar]
- Moeller JR, Ishikawa T, Dhawan V, Spetsieris P, Mandel F, Alexander GE, Grady C, Pietrini P, Eidelberg D ( 1996): The metabolic topography of normal aging. J Cereb Blood Flow Metab 16: 385–398. [DOI] [PubMed] [Google Scholar]
- Morrison JH, Hof PR ( 1997): Life and death of neurons in the aging brain. Science 278: 412–419. [DOI] [PubMed] [Google Scholar]
- Nieuwenhuys R, Voogd J, van Huijzen C ( 1988): The Human Central Nervous System—A Synopsis and Atlas. Berlin: Springer‐Verlag. [Google Scholar]
- Okumura A, Yasokawa Y, Nakayama N, Miwa K, Shinoda J, Iwama T ( 2005): [The clinical utility of MR diffusion tensor imaging and spatially normalized PET to evaluate traumatic brain injury patients with memory and cognitive impairments]. No To Shinkei 57: 115–122. [PubMed] [Google Scholar]
- O'Sullivan M, Jones DK, Summers PE, Morris RG, Williams SC, Markus HS ( 2001): Evidence for cortical “disconnection” as a mechanism of age‐related cognitive decline. Neurology 57: 632–638. [DOI] [PubMed] [Google Scholar]
- O'Sullivan M, Lythgoe DJ, Pereira AC, Summers PE, Jarosz JM, Williams SC, Markus HS ( 2002): Patterns of cerebral blood flow reduction in patients with ischemic leukoaraiosis. Neurology 59: 321–326. [DOI] [PubMed] [Google Scholar]
- Peters A ( 2002): The effects of normal aging on myelin and nerve fibers: A review. J Neurocytol 31: 581–593. [DOI] [PubMed] [Google Scholar]
- Peters A, Rosene DL ( 2003): In aging, is it gray or white? J Comp Neurol 462: 139–143. [DOI] [PubMed] [Google Scholar]
- Peters A, Morrison JH, Rosene DL, Hyman BT ( 1998): Feature article: Are neurons lost from the primate cerebral cortex during normal aging? Cereb Cortex 8: 295–300. [DOI] [PubMed] [Google Scholar]
- Petit‐Taboue MC, Landeau B, Desson JF, Desgranges B, Baron JC ( 1998): Effects of healthy aging on the regional cerebral metabolic rate of glucose assessed with statistical parametric mapping. Neuroimage 7: 176–184. [DOI] [PubMed] [Google Scholar]
- Pfefferbaum A, Sullivan EV ( 2003): Increased brain white matter diffusivity in normal adult aging: Relationship to anisotropy and partial voluming. Magn Reson Med 49: 953–961. [DOI] [PubMed] [Google Scholar]
- Pfefferbaum A, Mathalon DH, Sullivan EV, Rawles JM, Zipursky RB, Lim KO ( 1994): A quantitative magnetic resonance imaging study of changes in brain morphology from infancy to late adulthood. Arch Neurol 51: 874–887. [DOI] [PubMed] [Google Scholar]
- Pfefferbaum A, Sullivan EV, Hedehus M, Lim KO, Adalsteinsson E, Moseley M ( 2000): Age‐related decline in brain white matter anisotropy measured with spatially corrected echo‐planar diffusion tensor imaging. Magn Reson Med 44: 259–268. [DOI] [PubMed] [Google Scholar]
- Pierpaoli C, Basser PJ ( 1996): Toward a quantitative assessment of diffusion anisotropy. Magn Reson Med 36: 893–906. [DOI] [PubMed] [Google Scholar]
- Pierpaoli C, Barnett A, Pajevic S, Chen R, Penix LR, Virta A, Basser P ( 2001): Water diffusion changes in Wallerian degeneration and their dependence on white matter architecture. Neuroimage 13(6, Part 1): 1174–1185. [DOI] [PubMed] [Google Scholar]
- Quigley M, Cordes D, Turski P, Moritz C, Haughton V, Seth R, Meyerand ME ( 2003): Role of the corpus callosum in functional connectivity. AJNR Am J Neuroradiol 24: 208–212. [PMC free article] [PubMed] [Google Scholar]
- Raz N, Gunning FM, Head D, Dupuis JH, McQuain J, Briggs SD, Loken WJ, Thornton AE, Acker JD ( 1997): Selective aging of the human cerebral cortex observed in vivo: Differential vulnerability of the prefrontal gray matter. Cereb Cortex 7: 268–282. [DOI] [PubMed] [Google Scholar]
- Resnick SM, Pham DL, Kraut MA, Zonderman AB, Davatzikos C ( 2003): Longitudinal magnetic resonance imaging studies of older adults: A shrinking brain. J Neurosci 23: 3295–3301. [DOI] [PMC free article] [PubMed] [Google Scholar]
- Rorden C, Brett M ( 2000): Stereotaxic display of brain lesions. Behav Neurol 12: 191–200. [DOI] [PubMed] [Google Scholar]
- Rovaris M, Iannucci G, Cercignani M, Sormani MP, De Stefano N, Gerevini S, Comi G, Filippi M ( 2003): Age‐related changes in conventional, magnetization transfer, and diffusion‐tensor MR imaging findings: Study with whole‐brain tissue histogram analysis. Radiology 227: 731–738. [DOI] [PubMed] [Google Scholar]
- Sabri O, Ringelstein EB, Hellwig D, Schneider R, Schreckenberger M, Kaiser HJ, Mull M, Buell U ( 1999): Neuropsychological impairment correlates with hypoperfusion and hypometabolism but not with severity of white matter lesions on MRI in patients with cerebral microangiopathy. Stroke 30: 556–566. [DOI] [PubMed] [Google Scholar]
- Salerno JA, Grady C, Mentis M, Gonzalez‐Aviles A, Wagner E, Schapiro MB, Rapoport SI ( 1995): Brain metabolic function in older men with chronic essential hypertension. J Gerontol A Biol Sci Med Sci 50: M147—154. [DOI] [PubMed] [Google Scholar]
- Shulman RG, Rothman DL, Behar KL, Hyder F ( 2004): Energetic basis of brain activity: Implications for neuroimaging. Trends Neurosci 27: 489–495. [DOI] [PubMed] [Google Scholar]
- Smith SM, Zhang Y, Jenkinson M, Chen J, Matthews PM, Federico A, De Stefano N ( 2002): Accurate, robust, and automated longitudinal and cross‐sectional brain change analysis. Neuroimage 17: 479–489. [DOI] [PubMed] [Google Scholar]
- Takahashi W, Takagi S, Ide M, Shohtsu A, Shinohara Y ( 2000): Reduced cerebral glucose metabolism in subjects with incidental hyperintensities on magnetic resonance imaging. J Neurol Sci 176: 21–27. [DOI] [PubMed] [Google Scholar]
- Taki Y, Goto R, Evans A, Zijdenbos A, Neelin P, Lerch J, Sato K, Ono S, Kinomura S, Nakagawa M, Sugiura M, Watanabe J, Kawashima R, Fukuda H ( 2004): Voxel‐based morphometry of human brain with age and cerebrovascular risk factors. Neurobiol Aging 25: 455–463. [DOI] [PubMed] [Google Scholar]
- Teipel SJ, Hampel H, Pietrini P, Alexander GE, Horwitz B, Daley E, Moller HJ, Schapiro MB, Rapoport SI ( 1999): Region‐specific corpus callosum atrophy correlates with the regional pattern of cortical glucose metabolism in Alzheimer disease. Arch Neurol 56: 467–473. [DOI] [PubMed] [Google Scholar]
- Tullberg M, Fletcher E, DeCarli C, Mungas D, Reed BR, Harvey DJ, Weiner MW, Chui HC, Jagust WJ ( 2004): White matter lesions impair frontal lobe function regardless of their location. Neurology 63: 246–253. [DOI] [PMC free article] [PubMed] [Google Scholar]
- Willis MW, Ketter TA, Kimbrell TA, George MS, Herscovitch P, Danielson AL, Benson BE, Post RM ( 2002): Age, sex and laterality effects on cerebral glucose metabolism in healthy adults. Psychiatry Res 114: 23–37. [DOI] [PubMed] [Google Scholar]
- Xu D, Mori S, Solaiyappan M, van Zijl PC, Davatzikos C ( 2002): A framework for callosal fiber distribution analysis. Neuroimage 17: 1131–1143. [DOI] [PubMed] [Google Scholar]
- Yanase D, Matsunari I, Yajima K, Chen W, Fujikawa A, Nishimura S, Matsuda H, Yamada M ( 2005): Brain FDG PET study of normal aging in Japanese: Effect of atrophy correction. Eur J Nucl Med Mol Imaging 32: 794–805. [DOI] [PubMed] [Google Scholar]
- Yesavage JA, Brink TL, Rose TL, Lum O, Huang V, Adey M, Leirer VO ( 1982): Development and validation of a geriatric depression screening scale: A preliminary report. J Psychiatr Res 17: 37–49. [DOI] [PubMed] [Google Scholar]