

Abstract
FMRI research in Alzheimer's disease (AD) and mild cognitive impairment (MCI) typically is aimed at determining regional changes in brain function, most commonly by creating a model of the expected BOLD‐response and estimating its magnitude using a general linear model (GLM) analysis. This crucially depends on the suitability of the temporal assumptions of the model and on assumptions about normality of group distributions. Exploratory data analysis techniques such as independent component analysis (ICA) do not depend on these assumptions and are able to detect unknown, yet structured spatiotemporal processes in neuroimaging data. Tensorial probabilistic ICA (T‐PICA) is a model free technique that can be used for analyzing multiple subjects and groups, extracting signals of interest (components) in the spatial, temporal, and also subject domain of FMRI data. We applied T‐PICA and model‐based GLM to study FMRI signal during face encoding in 18 AD, 28 MCI patients, and 41 healthy elderly controls. T‐PICA showed activation in regions associated with motor, visual, and cognitive processing, and deactivation in the default mode network. Six networks showed a significantly decreased response in patients. For two networks the T‐PICA technique was significantly more sensitive to detect group differences than the standard model‐based technique. We conclude that T‐PICA is a promising tool to identify and detect differences in (de)activated brain networks in elderly controls and dementia patients. The technique is more sensitive than the commonly applied model‐based method. Consistent with other research, we show that networks of activation and deactivation show decreased reactivity in dementia. Hum Brain Mapp 2009. © 2007 Wiley‐Liss, Inc.
Keywords: FMRI, Alzheimer's disease, default mode network, connectivity
INTRODUCTION
FMRI research in Alzheimer's disease (AD) and mild cognitive impairment (MCI) typically is aimed at determining regional changes in brain function linked to disease state or progression. The most common method of analyzing data from a standard FMRI activation experiment is to create a model of the expected BOLD response [using an a‐priori model of the haemodynamic response function (HRF)] and estimate the magnitude of the response using methods of parameter fitting within the framework of the generalized linear model (GLM). Such methods have successfully been used to detect regionally altered brain activation in AD and MCI [see for example Dickerson et al., 2004; Golby et al., 2005; Lustig et al., 2003; Rombouts et al., 2005b], and brain activation changes after pharmacologic treatment in dementia [Goekoop et al., 2004; Rombouts et al., 2002; Saykin et al., 2004]. Model‐based analysis approaches, however, rely heavily on assumptions about the temporal characteristics of haemodynamic signals and are limited to cases where these underlying assumptions well characterize the effects of interest.
Not assuming such simple temporal response models can have important applications particularly in studies of aging and disease: the measured BOLD response within such populations does not necessarily correspond to the standard HRF [D'Esposito et al., 1999, 2003; Rombouts et al., 2005b] where the temporal signal variation may differ substantially between groups. Furthermore, the response shape and the residual variance may change from region to region [Buckner et al., 2000; D'Esposito et al., 1999]. The ability to accurately detect relevant activation patterns in an FMRI multisubject analysis crucially depends on the suitability of the explicit temporal assumptions at the individual subject level as well as the suitability of distributional assumptions (e.g., normally distributed subjects' responses within and between the groups).
As an alternative to model‐based techniques, exploratory data analysis techniques such as principal component analysis (PCA) or independent component analysis (ICA) are becoming increasingly popular for the analysis of BOLD FMRI. These techniques decompose two‐dimensional data matrices (where the original four‐dimensional FMRI data set is represented as a time × voxels matrix) into a set of time courses and associated spatial maps, which jointly describe the temporal and spatial characteristics of underlying signals (components). An advantage of such an approach is the ability to detect unknown, yet structured spatiotemporal processes in neuroimaging data [Beckmann and Smith, 2004; McKeown et al, 1998]. The additional modeling flexibility may result in an increased sensitivity toward the detection of signals of interest, e.g., Greicius et al. successfully applied an ICA‐based analysis to compare FMRI data of demented patients and healthy elderly in an a priori defined network of interest [Greicius and Menon, 2004]. Celone et al. used group ICA by concatenating subjects' data [Calhoun et al., 2001] to study FMRI activation in AD, MCI, and healthy elderly [Celone et al., 2006]. Most applications of model‐free methods to FMRI data analysis, however, have until recently been limited to the analysis of single sessions as it has not been clear how to generalize model‐free approaches to the investigations of multiple subjects/multiple groups.
Recently, a method for accurate and efficient extraction of signals of interest in spatial, temporal, and also the subject domain, termed tensorial probabilistic‐ICA (T‐PICA), was introduced as a method for the analysis of FMRI group data [Beckmann and Smith, 2005]. This approach has been demonstrated to extract plausible activation maps, time courses and estimates of the signal variation across the population. Furthermore, it provides a richer description of the data than model‐based techniques, showing additional processes of interest such as secondary activation patterns. Hence, this technique might aid the interpretation of FMRI studies beyond what can be achieved using model‐based analysis techniques.
Here, we applied T‐PICA to further analyze data that we reported on previously [Rombouts et al., 2005a, b, 2007]. AD and MCI patients and healthy elderly controls were presented faces alternated with a fixation cross in a block design (face encoding). Our aim was to study whether (1) the T‐PICA technique shows spatial activation maps comparable to previous model‐based analyses; (2) this technique shows significant group differences between dementia and controls in any spatiotemporal mode; (3) T‐PICA is more sensitive to detect group differences than the model‐based approach.
METHODS
Subjects, FMRI task, and FMRI data were the same as in previous studies of our group [Rombouts et al., 2005a, b, 2007].
Subject Recruitment
Patients were recruited at the Alzheimer Center of the VU University Medical Center, Amsterdam, The Netherlands. Mild cognitive impairment (MCI) patients were diagnosed using criteria for amnestic MCI [Petersen et al., 2001], with mini mental state examination (MMSE) scores > 25 [Folstein et al., 1975], and clinical dementia rating (CDR) scale scores of 0.5 [Morris, 1993]. Twenty‐eight MCI patients were included (age 74.0 ± 7.5 years, range 54–84 years; MMSE 26.9 ± 1.2; 8 male, 20 female; average education 2.2 ± 0.6 on a discrete scale with 3 levels: low = 1, middle = 2, high = 3; three patients were left‐handed). Alzheimer's disease (AD) patients were diagnosed using NINCDS‐ADRDA criteria [McKhann et al., 1984], with MMSE scores > 18 and CDR < 2. These values correspond to what is known as mild AD. Eighteen AD patients were included (age 74.1 ± 8.0 years, range 55–83 years; MMSE 22.5 ± 2.2; 11 male, 7 female, education 1.7 ± 0.6; one patient was left‐handed). Forty‐one healthy controls (age 63.1 ± 5.2 years, range 50–75 years; MMSE 29.0 ± 0.9; 28 male, 13 female, education 2.1 ± 0.7; two were left‐handed) were also included. Controls were significantly younger than AD (F(1,57) = 39.82, P = 0.0004), and MCI patients (F(1,65) = 51.41, P = 0.001), but MCI and AD did not differ in age (F(1,44) = 0.072, P = 0.79). Gender ratio was different between controls and MCI patients (χ2 = 9.0, df = 1, P = 0.003) and between MCI and AD patients (χ2 = 4.0, df = 1, P = 0.04), but not between controls and AD (χ2 = 0.29, df = 1, P = 0.59). Both gender and age were included as covariates of no interest in the FMRI analysis (see later).
The experiment was approved by the Medical Ethics Committee of the VU University Medical Center Amsterdam. All subjects provided informed consent, patients under supervision of a lawful caregiver if necessary. Subjects were excluded if they had any significant medical, neurological, or psychiatric illness, or if they were taking medication or other substances known to influence cerebral function. In this study, only patients were included whose diagnosis had remained unaltered during a 6‐month follow up.
MR Acquisition
Imaging was carried out on a 1.5 T Sonata MR scanner (Siemens, Erlangen, Germany) at the VU University medical center, using a standard circularly polarized head coil with foam padding to restrict head motion. For FMRI, an echo planar imaging sequence was used (fat suppression on, echo time 60 ms, flip angle 90°, reconstruction matrix 64 × 64, field of view 192 × 192 mm, repetition time (TR) 2100 ms), to obtain 21 transverse slices (5 mm thickness, 1 mm interslice gap). Using a stimulus computer, task stimuli were projected on a screen at the head end of the scanner table via an LCD projector located outside the scanner room and viewed through a mirror on the head coil. In each hand subjects held a response‐box to react by pressing a button using their index‐fingers. A structural MRI‐scan was also acquired (MPRAGE; inversion time: 300 ms, TR = 15 ms; TE = 7 ms; flip angle = 8°; 160 coronal slices, 1 × 1 × 1.5 mm3 voxels).
Memory Paradigm
An FMRI face encoding task was used to assess episodic memory [Small et al., 1999]. The paradigm was practiced extensively: the first practice was one day before scanning at home, the second just before scanning, and the third in the MR scanner. During the first 10.5 s subjects saw a circle indicating time left before the onset of the first condition. Two conditions alternated in a block design: face encoding and fixation. In a 42 s encoding block 6 unfamiliar faces were presented sequentially (6 s each, followed by a 1 s delay). Subjects were instructed to classify gender by pressing one of two buttons (left: male, right: female; instructions below each face) and to memorize faces. Male and female faces were balanced across encoding blocks. Four encoding blocks alternated with four fixation blocks, presenting a fixation cross for 44 s. The paradigm started with a 21 s fixation period. In total, 175 whole brain FMRI scans were acquired during the encoding paradigm. The stimulus computer triggered the scanner at the start and the end of the sequence to make sure that the stimulus computer and scanner were synchronized. Reaction times and gender discrimination accuracy‐scores were recorded. Reaction times were defined as time of stimulus display to button press. Performance accuracy score varying from 1 to 1 (with 0 indicating chance level) was calculated by subtracting false answers from correct answers and dividing the result by the total number of items (24). Mean accuracy scores for gender‐discrimination were 0.96 (SD 0.02) in controls, 0.96 (SD 0.02) in MCI and 0.87 (SD 0.03) in AD. AD accuracy scores differed significantly from controls (F(1,57) = 14.7, P = 0.0003) and MCI patients (F(1,44) = 5.27, P = 0.027). Mean reaction times were 1.13 s (SD 0.08 s) in controls, 1.39 s (SD 0.08 s) in MCI, and 1.50 s (SD 0.10 s) in AD patients. AD patients had significantly slower reaction times than controls (F(1,57) = 10.0, df = 1, P = 0.003). Other pair‐wise comparisons were not significant. Total paradigm duration was 6 min and 12 s.
To determine encoding success, all subjects were presented old and new faces 5 min after the encoding phase [Rombouts et al., 2005a, b]. Mean accuracy scores (0 is chance level, 1 means no errors) during face recognition after the encoding paradigm were 0.71 (SD 0.054) in controls, 0.36 (SD 0.051) in MCI and 0.15 (SD 0.061) in AD patients. Accuracy scores in each patient group differed significantly from the other two groups (F(2,84) = 76.1, P < 0.0001). Mean reaction times were 1.72 s (SD 0.12 s) in controls, 2.41 s (SD 0.11 s) in MCI and 2.23 s (SD 0.14 s) in AD patients. These were different between controls and MCI (F(1,67) = 55.4, P = 0.0003), controls and AD (F(1,57) = 15.6, P = 0.0002), but not between MCI and AD patients (F(1,44) = 1.87, P = 0.18).
MR Data Analysis
Preprocessing
Model‐based FMRI analysis was carried out using FEAT (FMRI Expert Analysis Tool) Version 5.1, part of FSL (FMRIB's Software Library, http://www.FMRIB.ox.ac.uk/fsl [Smith et al., 2004]). Prestatistical processing, common to both the model‐free and model‐based statistical analysis, consisted of motion correction [Jenkinson et al., 2002], removal of nonbrain structures from the data [Smith, 2002b], spatial smoothing using a Gaussian kernel (6 mm FWHM), mean‐based intensity normalization of all volumes by the same factor and highpass temporal filtering (Gaussian‐weighted least‐squares straight line fitting, with sigma = 60.0 s). FMRI images were registered to the individual's structural scan, which itself was registered to the MNI152 standard space template image [Jenkinson and Smith, 2001; Jenkinson et al., 2002]. Next, all individuals' 4‐D FMRI images were transformed to standard space (using the previously computed transform), while keeping the data at the original resolution to reduce computational demand.
Model‐free analysis
The preprocessed FMRI data of all 86 subjects (one subject was excluded due to corrupt data) were decomposed into space/time/subject component matrices which characterize the structured signals in the spatial, temporal, and the subject domains using T‐PICA as described by Beckmann and Smith [2005]. This results in a trilinear factorization such that
| (1) |
Here, x ijk denotes the data of subject k at voxel location j and time point i. The matrices A = [a ir], B = [b ir] and C = [c ir] each contain R one‐dimensional vectors that, for each estimated process r, characterize the signal in the temporal, spatial and subject domain, respectively, the matrix A contains a single time course per component describing the temporal evolution of effect, the corresponding matrix B shows the associated spatial distribution of the effect and the matrix C contains information about the relative amplitude of the spatiotemporal process in each one of the subjects. The information in the columns of the matrix C therefore can be used to identify signals which are consistent within and/or inconsistent between groups as well as processes which have no expression across the population and only exist in a single or few subjects (such as components induced by particularly strong residual head motion). In the T‐PICA approach, these matrices are optimized to find least‐squares estimates for the generative model of equation (1) such that the spatial maps (column vectors of the factor matrix B) are maximally non‐Gaussian. Data were decomposed into 39 components, where the model order (i.e., number of underlying signals) was estimated using the Laplace approximation to the Bayesian evidence for a probabilistic PCA model [Beckmann and Smith, 2004]. Such an approach is important in order to model sufficiently components to adequately model underlying signals while avoiding overfitting/oversplitting. Final maps were thresholded using an alternative hypothesis test based on fitting a Gaussian/Gamma mixture model to the distribution of voxel intensities within spatial maps and a posterior probability threshold of P > 0.5 [Beckmann et al., 2003]. To characterise components which differ significantly between the different subpopulations (controls, MCI and AD) the 86 values in the subject domain (column vectors of the matrix C) were compared within the general linear model (GLM) framework by performing t tests on the values between groups, also including age and gender as additional covariates of no interest. This analysis was done on a selection of components, based on the spatial and temporal and subject‐domain pattern of each component. The spatial pattern had to contain regions of grey matter, being located in physiologically meaningful regions while the temporal pattern had to correlate with the on/off task. In addition, the subject mode was required to be significantly nonzero for all subjects so that the associated process was not due to single‐subject outliers.
Comparison of model‐free‐ and model‐based analysis
Spatiotemporal maps that were significantly different between groups (P < 0.05) were analyzed further to compare the sensitivity of the T‐PICA technique with the commonly applied model‐based approach, as reported previously for the current data set [Rombouts et al., 2005a, b]. In those studies, the same data were analyzed using a general linear model (GLM), resulting in parameter estimates (PEs) for each voxel in each subject. Within the GLM, PEs were obtained for the on/off function convolved with a double gamma HRF and also for its temporal derivative to model early/late BOLD responses. Both these PEs were averaged across voxels for each thresholded spatial network detected with the current model‐free approach, to get two PEs (one for the on/off function and one for its temporal derivative) for each subject. These averaged PEs were analyzed to study group differences in the same way as the model free analysis using a t test with age and gender as additional covariates. To compare group differences between the model‐free and the model‐based analyses, we also analyzed group × model interactions, using the values in the subject domain of the T‐PICA analysis, and averaged PEs of the model based analysis.
RESULTS
Model‐Free Analysis
Each set of components contained an estimate of an underlying process (modes) in the spatial, temporal, and subject domain (Fig. 1 and 2). Among these were components with spatial modes of CSF signal and components with spatial modes of white matter signal, though none of these maps were significantly different between patients and controls.
Figure 1.
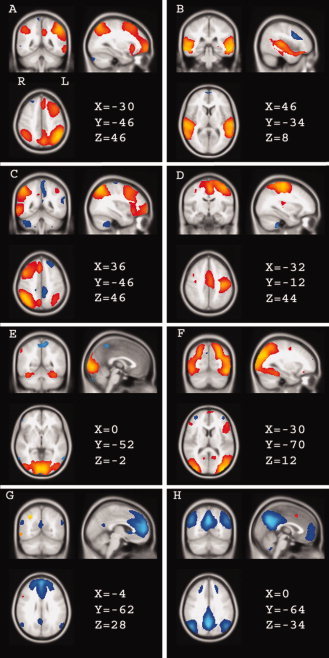
Selection of spatial modes of grey matter, resulting from the model‐free analysis in all 86 subjects together. The displayed (thresholded) voxel values are from the vectors of matrix B in formula (1): for each component, the vectors represent the voxel values. Spatial mode A contains mainly left middle and superior frontal regions and parietal regions. (B) contains the auditory system; (C) includes the right frontal and parietal regions (complementary to A), and also the thalamus, insula, caudate nucleus, and hippocampus (most of these included regions are not displayed in the figure; (D) contains the left motor cortex and thalamus; (E) contains medial visual regions and caudate nucleus, putamen, and hippocampus; (F) includes lateral visual regions; (G,H) include medial frontal regions, anterior and posterior cingulum, bilateral parietal cortex, parahippocampal gyrus bilateral, precuneus. (G) contains mainly anterior regions, (H) mainly posterior regions. (A,B) show no significant difference between patients and controls, (C–H) show a significantly diminished BOLD response in patients (see figure 2). Red–yellow: activation positively correlated with the paradigm. Blue: signal negatively correlated with the paradigm (“deactivation”). Colors are scaled ranging from minimum to maximum separately in each mode. The coordinates refer to millimeter distance from the anterior commissure in MNI space and images are shown in radiological convention (left in image is right in brain).
Figure 2.
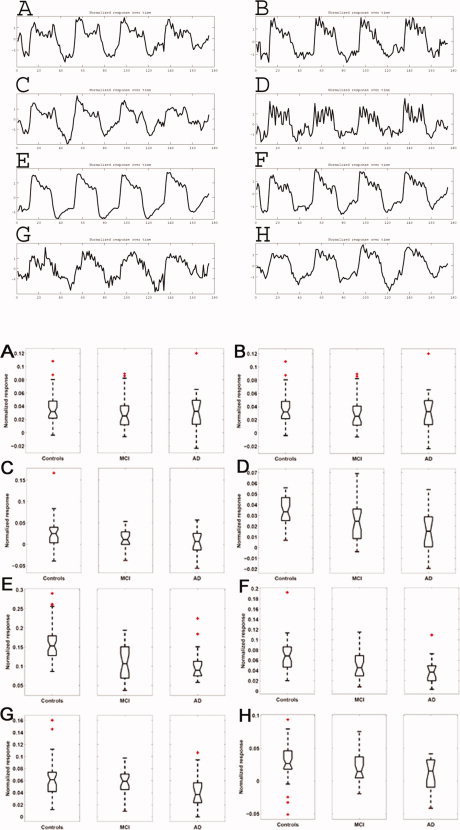
Time courses (time domain, top) and boxplots of values in the subject domain (bottom) corresponding to the eight spatial modes shown in Figure 1. The time courses are the values of the vectors of matrix A in formula (1), the subject domain numbers are the values of the vectors in matrix C. In the subject domain, the boxplots show the distribution of regression values for each group separately to illustrate the group differences of spatial networks C–H. There were no group differences for the spatial networks A and B. [Color figure can be viewed in the online issue, which is available at www.interscience.wiley.com.]
The majority of spatial modes identified networks of grey matter. Most of these networks showed significant positive or negative correlation with the paradigm, as judged in the temporal domain. Note that the decomposition itself (Eq. 1) is invariant under inversion of 2 of the three modes, that is, determining positive or negative response amplitude is only possible when fixing the sign of two of the modes. In the present study, we orient the components in such a way as to ensure positive median response across subjects and time courses to have positive crosscorrelation with the known event timings (see Fig. 2). The extent to which those networks were present in individuals (that is, the extent to which a subject showed a response in the network) could subsequently be compared between patients and controls (Fig. 2). One component spatially identified a network of mainly left middle and superior frontal and parietal regions (Fig. 1A and 2A); another component identified a network consisting of the auditory system (Fig. 1B and 2B). These networks were not different between patients and controls.
However, the network consisting of the right frontal and parietal regions, which is the complementary pattern of Figure 1A, was significantly diminished in MCI (P = 0.03) and AD (P = 0.03) patients compared with controls (see Fig. 1C, 2C, and Table I). This network also included the thalamus, insula, caudate nucleus, and the hippocampus.
Table I.
Group differences
|
Network (Fig. 1) |
Model free | Model based PE of on/off function | Model based PE of TD | ||||||
|---|---|---|---|---|---|---|---|---|---|
| CTR > PAT | CTR > MCI | CTR > AD | CTR > PAT | CTR > MCI | CTR > AD | CTR > PAT | CTR > MCI | CTR > AD | |
| C | 0.02 | 0.03 | 0.03 | ||||||
| D | 0.03 | 0.04 | |||||||
| E | <0.005 | 0.002 | 0.001 | 0.008a | 0.007a | 0.03a | 0.005a | 0.04a | 0.003a |
| F | 0.009 | 0.007 | 0.001 | a | a | a | 0.02 | 0.01 | |
| G | 0.02 | 0.01 | 0.03 | 0.03 | |||||
| H | 0.04 | ||||||||
P‐values (only displayed when significant at P < 0.05) of group differences of the model free analyses, the parameter estimates (PEs) of the on/off function of the model based analyses and of the temporal derivatives (TD). CTR, Controls; MCI, MCI patients; AD, AD patients; PAT, patients (mean MCI and AD response).
Significant interaction showing greater group differences for the model free approach than for the model based approach.
Two components spatially identified the motor cortices separately, showing activation with the paradigm (only the left motor cortex is shown in Fig. 1D and 2D). This is consistent with subjects' motor responses on male–female decisions during the face encoding paradigm. The thalamus was also included in this network. Activity of the left motor cortex was significantly diminished in AD compared with controls (P = 0.04, Table I).
The networks of medial (Fig. 1 and 2E) and lateral (F) visual regions also showed activation with the paradigm, consistent with the difference in visual input between the two paradigm conditions. The network (1E) also included the caudate nucleus, putamen, and hippocampus. Activation in these visual networks was significantly diminished in both patient groups (MCI: P = 0.002 and P = 0.007 for E and F; AD: P = 0.001 for E and F; Fig. 2E,F and Table I).
Two components showed deactivation, spatially identifying medial frontal regions, anterior and posterior cingulum, bilateral parietal cortex, parahippocampal gyrus bilaterally, and precuneus (G,H in Fig. 1 and 2). One of these components showed mostly anterior regions with deactivation (G), the other showed mostly posterior regions (H). These networks G+H are often referred to as the “default mode network” [Raichle et al., 2001]. Both networks showed less deactivation in AD patients compared with healthy controls (G: P = 0.01; H: P = 0.04; Fig. 2, Table I).
MCI and AD were not significantly different from each other for any component. There were no significant correlations with paradigm performance or MMSE scores. No network responses were diminished in controls compared with patients.
Comparison of Model‐Free and Model‐Based Analysis
Using the model‐based analysis, as described earlier [Rombouts et al., 2005a, b], we averaged the GLM PEs in each of the spatial mode networks defined by the model‐free analysis, in each patient and control separately. This resulted in two average PEs per subject for each network: one for the on/off function, and one for its temporal derivative. This was done to compare sensitivity for detecting group differences of the current method with the model‐based approach. This pooling across space leads to a much more sensitive model‐based analysis than the more standard voxel‐wise model‐based analysis.
The medial visual network (Fig. 1E) showed significantly decreased activation in MCI and AD compared with controls when analyzing the averaged PEs from the model‐based approach (P = 0.007 and P = 0.03, Table I). The deactivation in the mostly anterior network G was diminished in AD (P = 0.03, Table I). The other networks did not show a difference. The model‐based analysis also showed that the PE of the temporal derivative of the same (visual) network E was significantly decreased in MCI (P = 0.04) and AD (P = 0.003). The lateral visual network (Fig. 1F) was significantly decreased in AD (P = 0.01, Table I).
Group × model interactions showing that the patient‐controls group differences for the model free approach were significantly greater than for the model based approach were significant for the visual networks E and F (Table I). Other networks, C, D, and H, were not different between patients and controls with the model‐based approach. However, although they were significantly different using the model‐free analysis, these networks did not show a group × model interaction.
DISCUSSION
In this study, we have shown that for FMRI investigations of aging and dementia, the T‐PICA technique is well suited to extract signals of interest in spatial, temporal and also the subject domain. The most important finding is that activations and deactivations in various networks were diminished in demented patients. Furthermore, the current model‐free approach proved more sensitive to detect group differences than the commonly used model‐based analysis.
Previously, tensor‐PICA has been applied to FMRI task data in healthy young controls, showing plausible activation patterns and providing a richer description of data than model‐based techniques [Beckmann and Smith, 2005]. The added flexibility of such model free analysis is particularly interesting to apply in studies of aging and disease where the subjects' haemodynamic response can show significantly increased temporal deviation from a standard HRF [D'Esposito et al., 1999, 2003; Rombouts et al., 2005b] and where the distribution of individual subjects' responses within the population is often inhomogeneous. With model‐based analyses, activation may be underestimated when it does not correspond to the HRF model, or when it does not show a normal distribution. By comparison, T‐PICA results are not limited to well‐specified a‐priori regions, time series and/or subject‐dependent variations, although the factorization model used does assume constant shape of temporal response across subjects for a given component (if there is strong variability in temporal response shape this may, as desired, result in extra components being generated to reflect this).
1. Does T‐PICA show spatial activation maps comparable to previous model‐based analyses?
Previously, we described the regions of activation when applying a model‐based technique on the same data [Rombouts et al., 2005b]. Activation was found in medial and lateral visual regions, lingual and fusiform gyrus, frontal and parietal cortex, anterior cingulate cortex, hippocampus, putamen, caudate nucleus, thalamus, and postcentral gyrus. In the current study, the model free approach identified various networks of activation corresponding to visual processing, motor activation, and cognitive processes. Most activated regions of the previous model‐based analysis are included in any of the networks found in the current study, although sensitivity of the model‐free technique appears to be higher [Rombouts et al., 2005b].
We have also described a network of deactivation in a previous study using a model‐based technique on the same face encoding data and also for a working memory task [Rombouts et al., 2005a]. For the face encoding data, this network of deactivation included medial frontal regions, anterior and posterior cingulate cortex, and precuneus. This network is often referred to as the “default mode network,” and it has been suggested that this network is engaged in reviewing past knowledge, and planning of future behaviours, and that its activity is decreased during tasks requiring attention [Binder et al., 1999; Gusnard and Raichle, 2001; Raichle et al., 2001]. Deactivations are likely to represent reallocation of processing resources to areas involved in active task performance and may be due in part to suspension of spontaneous semantic processes that occur during resting state [McKiernan et al., 2003]. Within the current model‐free approach, this default mode network was found to show deactivation with the paradigm (Fig. 1). However, more regions were included in the network of deactivation when compared with the previous model‐based study: here we also found parietal regions to show deactivation. These findings are similar to previous studies focusing on the default mode network [Greicius et al., 2003; Lustig et al., 2003; Raichle et al., 2001]. Furthermore, we also found the parahippocampal gyrus to be included in this network. Greicius et al. have consistently shown hippocampal coactivation with the default mode network, suggesting that episodic memory is incorporated in default‐mode cognitive processing [Greicius and Menon, 2004; Greicius et al., 2004].
Overall, the current approach identifies various spatial processes in physiologically meaningful areas of the brain. All these areas appear in different components by virtue of the fact that the associated temporal response and/or the response within the population differ between these spatial maps and are consistent within the individual areas. This is an important advantage of the T‐PICA methodology as the standard GLM approach is limited by the assumptions encoded in the first‐ and second‐level designs.
In the current decomposition, the associated time courses for these spatial maps are highly correlated (mean temporal correlation of r > 0.81 ± 0.08 for the eight time‐courses) among each other. A GLM approach (using a simple canonical response function as a primary regressor of interest) therefore only estimates parts of all these spatial maps jointly into a single map of parameter estimates.
Various studies show that ICA decomposition can be used to identify resting state networks [Beckmann and Smith, 2005; Beckmann et al., 2005; Damoiseaux et al., 2006; De Luca et al., 2006; Greicius et al., 2004; Kiviniemi et al., 2003]. Independent component analysis (ICA) as a generic tool, extended to analyze FMRI group data in the current study, is very well suited to identify activations and deactivations both within and between groups. There is also a remarkable similarity between networks found in this study during a face encoding task, and networks identified during a resting state where no paradigm is involved [Beckmann et al., 2005]. All major components of the networks we show in Figure 1 are also identified as separate resting state networks in the study of Beckmann et al. [2005]. The only striking difference is that left and right motor cortex was split in two separate networks in the current study, while contained in one network in the study of Beckmann et al. [2005]. This similarity of paradigm related and resting state networks suggests a functional significance of resting state networks.
2. Does T‐PICA show significant group differences between dementia and controls?
Various networks, estimated using the model‐free approach, proved to have a diminished response in dementia. An asymmetric network of mainly right frontal and parietal regions (also including thalamus, hippocampus, insula, and caudate nucleus) showed decreased activation in dementia. The complementary pattern of left frontal and parietal regions was not different between patients and controls. These regions have been described earlier to have a diminished response in dementia during tasks of divided attention, verb processing and semantic memory, including parietal cortex and prefrontal cortex [Dannhauser et al., 2005; Grossman et al., 2003a, b]. We also showed decreased activation in dementia in the left motor regions, including the thalamus. This is a less common finding: studies explicitly testing for brain activation differences on passive sensory processing tasks usually do not show a change in dementia [Dannhauser et al., 2005; Machulda et al., 2003]. However, activation in the motor cortex in the current study is interacting with a memory encoding paradigm requiring male–female decisions. Reaction times in AD patients were also significantly slower. Both these factors might (partly) explain the observed differences.
The occipital lobe network (also including hippocampus, caudate, and putamen) also showed a decreased response in dementia patients (Fig. 1E,F). Altered responses in the occipital lobe have been shown previously in AD [Mentis et al., 1998], including our previous study applying a model‐based analysis on the current data [Rombouts et al., 2005b]. This may appear remarkable since neurofibrillary pathology in AD has been postulated to follow sequentially the entorhinal cotex, hippocampus and medial temporal lobe, temporoparietal regions, and in late stages of AD most of the neocortex [Smith, 2002a]. However, pathologic damage and measures of metabolism, flow and BOLD may not have the same association in each brain region. Pathologic damage in AD can be strongly associated with metabolic deficits in certain brain regions, while this association is lost in the temporal lobes [Mega et al., 1999]. Second, if BOLD is sensitive to regional changes in neurovascular coupling or possibly to vascular pathology, we may not necessarily be sensitive to detecting alterations in regions known to have early neurofibrillary pathology. Third, the task we applied has strongest activation in the occipital cortex, increasing sensitivity in these regions to detect changes in the BOLD signal.
The deactivation in the default mode network was also diminished in dementia using the model‐free analysis, both in the anterior and posterior parts of the network (Fig. 1G+H). This default mode network has received increasing attention in recent years, including dementia studies [Buckner et al., 2005; Celone et al., 2006; Greicius et al., 2004; Lustig et al., 2003; Rombouts et al., 2005a]. These studies suggest that activity in this network could be particularly sensitive to differentiate (early) dementia from healthy aging. A possible explanation for this is the observation that memory is an important component of the default mode network [Buckner et al., 2005].
Differences in BOLD responses between MCI and AD were not found. This probably relates to the heterogeneity of the MCI group. Clinical follow up data showed that almost half (44%) of the MCI patients were diagnosed with AD within 3 years after scanning. Hence, it is likely that half of the MCI group showed FMRI patterns resembling “probable AD” at time of scanning.
3. Is T‐PICA more sensitive in detecting group differences than the model‐based approach?
The expected increase in sensitivity to find networks differentially activated between controls and dementia proved to be true. With the model‐free technique, six networks showed a significantly diminished response in patients compared with controls. Three of these (the visual regions and the mostly anterior part of the default mode network) also had a significantly decreased response when using the model‐based analysis. The other three networks (frontal/parietal, motor, and the mostly posterior parts of the default mode network) did not show a controls–patients difference with the model‐based approach. Furthermore, the two networks of visual activation showed significantly greater group differences for the model‐free approach than for the model‐based approach. Although we also tested whether certain networks were more strongly present in dementia, we did not find any evidence for this.
The results presented in this study clearly show the strength of model‐free analysis (like T‐PICA) in relation to more standard model‐based analyses. However, certain limitations of this technique should not be ignored. Firstly, of all components resulting from the T‐PICA analysis, the effects of interest have to be identified. In the current study, this was done based on the spatial and temporal and subject–domain pattern of each component. The spatial pattern had to contain regions of grey matter, being located in physiologically meaningful regions while the temporal pattern had to correlate with the on/off task. In addition, the subject mode was required to be significantly nonzero for all subjects (as judged by the combined boxplot, i.e., without separating the three different groups) so that the associated process was not due to, e.g., single‐subject outliers.
This heuristic approach easily excludes spatial patterns related to motion and other sources of noise, and CSF and white matter signal. In general, the definition of such selection criteria may not be as straightforward as in this study. In studies of event‐related FMRI, different subjects can have different time courses associated with the same cognitive process and therefore with the same spatial pattern. The application of T‐PICA requires that each subject has an identical study design for event types and timings. Randomized designs or dense jittered event‐related designs require a different analysis technique where the timecourses of a component may vary between subjects. As such, such studies cannot be analyzed using the proposed T‐PICA approach.
Another limitation of the current study is the implementation of the comparison of the model‐based to the model‐free technique. This was done by averaging parameter estimates determined with the model‐based approach in networks defined with the model‐free approach. Consequently, the comparison is limited to the entire areas inferred from the model‐free approach. As such, we can not exclude that the model‐based method may show enhanced sensitivity for certain group differences (in certain voxels).
We conclude that T‐PICA is a promising tool to identify and compare brain networks between elderly controls and dementia. The method appears more sensitive than a commonly applied model‐based method and shows plausible networks to respond differently in dementia. Consistent with other research in altered BOLD responses current findings suggest that both networks of activation and deactivation show decreased reactivity in dementia.
REFERENCES
- Beckmann CF,Smith SM ( 2004): Probabilistic independent component analysis for functional magnetic resonance imaging. IEEE Trans Med Imag 23(2): 137–152. [DOI] [PubMed] [Google Scholar]
- Beckmann CF,Smith SM ( 2005): Tensorial extensions of independent component analysis for multisubject FMRI analysis. Neuroimage 25(1): 294–311. [DOI] [PubMed] [Google Scholar]
- Beckmann CF,Woolrich MW,Smith SM. ( 2003): Gaussian/Gamma mixture modelling of ICA/GLM spatial maps. Ninth Int Conf Funct Mapp Human Brain 19(2): S985. [Google Scholar]
- Beckmann CF,DeLuca M,Devlin JT,Smith SM ( 2005): Investigations into resting‐state connectivity using independent component analysis. Philos Trans R Soc Lond B Biol Sci 360(1457): 1001–1013. [DOI] [PMC free article] [PubMed] [Google Scholar]
- Binder JR,Frost JA,Hammeke TA,Bellgowan PS,Rao SM,Cox RW ( 1999): Conceptual processing during the conscious resting state. A functional MRI study. J Cogn Neurosci 11(1): 80–95. [DOI] [PubMed] [Google Scholar]
- Buckner RL,Snyder AZ,Sanders AL,Raichle ME,Morris JC. ( 2000): Functional brain imaging of young, nondemented, and demented older adults. J Cogn Neurosci 12 ( Suppl 2): 24–34. [DOI] [PubMed] [Google Scholar]
- Buckner RL,Snyder AZ,Shannon BJ,LaRossa G,Sachs R,Fotenos AF,Sheline YI,Klunk WE,Mathis CA,Morris JC,Mintun MA ( 2005): Molecular, structural, and functional characterization of Alzheimer's disease: Evidence for a relationship between default activity, amyloid, and memory. J Neurosci 25(34): 7709–7717. [DOI] [PMC free article] [PubMed] [Google Scholar]
- Calhoun VD,Adali T,Pearlson GD,Pekar JJ ( 2001): A method for making group inferences from functional MRI data using independent component analysis. Hum Brain Mapp 14(3): 140–151. [DOI] [PMC free article] [PubMed] [Google Scholar]
- Celone KA,Calhoun VD,Dickerson BC,Atri A,Chua EF,Miller SL,DePeau K,Rentz DM,Selkoe DJ,Blacker D,Albert MS,Sperling RA ( 2006): Alterations in memory networks in mild cognitive impairment and Alzheimer's disease: An independent component analysis. J Neurosci 26(40): 10222–10231. [DOI] [PMC free article] [PubMed] [Google Scholar]
- Damoiseaux JS,Rombouts SA,Barkhof F,Scheltens P,Stam CJ,Smith SM,Beckmann CF ( 2006): Consistent resting‐state networks across healthy subjects. Proc Natl Acad Sci USA 103(37): 13848–13853. [DOI] [PMC free article] [PubMed] [Google Scholar]
- Dannhauser TM,Walker Z,Stevens T,Lee L,Seal M,Shergill SS ( 2005): The functional anatomy of divided attention in amnestic mild cognitive impairment. Brain 128(Part 6): 1418–1427. [DOI] [PubMed] [Google Scholar]
- D'Esposito M,Zarahn E,Aguirre GK,Rypma B ( 1999): The effect of normal aging on the coupling of neural activity to the bold hemodynamic response. Neuroimage 10(1): 6–14. [DOI] [PubMed] [Google Scholar]
- D'Esposito M,Deouell LY,Gazzaley A ( 2003): Alterations in the BOLD fMRI signal with ageing and disease: A challenge for neuroimaging. Nat Rev Neurosci 4(11): 863–872. [DOI] [PubMed] [Google Scholar]
- De Luca M,Beckmann CF,De Stefano N,Matthews PM,Smith SM ( 2006): fMRI resting state networks define distinct modes of long‐distance interactions in the human brain. Neuroimage 29(4): 1359–1367. [DOI] [PubMed] [Google Scholar]
- Dickerson BC,Salat DH,Bates JF,Atiya M,Killiany RJ,Greve DN,Dale AM,Stern CE,Blacker D,Albert MS,Sperling RA ( 2004): Medial temporal lobe function and structure in mild cognitive impairment. Ann Neurol 56(1): 27–35. [DOI] [PMC free article] [PubMed] [Google Scholar]
- Folstein MF,Folstein SE,McHugh PR ( 1975): “Mini‐mental state”. A practical method for grading the cognitive state of patients for the clinician. J Psychol Res 12(3): 189–198. [DOI] [PubMed] [Google Scholar]
- Goekoop R,Rombouts SA,Jonker C,Hibbel A,Knol DL,Truyen L,Barkhof F,Scheltens P ( 2004): Challenging the cholinergic system in mild cognitive impairment: A pharmacological fMRI study. Neuroimage 23(4): 1450–1459. [DOI] [PubMed] [Google Scholar]
- Golby A,Silverberg G,Race E,Gabrieli S,O'Shea J,Knierim K,Stebbins G,Gabrieli J ( 2005): Memory encoding in Alzheimer's disease: An fMRI study of explicit and implicit memory. Brain 128(Part 4): 773–787. [DOI] [PubMed] [Google Scholar]
- Greicius MD,Menon V ( 2004): Default‐mode activity during a passive sensory task: Uncoupled from deactivation but impacting activation. J Cogn Neurosci 16(9): 1484–1492. [DOI] [PubMed] [Google Scholar]
- Greicius MD,Krasnow B,Reiss AL,Menon V ( 2003): Functional connectivity in the resting brain: A network analysis of the default mode hypothesis. Proc Natl Acad Sci USA 100(1): 253–258. [DOI] [PMC free article] [PubMed] [Google Scholar]
- Greicius MD,Srivastava G,Reiss AL,Menon V ( 2004): Default‐mode network activity distinguishes Alzheimer's disease from healthy aging: Evidence from functional MRI. Proc Natl Acad Sci USA 101(13): 4637–4642. [DOI] [PMC free article] [PubMed] [Google Scholar]
- Grossman M,Koenig P,DeVita C,Glosser G,Moore P,Gee J,Detre J,Alsop D ( 2003a): Neural basis for verb processing in Alzheimer's disease: An fMRI study. Neuropsychology 17(4): 658–674. [DOI] [PubMed] [Google Scholar]
- Grossman M,Koenig P,Glosser G,DeVita C,Moore P,Rhee J,Detre J,Alsop D,Gee J ( 2003b): Neural basis for semantic memory difficulty in Alzheimer's disease: An fMRI study. Brain 126(Part 2): 292–311. [DOI] [PubMed] [Google Scholar]
- Gusnard DA,Raichle ME ( 2001): Searching for a baseline: Functional imaging and the resting human brain. Nat Rev Neurosci 2(10): 685–694. [DOI] [PubMed] [Google Scholar]
- Jenkinson M,Smith S ( 2001): A global optimisation method for robust affine registration of brain images. Med Image Anal 5(2): 143–156. [DOI] [PubMed] [Google Scholar]
- Jenkinson M,Bannister P,Brady M,Smith S ( 2002): Improved optimization for the robust and accurate linear registration and motion correction of brain images. Neuroimage 17(2): 825–841. [DOI] [PubMed] [Google Scholar]
- Kiviniemi V,Kantola JH,Jauhiainen J,Hyvarinen A,Tervonen O. ( 2003): Independent component analysis of nondeterministic fMRI signal sources. Neuroimage 19(2 Part 1): 253–260. [DOI] [PubMed] [Google Scholar]
- Lustig C,Snyder AZ,Bhakta M,O'Brien KC,McAvoy M,Raichle ME,Morris JC,Buckner RL ( 2003): Functional deactivations: Change with age and dementia of the Alzheimer type. Proc Natl Acad Sci USA 100(24): 14504–14509. [DOI] [PMC free article] [PubMed] [Google Scholar]
- Machulda MM,Ward HA,Borowski B,Gunter JL,Cha RH,O'Brien PC,Petersen RC,Boeve BF,Knopman D,Tang‐Wai DF,Ivnik RJ,Smith GE,Tangalos EG,Jack CR ( 2003): Comparison of memory fMRI response among normal, MCI, and Alzheimer's patients. Neurology 61(4): 500–506. [DOI] [PMC free article] [PubMed] [Google Scholar]
- McKeown MJ,Makeig S,Brown GG,Jung TP,Kindermann SS,Bell AJ,Sejnowski TJ ( 1998): Analysis of fMRI data by blind separation into independent spatial components. Hum Brain Mapp 6(3): 160–188. [DOI] [PMC free article] [PubMed] [Google Scholar]
- McKhann G,Drachman D,Folstein M,Katzman R,Price D,Stadlan EM ( 1984): Clinical diagnosis of Alzheimer's disease: report of the NINCDS‐ADRDA Work Group under the auspices of Department of Health and Human Services Task Force on Alzheimer's disease. Neurology 34(7): 939–944. [DOI] [PubMed] [Google Scholar]
- McKiernan KA,Kaufman JN,Kucera‐Thompson J,Binder JR ( 2003): A parametric manipulation of factors affecting task‐induced deactivation in functional neuroimaging. J Cogn Neurosci 15(3): 394–408. [DOI] [PubMed] [Google Scholar]
- Mega MS,Chu T,Mazziotta JC,Trivedi KH,Thompson PM,Shah A,Cole G,Frautschy SA,Toga AW ( 1999): Mapping biochemistry to metabolism: FDG‐PET and amyloid burden in Alzheimer's disease. Neuroreport 10(14): 2911–2917. [DOI] [PubMed] [Google Scholar]
- Mentis MJ,Alexander GE,Krasuski J,Pietrini P,Furey ML,Schapiro MB,Rapoport SI ( 1998): Increasing required neural response to expose abnormal brain function in mild versus moderate or severe Alzheimer's disease: PET study using parametric visual stimulation. Am J Psychiatry 155(6): 785–794. [DOI] [PubMed] [Google Scholar]
- Morris JC ( 1993): The Clinical Dementia Rating (CDR): Current version and scoring rules. Neurology 43(11): 2412–2414. [DOI] [PubMed] [Google Scholar]
- Petersen RC,Doody R,Kurz A,Mohs RC,Morris JC,Rabins PV,Ritchie K,Rossor M,Thal L,Winblad B ( 2001): Current concepts in mild cognitive impairment. Arch Neurol 58(12): 1985–1992. [DOI] [PubMed] [Google Scholar]
- Raichle ME,MacLeod AM,Snyder AZ,Powers WJ,Gusnard DA,Shulman GL ( 2001): A default mode of brain function. Proc Natl Acad Sci USA 98(2): 676–682. [DOI] [PMC free article] [PubMed] [Google Scholar]
- Rombouts SA,Barkhof F,Van Meel CS,Scheltens P ( 2002): Alterations in brain activation during cholinergic enhancement with rivastigmine in Alzheimer's disease. J Neurol Neurosurg Psychiatry 73(6): 665–671. [DOI] [PMC free article] [PubMed] [Google Scholar]
- Rombouts SA,Barkhof F,Goekoop R,Stam CJ,Scheltens P ( 2005a): Altered resting state networks in mild cognitive impairment and mild Alzheimer's disease: An fMRI study. Hum Brain Mapp 26(4): 231–239. [DOI] [PMC free article] [PubMed] [Google Scholar]
- Rombouts SA,Goekoop R,Stam CJ,Barkhof F,Scheltens P ( 2005b): Delayed rather than decreased BOLD response as a marker for early Alzheimer's disease. Neuroimage 26(4): 1078–1085. [DOI] [PubMed] [Google Scholar]
- Rombouts SA,Scheltens P,Kuijer JP,Barkhof F ( 2007): Whole brain analysis of T2* weighted baseline FMRI signal in dementia. Hum Brain Mapp (in press). [DOI] [PMC free article] [PubMed] [Google Scholar]
- Saykin AJ,Wishart HA,Rabin LA,Flashman LA,McHugh TL,Mamourian AC,Santulli RB ( 2004): Cholinergic enhancement of frontal lobe activity in mild cognitive impairment. Brain 127(Part 7): 1574–1583. [DOI] [PubMed] [Google Scholar]
- Small SA,Perera GM,DeLaPaz R,Mayeux R,Stern Y ( 1999): Differential regional dysfunction of the hippocampal formation among elderly with memory decline and Alzheimer's disease. Ann Neurol 45(4): 466–472. [DOI] [PubMed] [Google Scholar]
- Smith AD ( 2002a): Imaging the progression of Alzheimer pathology through the brain. Proc Natl Acad Sci USA 99(7): 4135–4137. [DOI] [PMC free article] [PubMed] [Google Scholar]
- Smith SM ( 2002b): Fast robust automated brain extraction. Hum Brain Mapp 17(3): 143–155. [DOI] [PMC free article] [PubMed] [Google Scholar]
- Smith SM,Jenkinson M,Woolrich MW,Beckmann CF,Behrens TE,Johansen‐Berg H,Bannister PR,De Luca M,Drobnjak I,Flitney DE,Niazy RK,Saunders J,Vickers J,Zhang Y,De Stefano N,Brady JM,Matthews PM ( 2004): Advances in functional and structural MR image analysis and implementation as FSL. Neuroimage 23 ( Suppl 1): S208–S219. [DOI] [PubMed] [Google Scholar]