

Abstract
Most neuroimaging studies are performed using one imaging method only, either functional magnetic resonance imaging (fMRI), electroencephalography (EEG), or magnetoencephalography (MEG). Information on both location and timing has been sought by recording fMRI and EEG, simultaneously, or MEG and fMRI in separate sessions. Such approaches assume similar active areas whether detected via hemodynamic or electrophysiological signatures. Direct comparisons, after independent analysis of data from each imaging modality, have been conducted primarily on low‐level sensory processing. Here, we report MEG (timing and location) and fMRI (location) results in 11 subjects when they named pictures that depicted an action or an object. The experimental design was exactly the same for the two imaging modalities. The MEG data were analyzed with two standard approaches: a set of equivalent current dipoles and a distributed minimum norm estimate. The fMRI blood‐oxygen‐level dependent (BOLD) data were subjected to the usual random‐effect contrast analysis. At the group level, MEG and fMRI data showed fairly good convergence, with both overall activation patterns and task effects localizing to comparable cortical regions. There were some systematic discrepancies, however, and the correspondence was less compelling in the individual subjects. The present analysis should be helpful in reconciling results of fMRI and MEG studies on high‐level cognitive functions. Hum Brain Mapp, 2009. © 2009 Wiley‐Liss, Inc.
Keywords: language, picture naming, speech production, visual, multimodal neuroimaging
INTRODUCTION
The use of functional neuroimaging methods, such as MEG and fMRI, in basic research and in clinical applications has increased drastically over the past decade. Ideally, for the best possible characterization of neural activity one would like to bring together the strengths of both methods; the excellent spatial resolution of fMRI and the superb temporal resolution and reasonable spatial specificity of MEG. Combining MEG and fMRI data is, however, not straightforward as the methods detect different aspects of neural activation. MEG measures the magnetic field produced by synchronously activated neurons, whereas the fMRI BOLD signal is proportional to the amount of deoxygenated blood flowing in a cortical area and reflects the energy consumption of the neurons rather than information processing per se. Because of the different nature of the signals, MEG and fMRI might be sensitive to different components of the overall neural activity, particularly in tasks that reach beyond early sensory processing or basic motor performance. For example, attentional modulation affects both fMRI and late MEG responses, whereas early short‐lasting but highly synchronized activation detected by MEG may go undetected in fMRI [Furey et al., 2006]. Thus, the similarities and differences should be better characterized for a better understanding of how to interpret diverging or converging results obtained with the different methods.
To date, most studies that have measured both fMRI and MEG have used fMRI BOLD maps as spatial constraints in MEG source localization [Ahlfors and Simpson, 2004; Auranen et al., 2008; Dale et al., 2000; Korvenoja et al., 1999; Liu et al., 1998]. Vice versa, MEG activation strengths could be incorporated as regressors in fMRI analysis to identify brain areas that show a specific type of response to stimuli or tasks [for EEG‐fMRI studies of this type see, e.g., Debener et al. 2005; Eichele et al., 2005]. Both of these approaches rest, implicitly, on the assumption that the fMRI and MEG responses derive from the same source locations. The validity of this assumption should, however, be tested by analyzing MEG and fMRI data separately, and thereafter evaluating the convergence of the results. Most studies that have compared fMRI and MEG in the same subjects and in the same task have focused on low‐level sensory processing [e.g., Brunetti et al., 2005; Moradi et al., 2003; Sharon et al., 2007]. Only a few studies have combined fMRI and MEG in higher‐level cognitive tasks [e.g. Billingsley‐Marshall et al., 2007; Brunetti et al., 2008; Croizé et al., 2004; see also Schulz et al., 2008; Vitacco et al., 2002 for EEG‐fMRI comparisons] in which the results from the different imaging methods could, potentially, reveal greater divergence.
In this study, we investigate the differences and similarities in the activation patterns obtained with MEG and fMRI in a high‐level cognitive task, picture naming. Picture naming is a theoretically and experimentally well‐defined task that includes all the main stages of word production: conceptualization, formulation, and articulation [Harley, 2001]. In picture naming these stages are specified as object recognition and semantic access, access to the phonological form, and finally phonetic coding of the articulation [Levelt et al., 1999].
The network activated in picture naming includes bilateral occipitotemporal cortex and parietal cortex, left inferior frontal and dorsal premotor areas, as shown by fMRI studies [Liljeström et al., 2008; Murtha et al., 1999; Price et al., 2005; Price et al., 1996]. In MEG studies, the activation proceeds from the occipital cortex (<200 ms) to parietal and temporal areas (>200 ms) and further to frontal regions (>300 ms) [Hultén et al., 2009; Levelt et al., 1998; Salmelin et al., 1994; Sörös et al., 2003; Vihla et al., 2006].
Studies of aphasic patients have shown that damage to the brain can affect verbs or nouns selectively, thus raising the possibility that verbs and nouns could be processed in different cortical regions [for a review, see Shapiro and Caramazza, 2003]. These effects have been suggested to derive from either grammatical [Caramazza and Hillis, 1991; Shapiro et al., 2000] or semantic [Damasio and Tranel, 1993; Martin and Chao, 2001; McCarthy and Warrington, 1985] aspects related to verbs vs. nouns. In behavioral studies, verb naming is tested with pictures that depict an action, whereas nouns are typically named from pictures that display an object only. In a recent fMRI study, we included both types of images and asked the subjects to name, in separate blocks, both verbs and nouns from the action images and nouns from the object images. We found that the image category had a stronger influence than the naming category on activation within the picture naming network [Liljeström et al., 2008]. However, it remains unclear whether time‐sensitive neuroimaging would yield the same type of differentiation in action vs. object naming as hemodynamic measures. Previous MEG work on naming has used either pictures of a single object [Hultén et al., 2009; Levelt et al., 1998; Salmelin et al., 1994; Vihla et al., 2006] or pictures depicting an action [Sörös et al., 2003] but not both in the same study. Taken together, these studies suggest consistent involvement of the left temporal cortex in naming pictures that only contain an object but, potentially, more pronounced left parietal and frontal contribution when naming nouns or verbs from pictures that depict an action performed on or with an object.
In the present MEG study, we repeated our earlier fMRI study [Liljeström et al., 2008] on the same subjects, using exactly the same paradigm. The subjects were asked to silently name, in separate blocks, both objects and actions from images that illustrate a simple event (e.g., a ladder, to climb). In addition, objects were named from images depicting an object, without an associated action. Our aim was to see whether fMRI and MEG results would yield the same conclusions, when the data are analyzed in a way typical for each method. The MEG data were modeled by Equivalent Current Dipoles (ECDs) and by using a cortically constrained Minimum Norm Estimate (MNE) that yields distributed maps of cortical activity. These results were compared with the fMRI BOLD maps both at group level and in individual subjects to estimate the correspondence of the overall MEG and fMRI patterns in picture naming and to evaluate how the stimulus and task effects were manifested in the two imaging modalities.
MATERIALS AND METHODS
Subjects
Twelve healthy native Finnish speakers participated in the MEG experiment. The same subjects had also participated in the fMRI experiment 16–29 months earlier [Liljeström et al., 2008; 15 subjects]. The MEG data from one subject was discarded because of magnetic artifacts, thus the data from 11 subjects (four females, seven males, ages 20–33, mean age 27) were analyzed. Informed consent was obtained from all subjects, in agreement with the prior approval of the Helsinki and Uusimaa Ethics Committee.
Stimuli and Experimental Design
The task was to silently name actions and objects presented in simple line drawings (see Fig. 1). The experimental designs for the fMRI and MEG experiments were identical [cf. Liljeström et al., 2008, for details on the fMRI experiment]. In addition, in the MEG experiment, the same images were named overtly in separate sessions. The order of the MEG sessions was randomized across subjects. The MEG experiment thus comprised four sessions (two silent and two overt), each lasting 13 min, with short breaks between the sessions. This study considers only the silent condition.
Figure 1.

Examples of stimuli. Pictures displayed an action (left) or the object only, with the action dissolved to random lines to preserve the overall level of visual complexity (right). Both actions and objects were named from action images (left) and objects were named from object images (right).
The stimuli consisted of two separate sets of images, action images, depicting an action, and object‐only images, which contained the same objects but where the action had been dissolved to arbitrary lines to preserve visual complexity. Each set comprised 100 images. The verb and noun corresponding to one image always had a different word stem. For further details on the stimulus material, see Liljeström et al. [ 2008].
There were three naming conditions: Actions were named from the action images (Act), and objects were named from the same action images (ObjAct), and from the object‐only images (Obj). Images were presented in blocks of 10 items. The same set of 100 action images was used in both the Act and ObjAct conditions. Task blocks (30 s) and rest blocks (21 s) alternated. Each image was shown for 300 ms, with a variable interval of 1.8–4.2 s. During the rest period the Finnish word LEPO (“rest”) was shown on the screen. At the end of the rest period, the word changed to ESINE (“object”) or TEKEE (“does”) to prompt the subject to name either nouns or verbs during the task period. The order of the three conditions (Act, ObjAct, and Obj) was randomized.
MEG Measurements
We employed a Vectorview whole‐head MEG device (Elekta Neuromag Oy, Helsinki, Finland), which comprises 102 triple sensor elements in a helmet‐shaped array. Each triplet contains two orthogonal planar gradiometers and one magnetometer. The head position with respect to the sensor array was determined by four head position indicator coils attached to the subject's scalp. The locations of the coils with respect to three anatomical landmarks (nasion and preauricular points) were found with a 3D digitizer (Polhemus, Colchester, VT). Identifying these fiducial points on the subject's MR images establishes the coordinate transformation between MEG and fMRI. The stimulus images were projected onto a screen in front of the subject.
The MEG signals were filtered to 0.03–200 Hz and sampled at 600 Hz. Epochs contaminated by eye blinks or saccades (based on electro‐oculograms) or excessively large MEG amplitudes (exceeding 3,000 fT/cm) were rejected. For rejection of nearby interference the spatiotemporal signal space separation method [tSSS, Taulu and Simola, 2006] was applied. Averages were calculated for each condition in a time window from −200 to 1000 ms with respect to the stimulus onset. The averaged responses were baseline‐corrected to the 200‐ms interval preceding stimulus onset (defined as the zero level) and low‐pass filtered at 40 Hz. On average, 79 (minimum 50) artifact‐free trials were obtained for each individual in each condition.
MEG Data Analysis
Sensor‐level analysis: Areal mean signals
Spatial average signals were calculated over six regions: left and right posterior, central, and anterior (14–20 sensor elements per region). First, vector sums were computed as the square root of the sum of the squared planar gradiometer signals at each sensor element. The areal mean signals (AMS) were obtained by averaging these vector sums for each area of interest, individually for each subject, and across subjects for the group‐level visualization. Effects of stimulus and task on the mean amplitudes were evaluated for the posterior channels in the 100–200 ms time window using a 2 × 3 repeated measures ANOVA, and in the time windows 200–260 ms, 260–320, and 320–800 ms using a 6 × 3 repeated‐measures ANOVA (all six regions × three stimulus categories).
Source analysis: Equivalent current dipoles
Equivalent Current Dipoles (ECDs) were used to model activated cortical areas. An ECD is a convenient way to represent the mean of an active cortical patch, and the orientation and strength of current flow in that area [Hämäläinen et al., 1993]. The geometry of the volume conductor was approximated by a sphere fitted to the individual inner skull curvature determined from anatomical MR images. The ECD analysis was done with the Elekta Neuromag software package, and proceeded as described earlier [e.g., Helenius et al., 1998; Hultén et al., 2009; Salmelin et al., 1994; Salmelin et al., 2000]. Each ECD was determined at a time point when the distinct dipolar field pattern was most salient and had least interference from other active areas, using a subset of planar gradiometers that spatially covered the specific field pattern. The ECD analysis was done individually in each subject and separately for each condition, but as the locations of the identified sources did not vary substantially between conditions, it was possible to form a single set of ECDs for each subject that accounted for the measured MEG signals in all conditions. The amplitudes of the ECDs in this multidipole model were allowed to vary to best explain the measured data over the entire averaging period, which yielded the source strengths as a function of time in each condition.
For visualization and group‐level clustering, all sources were transformed to one participant's brain using an elastic transformation between the corresponding anatomical MR images [Schormann et al., 1996; Woods et al., 1998a, b]. The individual sources were grouped together based on spatial proximity and similarity in temporal behavior. The effects of stimulus and task on the mean activation strength in the main time windows of activation were evaluated for clusters with activation in at least seven subjects using a one‐way ANOVA (three stimulus categories). At the individual level, stimulus/task effects were tested pair‐wise, against the combined standard deviation of the two source time courses (square root of the sum of the squared standard deviations in the prestimulus baseline interval) [Tarkiainen et al., 1999]. A difference exceeding 2.58 times the standard deviation (P < 0.01) for at least 100 ms was considered significant.
Source analysis: Minimum norm estimates
The “MNE Suite” software package (M. Hämäläinen, Martinos Center for Biomedical Imaging, Massachusetts General Hospital, MA) was used to obtain a distributed source model of the activation sequence. Sources were constrained to the cortical surface that was reconstructed from structural MRI data with the Freesurfer software package [Dale et al., 1999; Fischl et al., 2001]. The locations of the potential sources were ∼5 mm apart on the surface, resulting in about 5,000 locations in each hemisphere. Currents normal to the local cortical surface were favored over the transverse ones by a factor of 3.3 [the loose orientation constraint approach; Lin et al., 2006]. The inherent bias towards superficial currents in the Minimum Norm Estimate (MNE) was reduced by depth‐weighting. An individual single‐compartment boundary element model (BEM) was employed in the forward computation. A noise covariance matrix estimated from the 200‐ms unaveraged prestimulus baselines was used in obtaining noise‐normalized MNEs (dynamic Statistical Parametric Maps, dSPM), which represent an estimate of the signal‐to‐noise ratio at each source location as a z‐score [Dale et al., 2000]. The estimates were visualized on the inflated and flattened cortical surface [Fischl et al., 1999a]. In one subject, a Freesurfer cortical surface representation could not be constructed because of insufficient contrast between gray and white matter in the anatomical MRI set.
To compute and visualize the MNE group results, each subject's cortical surface was morphed [Fischl et al., 1999b] to a surface‐based representation of the Montreal Neurological Institute (MNI) single–subject brain used in the SPM2 software (Wellcome Trust Centre for Neuroimaging, London, UK), and the MNEs were averaged across subjects.
Transforming MEG source locations to the MNI coordinate frame
The ECD locations and orientations, expressed in the subject‐specific head coordinate system as a result of the dipole fitting procedure, were transformed to the common MNI space. This was accomplished by combining the linear transformations between the head and Freesurfer MRI coordinates (6‐parameter rigid body, obtained from the Elekta Neuromag software) and between the Freesurfer MRI and “MNI Talairach” coordinates (12‐parameter affine, obtained from Freesurfer). Both transformations were verified visually by superimposing the fiducials and volumetric MRIs.
The MNE maxima, defined as the source locations (in head coordinates) with the maximum z‐score at any time instant in a given search region, were transformed to the MNI space by the same procedure as the ECD locations. The search regions, encompassing the main maxima, were drawn on the cortical surface of the single‐subject MNI brain (see Table I) and morphed to each individual brain, for identification of activations that were consistent across subjects.
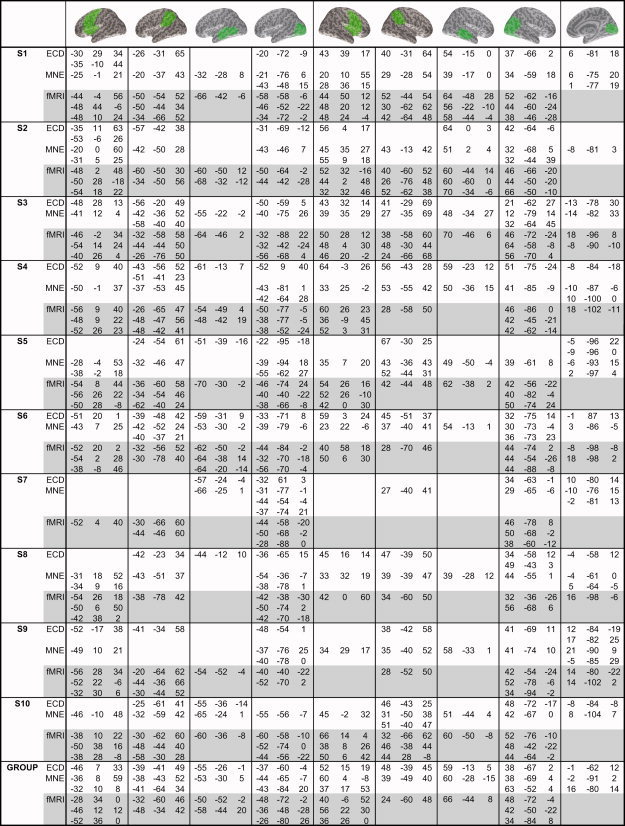
Table 1.
Locations of MEG and fMRI activations, consistently activated across subjects
|
Individual MNI coordinates of ECD, MNE, and fMRI BOLD maxima in different brain regions for 10 subjects. The group‐level mean coordinates were extracted from the group‐level SPM2 images and MNE average maps, and calculated as an average of the individual ECD locations within each cluster. The three strongest fMRI maxima (P < 0.01, FWE for individual subjects; P < 0.01, FDR for group results) were included in the table. The MEG coordinate transformations to the MNI frame could not be done in one subject who lacked a Freesurfer cortical surface representation.
The distances between MEG source locations, defined as ECD locations and MNE maxima in MNI coordinates, and the nearest fMRI local maxima were calculated.
fMRI Experiment and Data Analysis
The results from the fMRI experiment for 15 subjects have been reported earlier [cf. Liljeström et al., 2008, for details]. Random‐effect group results for the 11 subjects that participated in the MEG experiment were recalculated using SPM2, and corrected for false discovery rate (FDR, P < 0.01 in task‐rest contrasts; P < 0.05 in task‐task contrasts) [Genovese et al., 2002]. For easy visual comparison with MEG data, group contrasts were overlaid on a surface‐based representation of the MNI single‐subject brain using the SPM “surfrend” toolbox (I. Kahn; http://spmsurfrend.sourceforge.net). The fMRI single‐subject data (FDR, P < 0.001 in task‐rest contrasts; P < 0.01 in task‐task contrasts) were coregistered to the Freesurfer MRI and transferred to Freesurfer for visualization on the individual cortical surfaces. Anatomical regions were identified using an automated anatomical labeling atlas by Tzourio‐Mazoyer et al. [ 2002].
RESULTS
At the MEG sensor level (see Fig. 2), naming nouns from object‐only images (Obj) evoked stronger responses than naming verbs from action images (Act) in the posterior channels in the 100–200 ms time window [F(2, 20) = 3.9, P < 0.05; planned comparisons Obj > Act t(10) = 3.2, P = 0.01]. Naming verbs (Act) or nouns (ObjAct) from images depicting an action evoked stronger responses than naming objects from object‐only images (Obj) in the 320–800 ms time window [F(2, 20) = 9.1, P < 0.01; planned comparisons Act > Obj t(10) = 3.3, P < 0.01; ObjAct > Obj t(10) = 3.7, P < 0.01; ObjAct vs. Act n.s.]. The mean amplitude was strongest over posterior regions, and decreased toward anterior regions [linear trend 200–260 ms: F(1,10) = 18.2, P < 0.01; 260–320 ms: F(1,10) = 12.8, P < 0.01; cubic trend 320–800 ms: F(1,10) = 11.7, P < 0.01].
Figure 2.
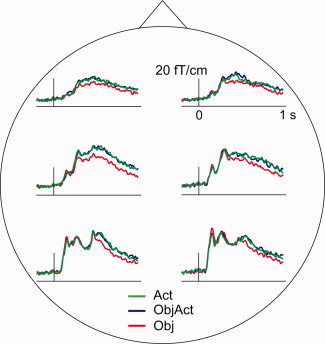
Regional averages of MEG sensor signals. Grand average across subjects. The signal amplitude was significantly lower to object‐only stimuli (Obj) than to the action stimuli, regardless of whether the subjects named verbs (Act) or nouns (ObjAct) from the action pictures.
In the MEG ECD analysis, nine different cortical regions showed activation consistently across subjects (Table I; Fig. 3, left column). Activation progressed from early visual areas (posterior view at the bottom, peak latency 152 ± 12 ms (mean ± SEM), 10 subjects) to bilateral occipitotemporal cortex (left 236 ± 15 ms, 9 subjects; right 219 ± 14 ms, 9 subjects) and to the parietal cortex (left 297 ± 17 ms, 10 subjects; right 310 ± 14 ms, 8 subjects). From about 300 ms onwards more sustained activations were observed in the left posterior temporal cortex (peak latency at 488 ± 60 ms, 7 subjects), right superior temporal cortex (422 ± 86 ms, 4 subjects), and bilaterally in the frontal cortex (left 515 ± 34 ms, 7 subjects; right 570 ± 42 ms, 7 subjects). Table I lists the specific coordinates for each subject, and for the group, within each region.
Figure 3.

Group‐level MEG and fMRI maps. Left‐hemisphere data at the top, right‐hemisphere data in the middle, and the posterior view at the bottom. Left: MEG ECD analysis. The dots represent the centers of active cortical areas, and the colors the clustering based on location and time behavior. The curves depict the mean time course of activation in the clusters. The light gray shading denotes brain regions and time windows with significant difference between stimulus types. Middle: MEG MNE analysis, averaged across all task conditions. Z‐scores (color coded) in representative time windows. On the inflated view, dark gray areas represent sulci and light gray areas gyri. Right: fMRI SPM2 analysis. Each view shows the task > rest contrast above (FDR, P < 0.01) and, below, the task–task contrasts that reached significance in this group of 11 subjects (FDR, P < 0.05).
The activation strength differed between the stimulus conditions in three areas (gray shading in Fig. 3, left column). In the left parietal region [260–320 ms: F(2,18) = 4.5, P < 0.05], activation was stronger when naming verbs (Act) or nouns (ObjAct) from action images compared to naming nouns from object images (Obj) [Act > Obj t(9) = 3.1, P < 0.05; ObjAct > Obj t(9) = 2.3, P < 0.05]. In the left frontal region [320–800 ms: F(2,12) = 3.9, P < 0.05], the activation was stronger for naming nouns from action images than from object‐only images [ObjAct > Obj t(6) = 2.4, P = 0.05], approaching significance for naming verbs from action images compared to naming nouns from object‐only images [Act > Obj t(6) = 2.0, P = 0.09]. In the central occipital area, the early visual responses [100–200 ms: F(2, 18) = 3.5, P = 0.05] were stronger for the object‐only than action images [Obj > Act: t(9) = 2.5, P < 0.05]. No significant effects were found in the occipitotemporal (200–260 ms) or left temporal clusters (320–800 ms; right temporal sources not tested).
The distributed MNE maps corroborated the ECD activation sequence. Figure 3 (middle column) shows the activation sequence for four different time windows, averaged across all task conditions (for activation maps of the specific tasks, see Supporting Information Fig. S1). Early visual activation was seen in the 100–200 ms time window, followed by bilateral occipitotemporal responses at 200–260 ms. The 260–320 ms time window captured activation of the parietal cortex, close to the parieto‐temporal junction, and posterior and middle temporal cortex. From 320 ms onwards, activation was detected in the premotor/precentral and inferior frontal cortex, largely concentrating to the insula, accompanied by activation in the left occipitotemporal and bilateral middle temporal cortex (see Table I for specific coordinates of MNE maxima). Whereas the ECD analysis indicated prominent, separable activations in the left parietal and inferior occipitotemporal cortex, the MNE average map showed several weaker parietal and occipitotemporal maxima.
In fMRI, the results reported by Liljeström et al. [ 2008] for the group of 15 subjects were reproduced in the present subgroup of 11 subjects (Fig. 3, right column). The task > rest contrast across all naming conditions showed bilateral activation of a large cortical network, including the inferior occipitotemporal cortex and fusiform gyrus, the superior parietal cortex, and the posterior middle temporal cortex. In the frontal lobes prominent activation was seen in the precentral gyrus, the middle frontal gyrus, the inferior frontal cortex, and the insula, bilaterally (cf. Table I). Activation was also observed in the supplementary motor area (SMA), bilaterally in the hippocampus, and in the cerebellum. In the task–task contrasts, activation in the premotor/precentral and inferior frontal cortex and near the parietotemporal junction was stronger when naming nouns (ObjAct) or, to a lesser degree, when naming verbs (Act) from images depicting an action than when naming objects from object‐only images (Obj). In this subpopulation, the ObjAct > Act comparison [cf. Liljeström et al., 2008] did not reach significance.
A number of cortical regions showed activation both in MEG and fMRI, such as the bilateral occipitotemporal, parietal cortex and inferior frontal cortex (see Table I). The frontal involvement was particularly pronounced in fMRI, as strong inferior frontal and precentral BOLD responses were observed in every subject. In MEG, frontal activation was detected in several subjects, but with more inter‐subject variation. Activation of the right middle temporal cortex in MEG was not detected in fMRI (Fig. 4, S1, S3, and S4; Table I), possibly because of loss of signal in the vicinity of ear canals. Early visual responses in the occipital cortex were detected with MEG in all subjects but not in group‐level fMRI (although 5 of 10 individuals did show activation in early visual regions, see Table I). SMA activation was observed in all subjects in fMRI, but was not consistently detected in MEG. Activation in deeper structures (such as the hippocampus) or the cerebellum was not seen in MEG.
Figure 4.

Individual MEG and fMRI maps. Examples of four subjects. In the MEG data (left), ECDs are displayed as white dots on the MNE‐inflated maps. The MNE maps were averaged across all task conditions. The fMRI maps (right) depict the task > rest contrasts (FDR, P < 0.001).
Although MEG and fMRI both show involvement of a largely similar cortical network in picture naming, there were differences in exact source locations. With fMRI, multiple local maxima located close to each other could be distinguished (Fig. 3, Table I). At the group level, the difference between ECD locations and the nearest fMRI local maxima was 15 ± 3 mm (mean ± SEM). The average difference between the MNE and fMRI local maxima was 14 ± 2 mm. The correspondence was more tenuous at the level of individual subjects (Fig. 4, Table I). For individuals, the average difference between ECD locations and fMRI local maxima was 18 ± 1 mm (25% located within 11 mm, 50% within 17 mm, 75% within 22 mm). Between MNE and fMRI local maxima the difference was 19 ± 1 mm (25% within 12 mm, 50% within 16 mm, 75% within 24 mm). MEG activations were, on average, localized deeper than the corresponding nearest cortical fMRI maxima (ECDs: 3 mm deeper in the left‐right direction, and 4 mm deeper in the anterior–posterior direction; MNE: 4 mm deeper in the left‐right direction and 2 mm in the anterior–posterior direction).
As regards stimulus effects, object naming from object‐only images (Obj) evoked significantly less activation than naming from action images (Act, ObjAct) in the left frontal and parietal areas in both the ECD and fMRI group analysis; this differentiation reached the criterion for significance at the individual level as well, in a number of subjects (ECD: frontal 4 subjects, parietal 3; fMRI: frontal 8, parietal 7). The left posterior temporal effect and right‐hemisphere differences in fMRI did not emerge in the MEG group analysis.
DISCUSSION
MEG and fMRI represent two fundamentally different approaches to looking at brain activation. MEG measures highly synchronized neural activation with millisecond resolution, whereas fMRI reflects the overall change in energy consumption between two conditions with millimeter precision, integrated over a long time of ongoing processing (especially in block designs). Previous comparisons of electromagnetic and hemodynamic methods in cognitive tasks have emphasized colocalization of rhythmic activity [Meltzer et al. 2008; Singh et al., 2002], particularly in the gamma range (>40 Hz) [Brovelli et al., 2005; Lachaux et al., 2007]. In this study, we focused on the correspondence (or lack of it) between the most frequently used neurophysiological measures, namely wide‐band evoked responses that are time‐locked (and phase‐locked) to stimuli or tasks, and the fMRI BOLD activation. We asked how well the results from the two different methods converged in a complex cognitive task, picture naming, when the experimental design and the subjects were exactly the same. By introducing variations in the task (action/object naming) and the stimuli (action image, object image) we also inquired whether functional differences between conditions emerged in the same way in fMRI and MEG.
The MEG and fMRI data sets yielded a comparable view of naming action and object pictures. At the group level we found, with each method, an extensive bilateral cortical network that was the same in all task conditions. This network included areas in the occipitotemporal, posterior and middle temporal, superior parietal, premotor/precentral and inferior frontal cortex. We found no regions specific to processing verbs or nouns, neither with fMRI, nor with MEG. Based on MEG, the temporal characteristics of the activations were also similar across tasks, with the focus of activity advancing from visual areas in the occipital cortex, via bilateral occipitotemporal, to parietal and further to temporal and frontal cortex. These results are in line with previous fMRI [Murtha et al., 1999; Price et al., 2005; Price et al., 1996] and MEG reports of picture naming [Hultén et al., 2009; Levelt et al., 1998; Salmelin et al., 1994; Sörös et al., 2003; Vihla et al., 2006].
The most conspicuous fMRI BOLD effect between experimental conditions was a weaker activation to naming objects from object‐only images (Obj) than to naming actions or objects from pictures depicting an action (ObjAct, Act) in the frontal, inferior parietal and posterior temporal areas, particularly in the left hemisphere [cf. Liljeström et al., 2008 for the larger group of subjects]. A markedly lower activation to object‐only images from about 200 ms onwards in the left frontal and parietal cortex was also the main finding in MEG both at the sensor level and, with a sharper view, at the source level. In agreement with earlier MEG work [Sörös et al., 2003], naming verbs or nouns from action pictures were not differentiated in cortical activation. The fMRI and MEG views thus yielded the same type of task differentiation, strengthening the view that image category has a stronger influence than naming category on activation in picture naming [Liljeström et al., 2008]. These data imply that the dissociation between verb and noun naming sometimes seen in aphasia may, to some extent, reflect impairments in the way the specific images are processed and not in the word retrieval as such. Although ECD and fMRI analyses agreed on stimulus differentiation in the left parietal and frontal cortex, fMRI group analysis additionally suggested differentiation in the left temporal cortex. Activation of the temporal cortex was evident in the MEG data as well, but it did not show task effects. The cause for this apparent discrepancy remains to be answered by future studies.
Although the same main conclusions could be drawn both from the fMRI and MEG views, they differed in some aspects. The exact locations of activation differed, even in the left parietal and left frontal cortex where both methods showed task effects. The differences in location were more pronounced in individual subjects than in the group‐level data.
fMRI group analysis did not display primary visual activation whereas MEG showed a prominent response both at the group and individual level. A probable explanation is that the visual stimulus was too short lasting, amounting only to 10% of the duration of the task block, to be detected in the fMRI BOLD signal that was integrated over a long time interval.
Frontal activation, particularly in the left hemisphere, was strong and extensive in the fMRI data, and was detected in every subject. It appeared less pronounced in the MEG data, especially in the MNE analysis. Strong frontal activation and stimulus effects in fMRI but not in MEG is a fairly common pattern, e.g., in semantic processing of written words [see Jobard et al., 2003; Salmelin, 2007; Salmelin and Kujala, 2006]. MEG evoked responses reflect the part of the activation that is phase‐locked to the stimulus timing. The fMRI activation, however, may additionally reflect long‐lasting or multiple cognitive processes. In MEG, some of those processes might be captured by event‐related modulations of cortical rhythmic activity, a measure of neural involvement that is less sensitive to small trial‐to‐trial variations in timing than evoked responses [see e.g. Salmelin and Hari, 1994].
Frontal activation may be present in MEG as well but difficult to detect. If the frontal activation has a large spatial extent, as suggested by the fMRI data, one could expect better detection with MNE than (multiple) ECDs. However, as the choice of thresholding is not straightforward in MNE, a spatially extended low‐amplitude activation may remain undetected (among noise) whereas a stronger, more focal source is readily observed. The scattered frontal ECDs probably reflect the fMRI frontal activation fairly correctly, in MEG terms, picking up the strongest source among active patches that are all likely to have fairly similar time courses. It is important to keep in mind that MEG provides an estimate of the center of the active cortical patch but (with typical experimental setups and analysis approaches) little or no information about its shape or extent, and certainly less than fMRI. This general limitation applies to focal (ECD) and distributed (MNE) models alike; the appearance is determined by the specific constraints set to the solution of the inverse problem.
The MNE analysis frequently suggested activation in the insula when ECD and fMRI analyses indicated involvement of areas more dorsally along the premotor cortex. This effect may have resulted from the MNE noise normalization (dSPM) procedure which apparently exaggerated the depth weighting. The left parietal activation, typically pronounced in the ECD and fMRI analysis, tended to be quite weak and scattered in the MNE patterns, or did not agree with the ECD and fMRI source areas. This feature may have derived from considerable spatial variation in the individual maxima.
In conclusion, there was a fair degree of agreement between MEG and fMRI data in this picture naming task, but a number of discrepancies as well, both at the group and individual level. The present analysis emphasizes the importance of multiple factors, both at the neural level and in the analysis methods, when seeking to reconcile results of fMRI and MEG studies on high‐level cognitive functions.
Supporting information
Additional Supporting Information may be found in the online version of this article.
Supplement Figure 1
Acknowledgements
We thank Ms. Johanna Vartiainen for technical advice, and Prof. Matti Hämäläinen for assistance with Freesurfer transformations.
REFERENCES
- Ahlfors SP,Simpson GV ( 2004): Geometrical interpretation of fMRI‐guided MEG/EEG inverse estimates. Neuroimage 22: 323–32. [DOI] [PubMed] [Google Scholar]
- Auranen T,Nummenmaa A,Vanni S,Vehtari A,Hämäläinen MS,Lampinen J,Jääskeläinen IP ( 2009): Automatic fMRI‐guided MEG multidipole localization for visual responses. Hum Brain Mapp 30: 1087–1099. [DOI] [PMC free article] [PubMed] [Google Scholar]
- Billingsley‐Marshall RL,Clear T,Mencl WE,Simos PG,Swank PR,Men D,Sarkari S,Castillo EM,Papanicolaou AC ( 2007): A comparison of functional MRI and magnetoencephalography for receptive language mapping. J Neurosci Methods 161: 306–313. [DOI] [PubMed] [Google Scholar]
- Brovelli A,Lachaux JP,Kahane P,Boussaoud D ( 2005): High gamma frequency oscillatory activity dissociates attention from intention in the human premotor cortex. Neuroimage 28: 154–164. [DOI] [PubMed] [Google Scholar]
- Brunetti M,Belardinelli P,Caulo M,Del Gratta C,Della Penna S,Ferretti A,Lucci G,Moretti A,Pizzella V,Tartaro A,Torquati K,Olivetti Belardinelli M,Romani GL ( 2005): Human brain activation during passive listening to sounds from different locations: An fMRI and MEG study. Hum Brain Mapp 26: 251–261. [DOI] [PMC free article] [PubMed] [Google Scholar]
- Brunetti M,Della Penna S,Ferretti A,Del Gratta C,Cianflone F,Belardinelli P,Caulo M,Pizzella V,Olivetti Belardinelli M,Romani GL ( 2008): A frontoparietal network for spatial attention reorienting in the auditory domain: A human fMRI/MEG study of functional and temporal dynamics. Cereb Cortex 18: 1139–1147. [DOI] [PubMed] [Google Scholar]
- Caramazza A,Hillis AE ( 1991): Lexical organization of nouns and verbs in the brain. Nature 349: 788–790. [DOI] [PubMed] [Google Scholar]
- Croizé AC,Ragot R,Garnero L,Ducorps A,Pelegrini‐Issac M,Dauchot K,Benali H,Burnod Y ( 2004): Dynamics of parietofrontal networks underlying visuospatial short‐term memory encoding. Neuroimage 23: 787–799. [DOI] [PubMed] [Google Scholar]
- Dale AM,Fischl B,Sereno MI ( 1999): Cortical surface‐based analysis. I. Segmentation and surface reconstruction. Neuroimage 9: 179–194. [DOI] [PubMed] [Google Scholar]
- Dale AM,Liu AK,Fischl BR,Buckner RL,Belliveau JW,Lewine JD,Halgren E ( 2000): Dynamic statistical parametric mapping: Combining fMRI and MEG for high‐resolution imaging of cortical activity. Neuron 26: 55–67. [DOI] [PubMed] [Google Scholar]
- Damasio AR,Tranel D ( 1993): Nouns and verbs are retrieved with differently distributed neural systems. Proc Natl Acad Sci USA 90: 4957–4960. [DOI] [PMC free article] [PubMed] [Google Scholar]
- Debener S,Ullsperger M,Siegel M,Fiehler K,von Cramon DY,Engel AK ( 2005): Trial‐by‐trial coupling of concurrent electroencephalogram and functional magnetic resonance imaging identifies the dynamics of performance monitoring. J Neurosci 25: 11730–11737. [DOI] [PMC free article] [PubMed] [Google Scholar]
- Eichele T,Specht K,Moosmann M,Jongsma ML,Quiroga RQ,Nordby H,Hugdahl K ( 2005): Assessing the spatiotemporal evolution of neuronal activation with single‐trial event‐related potentials and functional MRI. Proc Natl Acad Sci USA 102: 17798–17803. [DOI] [PMC free article] [PubMed] [Google Scholar]
- Fischl B,Liu A,Dale AM ( 2001): Automated manifold surgery: Constructing geometrically accurate and topologically correct models of the human cerebral cortex. IEEE Trans Med Imaging 20: 70–80. [DOI] [PubMed] [Google Scholar]
- Fischl B,Sereno MI,Dale AM. ( 1999a): Cortical surface‐based analysis. II. Inflation, flattening, and a surface‐based coordinate system. Neuroimage 9: 195–207. [DOI] [PubMed] [Google Scholar]
- Fischl B,Sereno MI,Tootell RB,Dale AM. ( 1999b): High‐resolution intersubject averaging and a coordinate system for the cortical surface. Hum Brain Mapp 8: 272–284. [DOI] [PMC free article] [PubMed] [Google Scholar]
- Furey ML,Tanskanen T,Beauchamp MS,Avikainen S,Uutela K,Hari R,Haxby JV ( 2006): Dissociation of face‐selective cortical responses by attention. Proc Natl Acad Sci USA 103: 1065–1070. [DOI] [PMC free article] [PubMed] [Google Scholar]
- Genovese CR,Lazar NA,Nichols T ( 2002): Thresholding of statistical maps in functional neuroimaging using the false discovery rate. Neuroimage 15: 870–878. [DOI] [PubMed] [Google Scholar]
- Harley T ( 2001): The Psychology of Language. Hove, UK: Psychology Press. [Google Scholar]
- Helenius P,Salmelin R,Service E,Connolly JF ( 1998): Distinct time courses of word and context comprehension in the left temporal cortex. Brain 121(Part 6): 1133–1142. [DOI] [PubMed] [Google Scholar]
- Hultén A,Vihla M,Laine M,Salmelin R. ( 2009): Accessing newly learned names and meanings in the native language. Hum Brain Mapp 30: 976–989. [DOI] [PMC free article] [PubMed] [Google Scholar]
- Hämäläinen MRH,Ilmoniemi R,Knuutila J,Lounasmaa O ( 1993): Magnetoencephalography—Theory, instrumentation, and applications to noninvasive studies of signal processing in the human brain. Rev Modern Phys 65: 412–497. [Google Scholar]
- Jobard G,Crivello F,Tzourio‐Mazoyer N ( 2003): Evaluation of the dual route theory of reading: A metanalysis of 35 neuroimaging studies. Neuroimage 20: 693–712. [DOI] [PubMed] [Google Scholar]
- Korvenoja A,Huttunen J,Salli E,Pohjonen H,Martinkauppi S,Palva JM,Lauronen L,Virtanen J,Ilmoniemi RJ,Aronen HJ ( 1999): Activation of multiple cortical areas in response to somatosensory stimulation: Combined magnetoencephalographic and functional magnetic resonance imaging. Hum Brain Mapp 8: 13–27. [DOI] [PMC free article] [PubMed] [Google Scholar]
- Lachaux JP,Fonlupt P,Kahane P,Minotti L,Hoffmann D,Bertrand O,Baciu M ( 2007): Relationship between task‐related gamma oscillations and BOLD signal: New insights from combined fMRI and intracranial EEG. Hum Brain Mapp 28: 1368–1375. [DOI] [PMC free article] [PubMed] [Google Scholar]
- Levelt WJ,Praamstra P,Meyer AS,Helenius P,Salmelin R ( 1998): An MEG study of picture naming. J Cogn Neurosci 10: 553–567. [DOI] [PubMed] [Google Scholar]
- Levelt WJ,Roelofs A,Meyer AS ( 1999): A theory of lexical access in speech production. Behav Brain Sci 22: 1–38; discussion 38–75. [DOI] [PubMed] [Google Scholar]
- Liljeström M,Tarkiainen A,Parviainen T,Kujala J,Numminen J,Hiltunen J,Laine M,Salmelin R ( 2008): Perceiving and naming actions and objects. Neuroimage 41: 1132–1141. [DOI] [PubMed] [Google Scholar]
- Lin FH,Belliveau JW,Dale AM,Hämäläinen MS ( 2006): Distributed current estimates using cortical orientation constraints. Hum Brain Mapp 27: 1–13. [DOI] [PMC free article] [PubMed] [Google Scholar]
- Liu AK,Belliveau JW,Dale AM ( 1998): Spatiotemporal imaging of human brain activity using functional MRI constrained magnetoencephalography data: Monte Carlo simulations. Proc Natl Acad Sci USA 95: 8945–8950. [DOI] [PMC free article] [PubMed] [Google Scholar]
- Martin A,Chao LL ( 2001): Semantic memory and the brain: structure and processes. Curr Opin Neurobiol 11: 194–201. [DOI] [PubMed] [Google Scholar]
- McCarthy R,Warrington EK ( 1985): Category specificity in an agrammatic patient: The relative impairment of verb retrieval and comprehension. Neuropsychologia 23: 709–727. [DOI] [PubMed] [Google Scholar]
- Meltzer JA,Zaveri HP,Goncharova II,Distasio MM,Papademetris X,Spencer SS,Spencer DD,Constable RT ( 2008): Effects of working memory load on oscillatory power in human intracranial EEG. Cereb Cortex 18: 1843–1855. [DOI] [PMC free article] [PubMed] [Google Scholar]
- Moradi F,Liu LC,Cheng K,Waggoner RA,Tanaka K,Ioannides AA ( 2003): Consistent and precise localization of brain activity in human primary visual cortex by MEG and fMRI. Neuroimage 18: 595–609. [DOI] [PubMed] [Google Scholar]
- Murtha S,Chertkow H,Beauregard M,Evans A ( 1999): The neural substrate of picture naming. J Cogn Neurosci 11: 399–423. [DOI] [PubMed] [Google Scholar]
- Price CJ,Devlin JT,Moore CJ,Morton C,Laird AR ( 2005): Meta‐analyses of object naming: Effect of baseline. Hum Brain Mapp 25: 70–82. [DOI] [PMC free article] [PubMed] [Google Scholar]
- Price CJ,Moore CJ,Humphreys GW,Frackowiak RS,Friston KJ ( 1996): The neural regions sustaining object recognition and naming. Proc Biol Sci 263: 1501–1507. [DOI] [PubMed] [Google Scholar]
- Salmelin R ( 2007): Clinical neurophysiology of language: The MEG approach. Clin Neurophysiol 118: 237–254. [DOI] [PubMed] [Google Scholar]
- Salmelin R and Hari R ( 1994): Spatiotemporal characteristics of sensorimotor neuromagnetic rhythms related to thumb movement. Neuroscience 60: 537–550. [DOI] [PubMed] [Google Scholar]
- Salmelin R,Hari R,Lounasmaa OV,Sams M ( 1994): Dynamics of brain activation during picture naming. Nature 368: 463–465. [DOI] [PubMed] [Google Scholar]
- Salmelin R,Helenius P,Service E ( 2000): Neurophysiology of fluent and impaired reading: A magnetoencephalographic approach. J Clin Neurophysiol 17: 163–174. [DOI] [PubMed] [Google Scholar]
- Salmelin R,Kujala J ( 2006): Neural representation of language: Activation versus long‐range connectivity. Trends Cogn Sci 10: 519–525. [DOI] [PubMed] [Google Scholar]
- Schormann T,Henn S,Zilles K ( 1996): A new approach to fast elastic alignment with applications to human brains. Lecture Notes Comput Sci 1131: 337–342. [Google Scholar]
- Schulz E,Maurer U,van der Mark S,Bucher K,Brem S,Martin E,Brandeis D ( 2008): Impaired semantic processing during sentence reading in children with dyslexia: Combined fMRI and ERP evidence. Neuroimage 41: 153–168. [DOI] [PubMed] [Google Scholar]
- Shapiro K,Caramazza A ( 2003): The representation of grammatical categories in the brain. Trends Cogn Sci 7: 201–206. [DOI] [PubMed] [Google Scholar]
- Shapiro K,Shelton J,Caramazza A ( 2000): Grammatical class in lexical production and morhpological processing: Evidence from a case of fluent aphasia. Cogn Neuropsychol 17: 665–682. [DOI] [PubMed] [Google Scholar]
- Sharon D,Hämäläinen MS,Tootell RB,Halgren E,Belliveau JW ( 2007): The advantage of combining MEG and EEG: Comparison to fMRI in focally stimulated visual cortex. Neuroimage 36: 1225–1235. [DOI] [PMC free article] [PubMed] [Google Scholar]
- Singh KD,Barnes GR,Hillebrand A,Forde EM,Williams AL ( 2002): Task‐related changes in cortical synchronization are spatially coincident with the hemodynamic response. Neuroimage 16: 103–114. [DOI] [PubMed] [Google Scholar]
- Sörös P,Cornelissen K,Laine M,Salmelin R ( 2003): Naming actions and objects: Cortical dynamics in healthy adults and in an anomic patient with a dissociation in action/object naming. Neuroimage 19: 1787–1801. [DOI] [PubMed] [Google Scholar]
- Tarkiainen A,Helenius P,Hansen PC,Cornelissen PL,Salmelin R ( 1999): Dynamics of letter string perception in the human occipitotemporal cortex. Brain 122(Part 11): 2119–2132. [DOI] [PubMed] [Google Scholar]
- Taulu S,Simola J ( 2006): Spatiotemporal signal space separation method for rejecting nearby interference in MEG measurements. Phys Med Biol 51: 1759–1768. [DOI] [PubMed] [Google Scholar]
- Tzourio‐Mazoyer N,Landeau B,Papathanassiou D,Crivello F,Etard O,Delcroix N,Mazoyer B,Joliot M ( 2002): Automated anatomical labeling of activations in SPM using a macroscopic anatomical parcellation of the MNI MRI single‐subject brain. Neuroimage 15: 273–289. [DOI] [PubMed] [Google Scholar]
- Vihla M,Laine M,Salmelin R ( 2006): Cortical dynamics of visual/semantic vs. phonological analysis in picture confrontation. Neuroimage 33: 732–738. [DOI] [PubMed] [Google Scholar]
- Vitacco D,Brandeis D,Pascual‐Marqui R,Martin E ( 2002): Correspondence of event‐related potential tomography and functional magnetic resonance imaging during language processing. Hum Brain Mapp 17: 4–12. [DOI] [PMC free article] [PubMed] [Google Scholar]
- Woods RP,Grafton ST,Holmes CJ,Cherry SR,Mazziotta JC ( 1998a): Automated image registration. I. General methods and intrasubject, intramodality validation. J Comput Assist Tomogr 22: 139–152. [DOI] [PubMed] [Google Scholar]
- Woods RP,Grafton ST,Watson JD,Sicotte NL,Mazziotta JC ( 1998b): Automated image registration. II. Intersubject validation of linear and nonlinear models. J Comput Assist Tomogr 22: 153–165. [DOI] [PubMed] [Google Scholar]
Associated Data
This section collects any data citations, data availability statements, or supplementary materials included in this article.
Supplementary Materials
Additional Supporting Information may be found in the online version of this article.
Supplement Figure 1