

Abstract
Puberty represents the phase of sexual maturity, signaling the change from childhood into adulthood. During childhood and adolescence, prominent changes take place in the brain. Recently, variation in frontal, temporal, and parietal areas was found to be under varying genetic control between 5 and 19 years of age. However, at the onset of puberty, the extent to which variation in brain structures is influenced by genetic factors (heritability) is not known. Moreover, whether a direct link between human pubertal development and brain structure exists has not been studied. Here, we studied the heritability of brain structures at 9 years of age in 107 monozygotic and dizygotic twin pairs (N = 210 individuals) using volumetric MRI and voxel‐based morphometry. Children showing the first signs of secondary sexual characteristics (N = 47 individuals) were compared with children without these signs, based on Tanner‐stages. High heritabilities of intracranial, total brain, cerebellum, and gray and white matter volumes (up to 91%) were found. Regionally, the posterior fronto‐occipital, corpus callosum, and superior longitudinal fascicles (up to 93%), and the amygdala, superior frontal and middle temporal cortices (up to 83%) were significantly heritable. The onset of secondary sexual characteristics of puberty was associated with decreased frontal and parietal gray matter densities. Thus, in 9‐year‐old children, global brain volumes, white matter density in fronto‐occipital and superior longitudinal fascicles, and gray matter density of (pre‐)frontal and temporal areas are highly heritable. Pubertal development may be directly involved in the decreases in gray matter areas that accompany the transition of our brains from childhood into adulthood. Hum Brain Mapp, 2009. © 2009 Wiley‐Liss, Inc.
Keywords: brain structure, heritability, puberty, twins, voxel‐based morphometry
INTRODUCTION
Puberty is an important period during development. It represents the phase of sexual maturity marking the change from childhood into adulthood [Tanner, 1978]. During puberty, increased availability of sex steroids results in the development of secondary sexual characteristics. The pubertal period partly overlaps with adolescence, but is usually referred to as the period during which behavioral, cognitive, and emotional changes arise as well [Sisk and Zehr, 2005]. During the course of childhood and adolescence, prominent brain changes take place in the proportion of gray and white matter within the cerebrum: region‐specific gray matter decreases have been reported [Giedd et al., 1999; Gogtay et al., 2004; Jernigan et al., 1991; O'Donnell et al., 2005; Sowell et al., 2002, 2004; Thompson et al., 2000; Wilke et al., 2007], as well as white matter increases [Barnea‐Goraly et al., 2005; Giedd et al., 1999; Paus et al., 1999; Thompson et al., 2000]. Especially, around the onset of puberty, global gray matter [Giedd et al., 1999] as well as frontal and parietal gray matter [Giedd et al., 1999; Jernigan et al., 1991] start to decrease.
Knowledge on the etiology of variation in brain structures at the onset of puberty is important for our understanding of both healthy and pathological brain development. Brain areas that are strongly influenced by genes in healthy subjects may allow a more powerful search for candidate genes that are predominantly expressed in these brain regions. This in turn facilitates the interpretation of morphological changes found in neuropsychiatric disorders with an origin in puberty or early adolescence, such as schizophrenia [Andreasen, 1995] and anxiety or mood disorders [Kessler et al., 2005]. Also, puberty is a period during which a child's environment changes from parent‐dependent to more self‐ or peer‐dependent [Steinberg, 2005]. As the developing brain exhibits increased plasticity during this period [Huttenlocher, 1994], it might be hypothesized that the brain is particularly vulnerable to a shift in stimulating or activity‐dependent environmental effects.
To estimate the relative importance of genetic and environmental factors on variation of brain structure, twin studies yield valuable information. They are based on the fact that monozygotic (MZ) twins are (nearly) genetically identical, whereas dizygotic (DZ) twins share on average 50% of their segregating genes [Boomsma et al., 2002]. Both types of twins also share their familial environment. Therefore, if the difference in relatedness between MZ and DZ pairs corresponds with differences in trait resemblance, this gives information on the relative influence of genetic factors on brain volumes [Posthuma and Boomsma, 2000]. Twin studies in adults measuring gray matter density using voxel‐based morphometry and cortical thickness, showed a high heritability (i.e., the proportion of phenotypic variance due to genetic factors) most consistently of frontal and temporal cortices [Hulshoff Pol et al., 2006; Thompson et al., 2001; Wright et al., 2002]. White matter density showed a high heritability in the occipitofrontal fascicles, corpus callosum, optic radiation, and corticospinal tract [Hulshoff Pol et al., 2006]. Recently, in a sample of twins between 5 and 19 years of age, a high heritability of most global brain volumes [Schmitt et al., 2007; Wallace et al., 2006] and a high heritability of frontal, temporal, and parietal cortical thickness was found [Lenroot et al., 2009]. Both studies also demonstrated that heritability of brain structures changed with age.
So far, at the crucial period of maturational transition, i.e., the onset of puberty, the extent to which individual variation in global and regional brain morphology is influenced by genetic and environmental factors remains unknown. Importantly, heritability of regional white matter has never been investigated in children. Besides genetic and environmental influences on brain structure, other (interrelated) factors could be mediating cerebral composition. Recently, it has been reported that the first endocrinological marker of puberty, luteinizing hormone, is associated with white matter increases in early puberty [Peper et al., 2008]. Also, around the onset of puberty overall gray matter starts to decrease [Giedd et al., 1999]. However, a direct link between gray matter structure and pubertal development is currently lacking.
In this article, we address these issues by studying a sample of twins within a very narrow age range (between 9 years and 9 years and 8 months) on the brink of puberty. The aims of this study were to quantify the relative contribution of genetic and environmental influences on individual variation in global and regional brain structure in the specific age group of 9‐year‐old twin pairs. Moreover, we explored possible effects of pubertal development on gray and white matter structure, based on physical examination of secondary sexual characteristics.
MATERIALS AND METHODS
Participants
The cohort consisted of 214 healthy children coming from 107 Dutch twin families. Participants were recruited from the Netherlands Twin Registry [Boomsma et al., 2006; Peper et al., 2008; Van Leeuwen et al., 2008] and included 45 monozygotic (MZ) (23 female and 22 male), 62 dizygotic (DZ) [21 female, 22 male, and 19 opposite sex (DOS)] twin pairs between 9 years, 0 months and 9 years, 8 months old. Four individuals (coming from 4 DZ pairs) were dropped out during the MR scanning, leading to a total number of 210 children who successfully completed the protocol. Exclusion criteria consisted of having a pacemaker, any metal materials in the head, including dental braces, chronic use of medication, any known major medical or psychiatric history, participation in special education or an IQ <70. Physical health and mental health were assessed with a medical history inventory. The sample contained a normal distribution of IQ‐scores [range 70–140, mean 101 (SD 13)], and the percentage right‐handed subject was 84%. Zygosity of the twins was determined based on DNA polymorphisms, using 8–11 highly polymorphic di‐, tri‐ and tetranucleotide genetic markers. Parents and the participants themselves gave written informed consent to participate in the study. The study was approved by the Central Committee on Research involving Human Subjects (CCMO) of the Netherlands and was in agreement with the Declaration of Helsinki (Edinburgh amendments).
Image Acquisition and Processing
Structural magnetic resonance imaging (MRI) scans of the whole brain were made on a 1.5 T Achieva scanner (Philips, Best, The Netherlands).
Volumetric MRI Processing
A three‐dimensional T1‐weighted coronal spoiled‐gradient echo scan of the whole head (256 × 256 matrix, TE = 4.6 ms, TR = 30 ms, flip angle = 30°, 160–180 contiguous slices; 1 × 1 × 1.2 mm3 voxels, field‐of‐view = 256 mm/70%) was acquired. Furthermore, a single‐shot EPI (echo planar imaging) scan was made as part of a diffusion tensor imaging (DTI)‐series (SENSE factor 2.5; flip angle 90°; 60 transverse slices of 2.5 mm; no gap; 128 × 96 acquisition matrix; FOV 240 mm; TE = 78 ms) together with a magnetization transfer imaging (MTI) scan (60 transverse slices of 2.5 mm; no gap;128 × 96 acquisition matrix; FOV 240 mm; flip angle 8°; TE = 4.5 ms; TR = 37.5 ms), which were used for segmentation of the intracranial volume. Our imaging protocol made use of T2‐weighted contrast of the DTI‐B0 and MTI‐series for segmentation of the intracranial volume. The DTI‐B0 and MTI images were superimposed onto the T1‐weighted image to remove non‐brain tissue voxels, as described previously [Peper et al., 2008]. DTI and MTI data are currently being analyzed for white matter tract characteristics.
The scans were coded to ensure blindness for subject and zygosity identification. The T1‐weighted images were automatically put into Talairach orientation [Talairach and Tournoux, 1988] without scaling, by registering them to a model brain in Talairach orientation. The translation and rotation parameters of this registration were then applied to the images [Maes et al., 1997]. After linear registration to the T1‐weighted image, the intracranial segment served as a mask for all further segmentation steps. The T1‐weighted images were corrected for field inhomogeneities using the N3 algorithm [Sled et al., 1998]. Our automatic image processing pipeline was used for segmentation of total brain, gray and white matter of the cerebrum, cerebellum, and lateral ventricle volumes. The software included histogram analysis, mathematical morphology operations, and anatomical knowledge‐based rules to connect all voxels of interest, as was validated before [Schnack et al., 2001a, b]. The intracranial, total brain, ventricles, and cerebellum segments were all visually checked and edited if necessary. Ten brains from the cohort were randomly selected and analyzed by two independent raters to estimate inter‐rater reliability. Intra‐class Correlation Coefficients (ICC) were all above 0.97.
A Kolmogorov‐Smirnov test showed that brain volumes were normally distributed, except for lateral ventricle volumes (P < 0.01). Therefore, lateral ventricle volumes were logarithmically transformed. After transformation and removal of one extreme outlier (>3 SD), lateral ventricles were normally distributed. Because of motion artifacts, separation of gray and white matter tissue was not possible in 14 subjects (6 MZ, 8 DZ). These subjects were included in the analyses of the other volumes, i.e., intracranial volume, total brain, cerebellum, and lateral ventricle volumes. Consequently, the total number of individuals included in global gray and white matter analyses was 195 (84 MZ, 111 DZ), whereas for other global brain volumes, the total number of participants was 209 (90 MZ, 119 DZ).
Voxel‐Based Morphometry
Regional measures of gray and white matter concentration (“density”) were generated using voxel‐based morphometry (VBM) in a similar manner as was done previously [Hulshoff Pol et al., 2006]. VBM involved the following steps. First, a model brain was created on a sample of 298 children aged 9 to 14 (including the 210 children discussed in this report), similar to the method used by Grabner et al. [ 2006]. The use of a model brain specifically created from children's brains ensures an optimal warping from the individual brains to the model. The model brain was created by subsequent linear and nonlinear warpings of the original brains (in Talairach space and corrected for nonuniformity) with ANIMAL [Collins et al., 1995]. For a detailed description of the creation of the model brain, see supporting information.
After the creation of the model brain, in the following step, the binary gray matter (GM) and white matter (WM) masks with voxels of 1 × 1 × 1.2 mm3 were blurred by a 3D Gaussian kernel (FWHM = 8 mm) to gain statistical power. The voxel values of these blurred GM and WM segments (between 0 and 1) reflect the local presence, or density, of GM or WM, respectively. These images are referred to as “density maps.” To compare brain tissue at the same anatomical location in all subjects, the GM and WM segments were transformed into a standardized coordinate system (the model space). These transformations were calculated in two steps. First, the T1‐weighted images were linearly transformed to the model brain. In this linear step, a mutual information metric was optimized [Maes et al., 1997]. In the second step, nonlinear (elastic) transformations were calculated to register the linearly transformed images to the model brain up to a scale of 4 mm (FWHM), thus removing global shape differences between the brains, but retaining local differences. For this step, the program ANIMAL [Collins et al., 1995] was used. The GM and WM density maps were now transformed to the model space by applying the concatenated linear and nonlinear transformations. Finally, the maps were resampled to voxels of size 2 × 2 × 2.4 mm3. Voxels with an average GM density below 0.1 were excluded from the GM density voxel‐based analysis. Similarly, voxels with an average WM density below 0.1 were excluded from the WM density voxel‐based analysis. Heritable white matter voxels were overlaid on probabilistic maps of postmortem white matter fiber‐bundles for identification [Bürgel et al., 2006; Hulshoff Pol et al., 2006]. The total number of individuals included in the VBM analyses was 195 (84 MZ, 111 DZ).
Pubertal Assessment
Secondary sexual characteristics of puberty were physically determined by a trained researcher (no self‐report) using the stages of development devised by Tanner [Marshall and Tanner, 1969, 1970]. The training of the researcher (J.S.P.) consisted of a complete instruction by a medical doctor and practical sessions at the Utrecht University Medical Centre. No intra‐ or inter‐rater reliability statistics are available due to ethical restrictions, i.e., children were not allowed to undress twice and had to be rated by one person only. However, our data on Tanner‐development (i.e., frequency of the first symptoms across the sexes) have probably been reliably measured since they were comparable with earlier studies [Herman‐Giddens et al., 1997, 2001]. The Tanner questionnaire consists of a six‐category measurement of pubic hair in both boys (induced by androgens mainly from the testes) and girls (induced by androgens from both the adrenal gland and the ovaries). In girls, breast development, induced by estrogen secretion from the ovaries, is measured using five different stages ranging from 1 to 5. In boys, penis and testicle size (under androgenic control) are assessed based on scales divided in 6 (ranging from 1 to 6) and 4 (ranging from 1 to 4) stages, respectively. On all these scales, the lowest stage (1) represents prepuberty and the highest stage corresponds to fully matured. As in the current sample of 9‐year‐old children, only Stages 1 and 2 were present, a binary variable “Tanner status” was created from all subscales together: “0” meaning no visible development on any of the scales, and “1” meaning the first signs of development were visible on one or more scales. This variable thus captures both adrenal and gonadal maturation during puberty.
Genetic Analyses
The phenotypic variance for each brain measure was decomposed into additive genetic (A), common environmental (C), and unique environmental variances (E) (with the total variance being equal to A + C + E).The expected covariance between MZ twins is A + C, and the expected covariance between DZ twins is [1/2] A + C, which is based on the fact that MZ twins are genetically identical, whereas DZ twins share on average 50% of their segregating genes. Genetic analyses were carried out with structural equation modeling in Mx [Neale et al., 2003].
All global brain volumes were corrected for the effects of sex and Tanner status with a (linear) regression analysis. Variances and covariances of the residuals from the regression analyses were simultaneously decomposed into A, C, and E components. Equality of variances and mean structures for MZ and DZ twins and for first and second born twins were established before genetic models were fitted to the data.
Model selection among hierarchically nested models was based on likelihood‐ratio tests. The test statistic has a chi‐square (χ2) distribution with degrees of freedom (df) equal to the difference in df between a full and a more constrained model. A full ACE model was compared with an AE‐model (excluding common environmental factors), a CE‐model (excluding additive genetic effects), and an E‐ model (excluding all familial resemblance). The selected model was the model with the fewest parameters that did not fit significantly worse than the more complex model. From the maximum likelihood estimates for parameters under the best model, heritability estimates [proportion of genetic variance over the total variance, i.e., A/(A + C + E)] were calculated. The relative influences of C and E were estimated similarly.
Similar to the analysis of global brain volumes, genetic model‐fitting was carried out in each voxel separately, to obtain A, C, and E estimates for local GM and WM density (as was done previously [Hulshoff Pol et al., 2006]). Even if the role of the shared environment is not statistically significant, calculating heritability estimates from an AE model will upwardly bias the estimates. Therefore, corresponding to the volumetric analysis, all heritability estimates in the VBM analysis were calculated from ACE models. Handedness was added as additional covariate in the voxel‐wise analysis (measured with the Edinburgh Handedness Inventory [Oldfield, 1971]), since handedness can have subtle effects on, for example, asymmetry of the motor cortex [Amunts et al., 2000; Hervé et al., 2006] and sylvian fissure [Witelson and Kigar, 1992]. The critical χ2‐value for P < 0.05 after correction for multiple comparisons was 17.7 for WM density and 20.5 for GM density (df = 1), according to the false discovery rate [Genovese et al., 2002].
Analysis of Pubertal Effects on Brain Measures
A (linear) regression analysis was carried out in Mx to estimate the linear effect of Tanner status on the means of global and regional gray and white matter, correcting for sex and handedness in the voxel‐wise analysis. Likelihood‐ratio χ2‐tests were performed to test for significance.
In addition, in a post hoc analysis it was explored whether the impact of the variance components A, C, and/or E on regional brain density changed with the transition into puberty. To that end, the fit of a model in which variance components A, C, or E were allowed to be different within the prepubertal and pubertal group was tested against a model, in which these variance components were constrained to be equal within both groups [Purcell, 2002].
Analyses were done on the five highest peaks within gray matter that showed a substantial effect of Tanner status and had a heritability higher than 50%.
RESULTS
Mean Brain Volumes and Tanner Status: Influences of Zygosity and Sex
MZ and DZ twins and youngest and oldest member of a twin pair demonstrated similar means and variances of global brain volumes. MZ and DZ twins did not significantly differ in age and Tanner status (Table I). In total, 30 twin pairs were discordant for handedness (28%). This percentage was equally distributed among MZ and DZ twin pairs. According to the Tanner questionnaire, 47 (24%) of the 9‐year‐old twins showed the first signs of secondary sexual characteristics (i.e., Tanner status = 1), including a larger part of females: 32.3% versus 15.6% males (χ2 = 7.5 (df = 1), P = 0.006). Tanner‐stage (0/1) was not significantly correlated with age (r = 0.06, P = 0.89). Furthermore, mean age of children with Tanner status 0 and 1 was 9.21 versus 9.23, respectively (i.e., a difference of 7 days, difference not significant). When females were investigated separately (they obviously showed more pubertal development than males), the age difference between Tanner status 0 and 1 was 11 days (9.22 versus 9.25 years), also not significantly different. Sixty‐two percent of children with Tanner status 1 showed both signs of gonadarche (breast development in girls, genital growth in boys) and adrenarche (pubic hair development in both boys and girls), the remaining 38% had adrenarche development only. These frequencies were equally distributed in boys and girls. Within the MZ twins, 7 pairs were concordant for Tanner status 1 (16%) and 34 pairs for Tanner status 0 (76%). Within the DZ twins, 6 pairs were concordant for Tanner status 1 (11%) and 35 pairs for Tanner status 0 (61%). The rate of discordance for Tanner status in MZ twins was 9% (4 pairs out of 57) versus 28% in DZ twins (16 pairs out of 57). The heritability of Tanner status was estimated at 92%.
Table I.
Demographics and brain volumes of the twin‐sample
| MZM | MZF | DZM | DZF | DOS‐M | DOS‐F | |
|---|---|---|---|---|---|---|
| N (individuals) | 44 | 46 | 43 | 41 | 17 | 19 |
| Age | 9.19 (0.11) | 9.22 (0.11) | 9.19 (0.10) | 9.23 (0.08) | 9.25 (0.17) | 9.25 (0.16) |
| Tanner status 0/1 | 36/8 (81.8/18.2) | 36/10 (78.3/21.7) | 38/5 (88.4/11.6) | 26/15 (63.4/36.6) | 13/4 (76.5/23.5) | 12/7 (63.2/36.8) |
| Hand (R/NR) | 37/7 | 38/8 | 37/6 | 37/4 | 13/4 | 15/4 |
| IQ | 101 (16) | 96 (10) | 101 (13) | 107 (12) | 104 (15) | 103 (10) |
| Height | 139.5 (5.9) | 136.6 (4.3) | 138.7 (5.3) | 138.8 (4.7) | 140.2 (5.2) | 140.6 (5.0) |
| Intracranium | 1539.4 (113.6) | 1368.6 (100.3) | 1559.2 (106.6) | 1399.9 (92.8) | 1526.0 (63.3) | 1422.9 (75.2) |
| Total brain | 1417.6 (94.9) | 1267.8 (96.5) | 1440.9 (96.9) | 1290.1 (82.3) | 1414.8 (55.7) | 1317.2 (66.2) |
| Gray matter | 748.6 (50.2) | 668.7 (53.4) | 758.4 (55.1) | 678.9 (52.2) | 782.6 (36.5) | 718.5 (45.0) |
| White matter | 499.8 (44.7) | 448.9 (45.5) | 509.7 (49.3) | 455.3 (40.9) | 460.5 (25.4) | 440.1 (26.1) |
| Cerebellum | 157.7 (14.9) | 145.7 (10.3) | 164.0 (11.1) | 145.8 (10.8) | 155.1 (15.8) | 148.6 (11.2) |
| Lateral ventricles | 13.0 (12.0) | 7.9 (4.2) | 10.3 (6.3) | 8.1 (4.4) | 9.7 (4.5) | 6.9 (3.2) |
MZM, monozygotic male; MZF, monozygotic female; DZM, dizygotic male; DZF, dizygotic female; DOS‐M, dizygotic opposite sex male; DOS‐F, dizygotic opposite sex female; N, number of individuals; age in mean (SD) years; Tanner status 0 and 1 in absolute numbers (%); Hand, number of right/non‐right handed; IQ, mean full scale IQ (SD) measured with WISC‐III; height in mean (SD) centimeters; brain volumes in mean (SD) milliliters.
Overall, boys had on a average 9% larger total brain volume (1,427 ml, SD 91 ml) as compared with girls (1,285 ml, SD 87 ml) (P < 0.05). Also, gray and white matter, lateral ventricles and cerebellar volumes were significantly larger in boys than in girls (P < 0.01). After correction for intracranial volume, these sex differences in brain volumes were no longer present.
Influences of Genes on Variation in Brain Volumes
Model fitting analyses revealed that an AE model best‐fitted intracranial volume, total brain volume, gray and white matter, cerebellum (Table II). For lateral ventricle volume, specific sources of A or C could not be distinguished, but since the confidence interval (CI) of E did not reach up to 100%, familial influences seem present. The heritability estimates (with 95% CI) were as follows: 91% (56–94%) for intracranial volume, 94% (62–96%) for total brain volume, 77% (40–90%) for gray matter volume, 84% (50–90%) for white matter volume, and 88% (56–97%) for cerebellum volume. The heritability of lateral ventricles was estimated at 35% (0–78%, not significant). It might be argued that additive effects on a logarithmically transformed trait, such as lateral ventricle volume, are associated with multiplicative effects [Khambanonda, 1950; Khoury et al., 1993; Yang et al., 2005]. In other words, the individual effects of genes and environmental factors influencing lateral ventricles might act as the product instead of the sum of the individual effects.
Table II.
Relative proportions of a 2, c 2, and e 2 estimates of global brain volumes (95% confidence intervals)
| Absolute volumes | a 2 | c 2 | e 2 | ACE vs. CE χ2 (df = 1) | P | ACE vs. AE χ2 (df = 1) | P |
|---|---|---|---|---|---|---|---|
| Intracranial volume | 0.91 (0.56–0.94) | 0.00 (0.00–0.04) | 0.09 (0.06–0.14) | 36.3 | <0.001 | 0.00 | 1.000 |
| Total brain | 0.94 (0.62–0.96) | 0.00 (0.00–0.32) | 0.06 (0.04–0.09) | 51.7 | <0.001 | 0.00 | 1.000 |
| Lateral ventriclesa | 0.35 (0.00–0.78) | 0.35 (0.00–0.69) | 0.30 (0.19–0.44) | 2.9 | 0.08 | 2.02 | 0.29 |
| Gray matter | 0.77 (0.40–0.90) | 0.08 (0.00–0.43) | 0.15 (0.09–0.25) | 16.9 | <0.001 | 0.12 | 0.92 |
| White matter | 0.84 (0.50–0.90) | 0.00 (0.00–0.31) | 0.16 (0.10–0.27) | 19.2 | <0.001 | 0.00 | 1.000 |
| Cerebellum | 0.88 (0.56–0.97) | 0.07 (0.00–0.39) | 0.05 (0.03–0.08) | 54.5 | <0.001 | 0.11 | 0.93 |
The 4 right columns display the fit of models with and without an A or without a C component, respectively, using χ2 tests. All model‐fitting analyses were corrected for sex and secondary sexual characteristics (Tanner status). Untransformed lateral ventricle volumes yielded an a 2 of 0.00 (0.00–0.64), c 2 of 0.64 (0.20–0.74), and e 2 of 0.36 (0.25–0.49).
A, additive genetic factors; C, common environmental factors; E, unique environmental factors.
Logarithmically transformed.
To allow a straightforward comparison with other studies [Baaré et al., 2001; Wallace et al., 2006; Wright et al., 2002], nontransformed ventricle volumes were analyzed as well. Consistent with these earlier studies, substantial influences of C (64%) and E (36%) were found for untransformed ventricle volumes, whereas additive genetic effects were estimated at 0%. The influence of common environmental factors on intracranial volume, total brain volume, gray and white matter volumes, and cerebellum volume was not significant.
Influences of Genes on Variation in White and Gray Matter Density
VBM analyses revealed that within regional white matter, genetic effects were significant in areas along the right superior and inferior fronto‐occipital fascicles, superior longitudinal fascicles bilaterally (Fig. 1, Table III), genu of the corpus callosum and left cingulum. Heritability estimates in these areas ranged from 67 to 93%. Regional gray matter density revealed significant additive genetic effects in the left superior frontal gyrus, right middle temporal lobe, and left amygdala (Fig. 2, Table III). Heritability in these areas was estimated between 81 and 83%. Relaxing the FDR value to α = 0.10 or 0.15 did not result in novel significantly heritable brain areas, but resulted in a growth of areas which were already detected as significantly heritable at an FDR value of α = 0.05. When examining the heritability maps, uncorrected for multiple comparisons at P < 0.05 (corresponding to a χ2‐value of 3.84), gray matter density of the middle and inferior frontal gyrus could be included as highly heritable (>70%).
Figure 1.
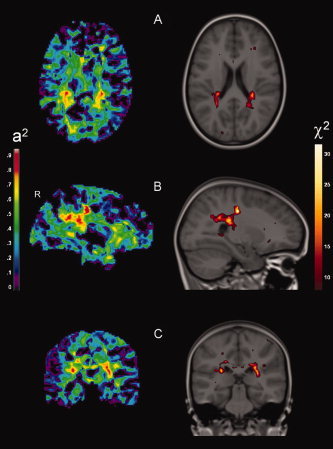
Genetically influenced regional white matter density. (A) Superior occipitofrontal fascicle (Z = 36), (B) superior occipitofrontal fascicle, superior longitudinal fascicle (X = 27), (C) superior longitudinal fascicle (Y = −22). Images are according to neurological convention (left = left). The left side displays heritability estimates. The right side displays significant genetic effects in χ2‐values, overlaid on the model‐brain: CE versus ACE model (critical level of significance is 17.7, corrected for multiple comparisons according to the False Discovery rate, α = 0.05). For visualization purposes, this threshold is relaxed to an FDR rate of α = 0.15 (corresponding to a χ2‐value of 10.5). χ2‐maps are resampled to anatomical resolution for overlap with anatomical boundaries.
Table III.
Significantly heritable regional gray and white matter density with voxel‐based morphometry
| Heritability | χ2 (ACE vs. CE) | # Voxels | Talairach coordinates | |||
|---|---|---|---|---|---|---|
| X | Y | Z | ||||
| Area (Gray matter) | ||||||
| Mid. temporal gyrus (R) | 0.83 | 20.9 | 1 | 55 | 5 | −26 |
| Sup. frontal gyrus (L) | 0.82 | 20.8 | 1 | 1 | 9 | 57 |
| Amygdala (L) | 0.83 | 23.2 | 2 | −13 | −9 | −15 |
| Area (White matter) | ||||||
| Sup. fronto‐occipital fascicle (R) | 0.67 | 19.5 | 1 | 31 | 30 | 20 |
| Sup. fronto‐occipital fascicle (R) | 0.93 | 46.0 | 11 | 27 | −22 | 36 |
| Inf. fronto‐occipital fascicle (R) | 0.82 | 18.4 | 2 | 23 | −77 | 12 |
| Sup. longitudinal fascicle (R) | 0.91 | 29.3 | 6 | 27 | −49 | 27 |
| Sup. longitudinal fascicle (R) | 0.76 | 17.7 | 16 | 26 | −45 | 27 |
| Sup. longitudinal fascicle (L) | 0.88 | 28.7 | 8 | −27 | −32 | 21 |
| Genu corpus callosum (R) | 0.86 | 22.1 | 6 | 13 | 26 | −2 |
| Genu corpus callosum (L) | 0.80 | 17.9 | 1 | −3 | 23 | 11 |
| Posterior cingulum (L) | 0.86 | 26.3 | 8 | −22 | −29 | 36 |
Shown are voxels with the highest χ2‐value within a significant region. Analyses were corrected for sex, handedness, and Tanner status. The critical χ2‐difference between an ACE and a CE model (excluding A) was 20.5 for GM and 17.7 for WM, after correcting for multiple comparisons according to the false discovery rate (α = 0.05). Heritability estimates are drawn from ACE‐models.
Mid., middle; Sup., superior; Inf., inferior; L, left hemisphere; R, right hemisphere; CI, confidence interval; A, additive genetic; C, common environment; E, unique environment; #voxels, number of voxels within a significant cluster.
Figure 2.
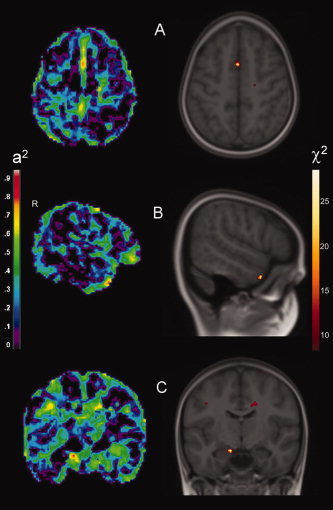
Genetically influenced regional gray matter density. (A) Superior frontal gyrus (Z = 57), (B) middle temporal gyrus (X = 55), (C) amygdala (Y = −9). Images are according to neurological convention (left = left). The left side displays heritability estimates. The right side displays significant genetic effects in χ2‐values, overlaid on the model‐brain: CE versus ACE model (critical level of significance is 20.5, corrected for multiple comparisons according to the False Discovery rate, α = 0.05). For visualization purposes, this threshold is relaxed to an FDR rate of α = 0.15 (corresponding to a χ2‐value of 12.2). χ2‐maps are resampled to anatomical resolution for overlap with anatomical boundaries.
Common environmental effects on gray and white matter density were estimated up to 77%, but failed to reach statistical significance in any region of the brain. By definition, variance in density of the remaining gray and white matter areas was significantly influenced by unique environmental factors and other components within E, such as measurement error. Areas of white matter density with an E‐model as the best‐fitting model were located in the orbitofrontal cortex, anterior cingulate, and (parts of) the cingulum. In addition, regional gray matter areas in which an E‐model fitted best mainly included frontal and temporal areas, with E‐estimates >80%.
Influence of Pubertal Status on Gray and White Matter
Because of the stringent correction for multiple comparisons, Tanner status did not predict gray and white matter density significantly [although χ2‐values ranged up to 19.3 (P < 0.00005 uncorrected)]. When an exploratory χ2‐threshold of 3.84 was adopted (df = 1; P < 0.05 uncorrected), a reduction of (pre)frontal and parietal gray matter density could be observed in children already showing secondary sexual characteristics when compared with children without any secondary pubertal signs (Fig. 3). In addition, an increase in occipital white matter density was seen in the pubertal children. Tanner status did not significantly correlate with global gray or white matter volume. Since only 15.6% of the pubertal group consisted of boys (N = 7), leaving them out of the volumetric and VBM analysis did not substantially affect the results.
Figure 3.
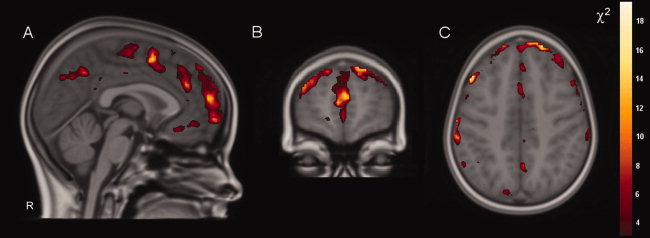
Decreases in (pre)frontal and parietal gray matter density in pubertal children compared with nonpubertal children at 9 years. Shown here are χ2‐values of the worsening in fit of a (means) model with Tanner status versus without Tanner status, corrected for sex and handedness. Level of significance: χ2 > 3.84 (α < 0.05, uncorrected for exploratory purpose). To measure decreases or increases in density, χ2‐maps were multiplied by negative and positive regression maps, respectively. Significant reductions in gray matter density are mainly located in the (pre)frontal cortex [A (X = 2), B (Y = 60), and C (Z = 41)] and parietal cortex (A and C) bilaterally with χ2‐values up to 18.5. Images are according to neurological convention (left = left) χ2‐maps are resampled to anatomical resolution for overlap with anatomical boundaries.
In addition, possible confounding effects of age were explored, by adding age as a covariate. This did not affect the results in the whole sample or in the girls separately (excluding the seven boys with Tanner‐development).
In the post hoc analysis, it was found that with the transition into puberty, total variance in superior‐, middle‐, and medial frontal gray matter density increased significantly (Table IV). A trend toward an increase of both genetic and unique environmental factors was observed; therefore it can be argued that the increase in total variance was not completely due to an increased unique environmental or error variance. However, a significant difference in contribution of genetic and/or environment factors between the prepubertal and pubertal group to gray matter variation could not be demonstrated.
Table IV.
Puberty‐related decreases in gray matter density (ΔGM) with corresponding total variance in prepuberty and puberty of 195 9‐year‐old twins
| Area | ΔGM density | Total variance GM density | Overall heritability | # Voxels | Talairach coordinates | |||||
|---|---|---|---|---|---|---|---|---|---|---|
| Puberty vs. prepuberty | χ2 ΔGM (df = 1) | Prepuberty (× 10−3) | Puberty (× 10−3) | χ2 (df = 3) | X | Y | Z | |||
| Sup. frontal G (R) | −1.9% | 5.63* | 4.87 | 9.82 | 9.65* | 0.56 | 26 | 12 | 27 | 59 |
| Med. frontal G (R) | −4.1% | 13.26** | 2.97 | 7.22 | 16.10** | 0.64 | 32 | 6 | 58 | 12 |
| Sup. frontal G (L) | −4.3% | 9.90** | 5.04 | 9.83 x 10⁻³ | 9.58* | 0.76 | 23 | −2 | 8 | 53 |
| Mid. frontal G (L) | −7.3% | 14.94** | 10.11 | 15.65 x 10⁻³ | 8.90* | 0.63 | 27 | −45 | 21 | 41 |
| Precentral G (R) | −3.9% | 4.26* | 12.36 | 9.54 x 10⁻³ | 1.78 | 0.70 | 13 | 50 | 0 | 49 |
The third column represents the fit of a model when excluding an effect of Tanner status, in this case: whether the GM density decrease with Tanner status 1 versus status 0 is significant. The sixth column represents the fit of a model when excluding all variance components (A, C, and E). Overall heritability estimates are derived from the univariate analyses of the total sample. The heritability of Tanner status was estimated at 92%.
Sup., superior; Med., medial; Mid., middle; G, gyrus; R, right hemisphere; L, left hemisphere; # of voxels = number of voxels within a significant cluster (with χ2 > 3.84).
P < 0.05
P < 0.01.
DISCUSSION
We investigated the influence of genetic and environmental effects on variation in brain structure in 107 9‐year‐old twin pairs. Also, we explored possible effects of pubertal development on cerebral gray and white matter. To our knowledge, this is the first study focusing on the relative influence of genes and environment (in percentages) on regional white matter density in children. Results showed high heritability estimates for global brain volumes, i.e., the intracranium (91%), total brain (94%), gray (77%), and white matter (84%) of the cerebrum and cerebellum (88%). Lateral ventricle volume was moderately heritable (35%). Regionally, gray matter densities within the left amygdala, left superior frontal, and middle temporal gyrus were significantly heritable. Regional white matter densities of the bilateral superior fronto‐occipital fascicle, bilateral superior longitudinal fascicle in posterior parts of the brain, and areas within the cingulum and corpus callosum were found to be significantly heritable, with estimates ranging from 67 to 93%. Our results indicate that the onset of secondary sexual characteristics of puberty is associated with a lower mean and larger variation in frontal and lower mean in parietal gray matter densities. Importantly, these reductions in gray matter density could not be explained by age effects, as all children in our sample were 9 years of age.
We showed that at 9 years of age, when pubertal development was not yet visible in 76% of the children, the main proportion of individual variation in overall brain volume is influenced by genetic factors. Our approach of studying children within a very narrow age‐range allowed an estimation of heritability which is unaffected by age × genotype interactions or age‐dependent gene expression [Plomin et al., 1997]. Our data are in line with heritability estimates of global brain volumes in adults [Baaré et al., 2001; Carmelli et al., 1998; Geschwind et al.. 2002; Pfefferbaum et al., 2000; Posthuma and Boomsma, 2000; Wright et al., 2002] and with a pediatric sample in which a considerable part of the children had already entered adolescence [Wallace et al., 2006]. When the findings of these studies are combined, one might speculate that the genetic factors contributing to overall brain volume remain stable throughout life. This suggestion is also underscored by the fact that total brain volume has reached 95% of its final adult size by the age of 6 years [Giedd et al., 1999].
White matter densities of the bilateral superior fronto‐occipital fascicle, bilateral superior longitudinal fascicle in the posterior part of the brain, and areas within the cingulum and corpus callosum were found to be significantly heritable, with estimates up to 93%. So far, heritability of regional white matter densities in pediatric twins was unknown. The fronto‐occipital fascicle (FOF) and superior longitudinal fascicle (SLF) have been suggested to be involved in visuospatial processing (FOF) and language processing (SLF) [Makris et al., 2005; 2007]. Interestingly, in an earlier study in adult twin pairs, the FOF and parts of the corpus callosum were also found to be highly heritable [Hulshoff Pol et al., 2006]. However, in contrast to this study in adults, we did not observe significant heritability within the corticospinal tract or optic radiation. It is noteworthy that the white matter areas with a high heritability estimate in the 9‐year‐old twins were mostly posteriorly oriented, whereas in the adult twins they extended toward the frontal cortex. Therefore, it may be speculated that the “posterior‐to‐anterior” pattern of heritable brain areas throughout development [Gogtay et al., 2004] can be extended to white matter maturation. Our reported heritable white matter voxels within the superior FOF, SLF, cingulum, and genu of the corpus callosum largely overlapped with the postmortem maps of fiber bundles [Bürgel et al., 2006; Hulshoff Pol et al., 2006], thus supporting that indeed these fiber tracts were involved. However, since no actual fiber‐bundles could be traced on the T1‐weighted brain images, we have to interpret the specific tracts with some caution. The analysis of DTI and MTI‐data of this twin sample is currently in progress.
The heritable gray matter densities in the 9‐year‐old twins were located in the left amygdala, left superior frontal, and middle temporal gyri. The frontal cortex is partly driven by genetic factors in humans was suggested recently in a large pediatric twin sample between 5 and 19 years of age [Lenroot et al., 2009] as well as in adult samples [Hulshoff Pol et al., 2006; Thompson et al., 2001, Wright et al., 2002]. Also in line with our findings are high heritabilities of the (middle) temporal gyrus [Lenroot et al., 2009] and amygdala [Hulshoff Pol et al., 2006]. Furthermore, our findings support data on cortical thickness suggesting that the prefrontal cortex has a lower heritability in younger as compared with older children and becomes more heritable with age [Lenroot et al., 2009].
We also found differences between our study and previous findings across childhood and adolescence. We did not find significant heritabilities for dorsolateral prefrontal cortex, orbitofrontal cortex, angular‐, superior temporal and superior parietal gyri, as reported earlier [Lenroot et al., 2009]. Moreover, there are some differences between our study and findings in adults. We did not observe significant heritabilities for ventrolateral prefrontal‐ and anterior cingulate cortices [Wright et al., 2002], Broca's language area [Thompson et al., 2001], postcentral‐, medial frontal‐, and Heschl's gyri [Hulshoff Pol et al., 2006; Thompson et al., 2001; Wright et al., 2002] and parahippocampal‐, or occipital gyri [Hulshoff Pol et al., 2006].
The differences in findings between our study and previous studies might be due to a number of factors. Differences in age of the samples may have influenced the heritable areas between studies. Our study consisted of 9‐year‐old children, whereas others investigated children and adolescents between 5 and 19 years [Lenroot et al., 2009] and adults with a mean age of 31 years [Hulshoff Pol et al., 2006], 48 years [Thompson et al., 2001], and between 18 and 54 years [Wright et al. 2002].
Furthermore, gray matter density as measured with VBM (our study; Hulshoff Pol et al., 2006] versus cortical thickness measures [Lenroot et al., 2009], cortical brain mapping [Thompson et al., 2001], and linear warping [Wright et al., 2002] might have yielded different heritability estimates. In addition, a correction for multiple comparisons on cortical gray matter only (in cortical thickness measures) allows for a lower statistical threshold than when it is applied on both cortical and subcortical gray matter (as is the case with VBM). A study comparable to our study with respect to the applied VBM‐technique [Hulshoff Pol et al., 2006] reported larger heritable (anterior) gray matter areas than in the 9‐year‐olds. Considering that in (young) adult twins the focal heritable gray matter areas were larger than in the 9‐year‐olds, it seems reasonable to suggest that heritability of (anterior) gray matter brain areas increases with age during puberty, as suggested before [Lenroot et al., 2009].
We found hemispheric asymmetry in significantly heritable gray matter areas, i.e., the left amygdala, left superior frontal gyrus, and right middle temporal gyrus. However, these differences in heritability were gradual as follows: homologous areas within the contralateral hemisphere also showed a substantial heritability (Fig. 2A,C), but did not reach statistical significance. More specifically, the heritability estimates within the homologous contralateral brain areas were 50% (right amygdala), 69% (right superior frontal gyrus), and 55% (left middle temporal gyrus). In line with our findings, a higher heritability was found within the left as compared with the right amygdala in adults [Hulshoff Pol et al., 2006]. The superior frontal gyrus was found to be significantly heritable on the left and right side, both in children and adolescents [Lenroot et al., 2009] as well as in adults [Hulshoff Pol et al., 2006]. However, Thompson et al. [ 2001] demonstrated a significantly heritable left frontal lobe as opposed to the right frontal lobe, which supports our results in 9‐year‐olds. Finally, in contrast to our data, cortical thickness of the left and right middle temporal lobe was reported to be heritable in children and adolescents [Lenroot et al., 2009]. However, this was not found in adults [Hulshoff Pol et al., 2006; Thompson et al., 2001; Wright et al., 2002]. A possible explanation for hemispheric asymmetry in genetically influenced brain areas could be that certain genes are predominantly expressed in one hemisphere. For example, it was reported that the LM04 gene (essential for cortical development in mice) was more highly expressed in the right hemisphere than in the left [Sun et al., 2005].
Besides heritability of gray and white matter, we explored the influence of pubertal stage upon brain structure. This was possible since a quarter of our sample (24%) showed the first secondary sex characteristics of puberty, a number which corresponds to American children rated at 9 years of age [Herman‐Giddens et al., 1997; 2001]. Our results indicate that children who already showed secondary characteristics of puberty as compared with those who did not have decreased gray matter density mainly in (pre‐) frontal and parietal areas. Indeed, in earlier studies, frontal and parietal gray matter decreases have been shown around the onset of puberty (although direct measures of puberty were not reported) [Giedd et al., 1999; Jernigan et al., 1991]. It has been suggested that the decrease of gray matter represents the process of synaptic pruning, i.e., elimination of neuronal connections which are infrequently used [Paus, 2005]. Our results thus provide a first lead that the possible process of pruning in frontal and parietal regions might be initiated by the onset of pubertal characteristics. We tried to shed light on the etiology of these gray matter decreases. We found that with the transition into puberty total variance in (pre‐) frontal gray matter areas increases. This enlarged variance seems to be driven by both genetic and unique environmental factors although a significant contribution of these factors could not be demonstrated. This is possibly due to little variation in pubertal development at this relatively young age. A direct underlying mechanism of secondary sexual development is increased gonadal hormone secretion. Gonadal hormones can alter brain morphological processes [McEwen, 1994] via receptors which are found in various areas of the brain, including the prefrontal cortex [Finley and Kritzer, 1999]. Whether testosterone and estradiol are implicated in frontal and parietal gray matter decreases needs further investigation.
We can merely speculate the genes that might be involved in the heritable brain areas in this critical period of puberty onset. However, the identified areas may aid in the identification of genes related to the (development) of specific brain areas. These candidate genes, given the evidence for abnormal brain development in most (severe) psychiatric disorders, are likely to be involved in the brain pathology of neuropsychiatric disorders with an onset during puberty. A number of studies have been published in which particular genetic polymorphisms, i.e., BDNF [Bueller et al., 2006; Nemoto et al., 2006; Pezawas et al., 2004], DISC1 [Szeszko et al., 2008], COMT [Cerasa et al., 2008], and AKT1 [Tan et al., 2008] are associated with variation in brain structure in the healthy population. It can be argued that certain genes are typically expressed or exert an effect in puberty [Barnett et al., 2007]. However, studies of polymorphisms associated with brain volumes in healthy pubertal children are presently lacking.
There are some limitations on this study. Our study with a sample size of 107 twin pairs has sufficient statistical power (87%) to detect a heritability of global brain volumes of at least 70% (based on a MZ‐correlation of 0.75 and a DZ‐correlation of 0.40). However, within VBM analyses, a correction for multiple comparisons needs to be carried out to minimize false positive results. This strict correction may have prevented areas from reaching significant heritability. Thus, one has to keep in mind that there could be an under‐representation of the actual genetically influenced gray or white matter areas. For example, to detect a heritability of 70% within a gray matter voxel, 317 twin pairs are needed to obtain a power of 80% [based on the corrected P‐value corresponding to a critical χ2‐value (20.5), applying an FDR of 0.05 in our sample]. One could also argue that the areas that we did find to be significantly heritable can be considered highly reliable.
Second, although our results indicate that with the transition into puberty total variance in frontal gray matter areas increases significantly, we were unable to investigate whether genetic and/or environmental factors contribute to this process. Furthermore, at this relatively young age, we could measure first pubertal signs in 24% of the children, leading to an unequal distribution of this variable, thus decreasing power to detect significant Tanner‐related decreases in gray matter. Indeed, to be able to detect a decrease of 10% within density of a single voxel, 1,600 pairs are needed to obtain a statistical power of 80% (α = 0.05, uncorrected). Therefore, our results should be interpreted with caution, i.e., other brain areas that are associated with Tanner development could stay undetected. Larger samples are needed with a more equal distribution of children showing Tanner development versus children without signs of Tanner development.
A third limitation concerns gene–environment interactions. For example, it has been demonstrated that within different environmental conditions, gene expression in the brain is altered [Bhansali et al., 2007; McNair et al., 2007]. Elaborate models testing for gene–environment interactions require larger samples. In addition, other designs are needed to focus on interaction between genes, as a complex phenotype‐like brain structure is unlikely to be influenced by a single‐gene polymorphism. Finally, increased morphological similarities in MZ relative to DZ twins could potentially contribute to increased similarities in gray and white matter density, leading to a higher heritability estimate that is more due to global and not local brain structure characteristics. However, since we nonlinearly registered each individual brain separately to the model brain, it seems unlikely that a bias occurred which behaved differently in MZ and DZ twins other than the similarities that we expected to find attributable to differences in the overlap of their genetic makeup.
CONCLUSIONS
At 9 years of age, global brain volumes are already strikingly heritable. Particularly, individual variation in posterior white matter (posterior parts of the superior longitudinal and superior/inferior fronto‐occipital fascicles) as well as anterior (pre‐) frontal and temporal gray matter areas is primarily influenced by genes. The high heritability of posterior white matter overlaps with findings in adults, suggesting stable heritable brain areas across development. Importantly, our study also provides a first lead that with the emergence of the first secondary pubertal characteristics, prefrontal and parietal gray matter densities decrease. Future studies should focus on longitudinal measurements in twins to reveal possible changing influences of puberty‐related (hormonal) factors, genes, and environment upon the dynamically developing adolescent brain.
Supporting information
Additional Supporting Information may be found in the online version of this article.
Supporting Material
Acknowledgements
The authors thank all the families who participated in the study.
REFERENCES
- Amunts K,Jancke L,Mohlberg H,Steinmetz H,Zilles K ( 2000): Interhemispheric asymmetry of the human motor cortex related to handedness and gender. Neuropsychologia 38: 304–312. [DOI] [PubMed] [Google Scholar]
- Andreasen NC ( 1995): Symptoms, signs, and diagnosis of schizophrenia. Lancet 346: 477–481. [DOI] [PubMed] [Google Scholar]
- Baaré WF,Hulshoff Pol HE,Boomsma DI,Posthuma D,De Geus EJ,Schnack HG,van Haren NE,van Oel CJ,Kahn RS ( 2001): Quantitative genetic modeling of variation in human brain morphology. Cereb Cortex 11: 816–824. [DOI] [PubMed] [Google Scholar]
- Barnea‐Goraly N,Menon V,Eckert M,Tamm L,Bammer R,Karchemskiy A,Dant CC,Reiss AL ( 2005): White matter development during childhood and adolescence: A cross‐sectional diffusion tensor imaging study. Cereb Cortex 15: 1848–1854. [DOI] [PubMed] [Google Scholar]
- Barnett JH,Heron J,Ring SM,Golding J,Goldman D,Xu K,Jones PB ( 2007): Gender‐specific effects of the catechol‐O‐methyltransferase Val108/158Met polymorphism on cognitive function in children. Am J Psychiatry 164: 142–149. [DOI] [PubMed] [Google Scholar]
- Bhansali P,Dunning J,Singer SE,David L,Schmauss C ( 2007): Early life stress alters adult serotonin 2C receptor pre‐mRNA editing and expression of the alpha subunit of the heterotrimeric G‐protein G q. J Neurosci 27: 1467–1473. [DOI] [PMC free article] [PubMed] [Google Scholar]
- Boomsma DI,Busjahn A,Peltonen L ( 2002): The classical twin study and beyond. Nat Rev Genet 3: 872–882. [DOI] [PubMed] [Google Scholar]
- Boomsma DI,de Geus EJC,Vink JM,Stubbe JH,Distel MA,Hottenga JJ,Posthuma D,van Beijsterveldt TCEM,Hudziak JJ,Bartels M,Willemsen G ( 2006): Netherlands Twin Register: From twins to twin families. Twin Res Hum Genet 9: 849–857. [DOI] [PubMed] [Google Scholar]
- Bueller JA,Aftab M,Sen S,Gomez‐Hassan D,Burmeister M,Zubieta JK ( 2006): BDNF Val66Met allele is associated with reduced hippocampal volume in healthy subjects. Biol Psychiatry 59: 812–815. [DOI] [PubMed] [Google Scholar]
- Bürgel U,Amunts K,Hoemke L,Mohlberg H,Gilsbach JM,Zilles K ( 2006): White matter fiber tracts of the human brain: Three‐dimensional mapping at microscopic resolution, topography and intersubject variability. Neuroimage 29: 1092–1105. [DOI] [PubMed] [Google Scholar]
- Carmelli D,DeCarli C,Swan GE,Jack LM,Reed T,Wolf PA,Miller BL ( 1998): Evidence for genetic variance in white matter hyperintensity volume in normal elderly male twins. Stroke 29: 1177–1181. [DOI] [PubMed] [Google Scholar]
- Cerasa A,Gioia MC,Labate A,Liguori M,Lanza P,Quattrone A ( 2008): Impact of catechol‐O‐methyltransferase Val(108/158) Met genotype on hippocampal and prefrontal gray matter volume. Neuroreport 19: 405–408. [DOI] [PubMed] [Google Scholar]
- Collins DL,Holmes CJ,Peters TM,Evans AC ( 1995): Automatic 3‐D model‐based neuroanatomical segmentation. Hum Brain Mapp 4: 190–208. [Google Scholar]
- Finley SK,Kritzer MF ( 1999): Immunoreactivity for intracellular androgen receptors in identified subpopulations of neurons, astrocytes and oligodendrocytes in primate prefrontal cortex. J Neurobiol 40: 446–457. [PubMed] [Google Scholar]
- Genovese CR,Lazar NA,Nichols T ( 2002): Thresholding of statistical maps in functional neuroimaging using the false discovery rate. Neuroimage 15: 870–878. [DOI] [PubMed] [Google Scholar]
- Geschwind DH,Miller BL,DeCarli C,Carmelli D ( 2002): Heritability of lobar brain volumes in twins supports genetic models of cerebral laterality and handedness. Proc Natl Acad Sci USA 99: 3176–3181. [DOI] [PMC free article] [PubMed] [Google Scholar]
- Giedd JN,Blumenthal J,Jeffries NO,Castellanos FX,Liu H,Zijdenbos A,Paus T,Evans AC,Rapoport JL ( 1999): Brain development during childhood and adolescence: A longitudinal MRI study. Nat Neurosci 2: 861–863. [DOI] [PubMed] [Google Scholar]
- Gogtay N,Giedd JN,Lusk L,Hayashi KM,Greenstein D,Vaituzis AC, Nugent TF,III ,Herman DH,Clasen LS,Toga AW,Rapoport JL,Thompson PM ( 2004): Dynamic mapping of human cortical development during childhood through early adulthood. Proc Natl Acad Sci USA 101: 8174–8179. [DOI] [PMC free article] [PubMed] [Google Scholar]
- Grabner G,Janke AL,Budge MM,Smith D,Pruessner J,Collins DL ( 2006): Symmetric atlasting and model based segmentation: An application to the hippocampus in older adults. Med Image Comput Comput Assist Interv Int Conf Med Image Comput Comput Assist Interv 9: 58–66. [DOI] [PubMed] [Google Scholar]
- Herman‐Giddens ME,Slora EJ,Wasserman RC,Bourdony CJ,Bhapkar MV,Koch GG,Hasemeier CM ( 1997): Secondary sexual characteristics and menses in young girls seen in office practice: A study from the Pediatric Research in Office Settings network. Pediatrics 99: 505–512. [DOI] [PubMed] [Google Scholar]
- Herman‐Giddens ME,Wang L,Koch G ( 2001): Secondary sexual characteristics in boys: Estimates from the national health and nutrition examination survey III, 1988–1994. Arch Pediatr Adolesc Med 155: 1022–1028. [DOI] [PubMed] [Google Scholar]
- Hervé PY,Crivello F,Perchey G,Mazoyer B,Tzourio‐Mazoyer N ( 2006): Handedness and cerebral anatomical asymmetries in young adult males. Neuroimage 29: 1066–1079. [DOI] [PubMed] [Google Scholar]
- Hulshoff Pol HE,Schnack HG,Posthuma D,Mandl RC,Baaré WF,van Oel, CJ,van Haren NE,Collins DL,Evans AC,Amunts K,Bürgel U,Zilles K,de GE,Boomsma DI,Kahn RS ( 2006): Genetic contributions to human brain morphology and intelligence. J Neurosci 26: 10235–10242. [DOI] [PMC free article] [PubMed] [Google Scholar]
- Huttenlocher P ( 1994): Synaptogenesis in human cerebral cortex: In: Dawson G,Fischer KW, editors. Human Behavior and the Developing Brain. New York: The Guilford Press; pp 137–152. [Google Scholar]
- Jernigan TL,Trauner DA,Hesselink JR,Tallal PA ( 1991): Maturation of human cerebrum observed in vivo during adolescence. Brain 114 (Part 5): 2037–2049. [DOI] [PubMed] [Google Scholar]
- Kessler RC,Berglund P,Demler O,Jin R,Merikangas KR,Walters EE ( 2005): Lifetime prevalence and age‐of‐onset distributions of DSM‐IV disorders in the National Comorbidity Survey Replication. Arch Gen Psychiatry 62: 593–602. [DOI] [PubMed] [Google Scholar]
- Khambanonda I ( 1950): Quantitative inheritance of fruit size in red pepper (Capsium frutescens L.). Genetics 35: 322–343. [DOI] [PMC free article] [PubMed] [Google Scholar]
- Khoury MJ,Beaty TH,Cohen BH ( 1993): Fundamentals of Genetic Epidemiology. Monographs in Epidemiology and Biostatistics, Vol. 22 New York: Oxford University Press. [Google Scholar]
- Lenroot RK,Schmitt JE,Ordaz SJ,Wallace GL,Neale MC,Lerch JP,Kendler KS,Evans AC,Giedd JN ( 2009): Differences in genetic and environmental influences on the human cerebral cortex associated with development during childhood and adolescence. Hum Brain Mapp 30: 163–174. [DOI] [PMC free article] [PubMed] [Google Scholar]
- Maes F,Collignon A,Vandermeulen D,Marchal G,Suetens P ( 1997): Multimodality image registration by maximization of mutual information. IEEE Trans Med Imaging 16: 187–198. [DOI] [PubMed] [Google Scholar]
- Makris N,Kennedy DN,McInerney S,Sorensen AG,Wang R,Caviness VS Jr,Pandya DN ( 2005): Segmentation of subcomponents within the superior longitudinal fascicle in humans: A quantitative, in vivo, DT‐MRI study. Cereb Cortex 15: 854–869. [DOI] [PubMed] [Google Scholar]
- Makris N,Papadimitriou GM,Sorg S,Kennedy DN,Caviness VS,Pandya DN ( 2007): The occipitofrontal fascicle in humans: A quantitative, in vivo, DT‐MRI study. Neuroimage 37: 1100–1111. [DOI] [PMC free article] [PubMed] [Google Scholar]
- Marshall WA,Tanner JM ( 1969): Variations in pattern of pubertal changes in girls. Arch Dis Child 44: 291–303. [DOI] [PMC free article] [PubMed] [Google Scholar]
- Marshall WA,Tanner JM ( 1970): Variations in the pattern of pubertal changes in boys. Arch Dis Child 45: 13–23. [DOI] [PMC free article] [PubMed] [Google Scholar]
- McEwen BS ( 1994): Steroid hormone actions on the brain: When is the genome involved? Horm Behav 28: 396–405. [DOI] [PubMed] [Google Scholar]
- McNair K,Broad J,Riedel G,Davies CH,Cobb SR ( 2007): Global changes in the hippocampal proteome following exposure to an enriched environment. Neuroscience 145: 413–422. [DOI] [PubMed] [Google Scholar]
- Neale MC,Boker SM,Xie G,Maes HH ( 2003): Mx:Statistical Modeling. Richmond,Virginia: MCV. [Google Scholar]
- Nemoto K,Ohnishi T,Mori T,Moriguchi Y,Hashimoto R,Asada T,Kunugi H ( 2006): The Val66Met polymorphism of the brain‐derived neurotrophic factor gene affects age‐related brain morphology. Neurosci Lett 397: 25–29. [DOI] [PubMed] [Google Scholar]
- O'Donnell S,Noseworthy MD,Levine B,Dennis M ( 2005): Cortical thickness of the frontopolar area in typically developing children and adolescents. Neuroimage 24: 948–954. [DOI] [PubMed] [Google Scholar]
- Oldfield RC ( 1971): The assessment and analysis of handedness: The Edinburgh inventory. Neuropsychologia 9: 97–113. [DOI] [PubMed] [Google Scholar]
- Paus T ( 2005): Mapping brain maturation and cognitive development during adolescence. Trends Cogn Sci 9: 60–68. [DOI] [PubMed] [Google Scholar]
- Paus T,Zijdenbos A,Worsley K,Collins DL,Blumenthal J,Giedd JN,Rapoport JL,Evans AC ( 1999): Structural maturation of neural pathways in children and adolescents: In vivo study. Science 283: 1908–1911. [DOI] [PubMed] [Google Scholar]
- Peper JS,Brouwer RM,Boomsma DI,Kahn RS,Hulshoff Pol HE ( 2007): Genetic influences on human brain structure: A review of brain imaging studies in twins. Hum Brain Mapp 28; 464–473. [DOI] [PMC free article] [PubMed] [Google Scholar]
- Peper JS,Brouwer RM,Schnack HG,van Baal GCM,Van Leeuwen M,van den Berg SM,Delemarre‐Van de Waal HA,Janke AL,Collins DL,Evans AC,Boomsma DI,Kahn RS,Hulshoff Pol HE ( 2008): Cerebral white matter in early puberty is associated with luteinizing hormone concentrations. Psychoneuroendocrinology 33: 909–915. [DOI] [PubMed] [Google Scholar]
- Pezawas L,Verchinski BA,Mattay VS,Callicott JH,Kolachana BS,Straub RE,Egan MF,Meyer‐Lindenberg A,Weinberger DR ( 2004): The brain‐derived neurotrophic factor val66met polymorphism and variation in human cortical morphology. J Neurosci 24: 10099–10102. [DOI] [PMC free article] [PubMed] [Google Scholar]
- Pfefferbaum A,Sullivan EV,Swan GE,Carmelli D ( 2000): Brain structure in men remains highly heritable in the seventh and eighth decades of life. Neurobiol Aging 21: 63–74. [DOI] [PubMed] [Google Scholar]
- Plomin R,Fulker D,Corley R,DeFries J ( 1997): Nature, nurture, and cognitive development from 1 to 16 years: A parent‐offspring adoption study. Psychol Sci 8: 442–447. [Google Scholar]
- Posthuma D,Boomsma DI ( 2000): A note on the statistical power in extended twin designs. Behav Genet 30: 147–158. [DOI] [PubMed] [Google Scholar]
- Purcell S ( 2002): Variance components models for gene‐environment interaction in twin analysis. Twin Res 5: 572–576. [DOI] [PubMed] [Google Scholar]
- Schmitt JE,Wallace GL,Rosenthal MA,Molloy EA,Ordaz S,Lenroot R,Clasen LS,Blumenthal JD,Kendler KS,Neale MC,Giedd JN ( 2007): A multivariate analysis of neuroanatomic relationships in a genetically informative pediatric sample. Neuroimage 35: 70–82. [DOI] [PubMed] [Google Scholar]
- Schnack HG,Hulshoff HE,Baare WF,Viergever MA,Kahn RS ( 2001a): Automatic segmentation of the ventricular system from MR images of the human brain. Neuroimage 14: 95–104. [DOI] [PubMed] [Google Scholar]
- Schnack HG,Hulshoff Pol HE,Baare WF,Staal WG,Viergever MA,Kahn RS ( 2001b): Automated separation of gray and white matter from MR images of the human brain. Neuroimage 13: 230–237. [DOI] [PubMed] [Google Scholar]
- Sisk CL,Zehr JL ( 2005): Pubertal hormones organize the adolescent brain and behavior. Front Neuroendocrinol 26: 163–174. [DOI] [PubMed] [Google Scholar]
- Sled JG,Zijdenbos AP,Evans AC ( 1998): A nonparametric method for automatic correction of intensity nonuniformity in MRI data. IEEE Trans Med Imaging 17: 87–97. [DOI] [PubMed] [Google Scholar]
- Sowell ER,Trauner DA,Gamst A,Jernigan TL ( 2002): Development of cortical and subcortical brain structures in childhood and adolescence: A structural MRI study. Dev Med Child Neurol 44: 4–16. [DOI] [PubMed] [Google Scholar]
- Sowell ER,Thompson PM,Leonard CM,Welcome SE,Kan E,Toga AW ( 2004): Longitudinal mapping of cortical thickness and brain growth in normal children. J Neurosci 24: 8223–8231. [DOI] [PMC free article] [PubMed] [Google Scholar]
- Steinberg L ( 2005): Cognitive and affective development in adolescence. Trends Cogn Sci 9: 69–74. [DOI] [PubMed] [Google Scholar]
- Sun T,Patoine C,bu‐Khalil A,Visvader J,Sum E,Cherry TJ,Orkin SH,Geschwind DH,Walsh CA ( 2005): Early asymmetry of gene transcription in embryonic human left and right cerebral cortex. Science 308: 1794–1798. [DOI] [PMC free article] [PubMed] [Google Scholar]
- Szeszko PR,Hodgkinson CA,Robinson DG,DeRosse P,Bilder RM,Lencz T,Burdick K,Napolitano B,Betensky JD,Kane JM,Goldman G,Malhotra AK ( 2008): DISC1 is associated with prefrontal cortical gray matter and positive symptoms in schizophrenia. Biol Psychol 79: 103–110. [DOI] [PMC free article] [PubMed] [Google Scholar]
- Talairach J,Tournoux P ( 1988): Co‐Planar Stereotaxic Atlas of the Human Brain: 3‐Dimensional Proportional System: An Approach to Cerebral Imaging. New York: Thieme. [Google Scholar]
- Tan HY,Nicodemus KK,Chen Q,Li Z,Brooke JK,Honea R,Kolachana BS,Straub RE,Meyer‐Lindenberg A,Sei Y,Mattay VS,Callicott JH,Weinberger DR ( 2008): Genetic variation in AKT1 is linked to dopamine‐associated prefrontal cortical structure and function in humans. J Clin Invest 118: 2200–2208. [DOI] [PMC free article] [PubMed] [Google Scholar]
- Tanner JM ( 1978): Foetus into Man. Physical Growth from Conception to Maturity. Wells, UK: Open Books Publishing. [Google Scholar]
- Thompson PM,Giedd JN,Woods RP,MacDonald D,Evans AC,Toga AW ( 2000): Growth patterns in the developing brain detected by using continuum mechanical tensor maps. Nature 404: 190–193. [DOI] [PubMed] [Google Scholar]
- Thompson PM,Cannon TD,Narr KL,van ET,Poutanen VP,Huttunen M,Lonnqvist J,Standertskjold‐Nordenstam CG,Kaprio J,Khaledy M,Dail R,Zoumalan CI,Toga AW ( 2001): Genetic influences on brain structure. Nat Neurosci 4: 1253–1258. [DOI] [PubMed] [Google Scholar]
- Van Leeuwen M,Van den Berg SM,Boomsma DI ( 2008): A twin‐family study of general IQ. Learn Indiv Diff 18: 76–88. [Google Scholar]
- Wallace GL,Eric SJ,Lenroot R,Viding E,Ordaz S,Rosenthal MA,Molloy EA,Clasen LS,Kendler KS,Neale MC,Giedd JN ( 2006): A pediatric twin study of brain morphometry. J Child Psychol Psychiatry 47: 987–993. [DOI] [PubMed] [Google Scholar]
- Wilke M,Krageloh‐Mann I,Holland SK ( 2007): Global and local development of gray and white matter volume in normal children and adolescents. Exp Brain Res 178: 296–307. [DOI] [PMC free article] [PubMed] [Google Scholar]
- Witelson SF,Kigar DL ( 1992): Sylvian fissure morphology and asymmetry in men and women: Bilateral differences in relation to handedness in men. J Comp Neurol 323: 326–340. [DOI] [PubMed] [Google Scholar]
- Wright IC,Sham P,Murray RM,Weinberger DR,Bullmore ET ( 2002): Genetic contributions to regional variability in human brain structure: Methods and preliminary results. Neuroimage 17: 256–271. [DOI] [PubMed] [Google Scholar]
- Yang QH,Khoury MJ,Friedman JM,Little J,Flanders WD ( 2005): How many genes underlie the occurrence of common complex diseases in the population? Int J Epidemiol 34: 1129–1137. [DOI] [PubMed] [Google Scholar]
Associated Data
This section collects any data citations, data availability statements, or supplementary materials included in this article.
Supplementary Materials
Additional Supporting Information may be found in the online version of this article.
Supporting Material