

Abstract
Previous functional neuroimaging studies on executive function suggested multiple functionally aberrant cortical regions in patients with Huntington's disease (HD). However, little is known about the neural mechanisms of working memory (WM) function in this patient population. The objective of this study was to investigate the functional neuroanatomy of WM in HD patients. We used event‐related functional magnetic resonance imaging and a parametric verbal WM task to investigate cerebral function during WM performance in 16 healthy control subjects and 12 mild to moderate stage HD patients. We excluded incorrectly performed trials to control for potential accuracy‐related activation confounds. Voxel‐based morphometry (VBM) was used to control for confounding cortical and subcortical atrophy. We found that HD patients were slower and less accurate than healthy controls across all WM load levels. In addition, HD patients showed lower activation in the left dorso‐ and ventrolateral prefrontal cortex, the left inferior parietal cortex, the left putamen, and the right cerebellum at high WM load levels only. VBM revealed gray matter differences in the bilateral caudate nucleus and the thalamus, as well as in inferior parietal and right lateral prefrontal regions. However, volumetric abnormalities in the patient group did not affect the activation differences obtained during WM task performance. These findings demonstrate that WM‐related functional abnormalities in HD patients involve distinct WM network nodes associated with cognitive control and subvocal rehearsal. Moreover, aberrant cortical function in HD patients may occur in brain regions, which are relatively well preserved in terms of brain atrophy. Hum Brain Mapp, 2009. © 2008 Wiley‐Liss, Inc.
Keywords: Huntington's disease, working memory, prefrontal cortex, fMRI, VBM
INTRODUCTION
Huntington's disease (HD) is an autosomal dominant inherited neurodegenerative disorder resulting from a CAG repeat expansion in the huntingtin gene on Chromosome 4. Clinically, HD is characterized by progressive motor dysfunction, psychiatric disturbances, and cognitive dysfunction. Cognitive dysfunction is considered to be an intrinsic feature of HD, varying within the affected cognitive domains over time [Brandt and Butters, 1986; Rosas et al., 2004]. While an impairment of attention, concentration, visuospatial processing, and mnemonic function can be observed during early stages of HD [Butters et al., 1978], HD patients exhibit deficits in executive function on tests requiring planning, problem solving, cognitive flexibility, and the maintenance of a cognitive set at later stages of the disorder [Butters et al., 1978; Lange et al., 1995; Paulsen et al., 1995]. Over time, memory deficits become more evident, including impairments in working memory (WM), as well as declarative and procedural memory. In a meta‐analysis of cognitive dysfunction in HD patients, verbal‐ and visual‐delayed recall have been found to be most impaired in HD, followed by tests involving executive skills, attention, and concentration [Zakzanis, 1998]. However, the neural correlates underlying these deficits are seem to be less clear. Striatal, thalamic, and cortical atrophy are the most common findings in HD patients, and correlations with impaired attention, behavioral inhibition, and WM have been shown by several structural imaging studies [e.g. Aylward et al., 1997; Kassubek et al., 2005]. Alterations in cerebral metabolism and neurotransmission have been found throughout the cerebral cortex, most prominently in the prefrontal cortex [Montoya et al., 2006]. Frontostriatal hypometabolism and [11C]‐raclopride (RAC) binding in HD patients are correlated with cognitive performance on tests involving episodic memory [Kuwert et al., 1990], delayed recognition [Hasselbalch et al., 1992], and executive function [Pavese et al., 2003]. At present however, only a few functional neuroimaging studies have directly tested cognitive functions in HD patients using cognitive activation paradigms. While some studies have been able to demonstrate striatal dysfunction during a variety of tests requiring executive capacity [Clark et al., 2002; Deckel et al., 2000; Voermans et al., 2004], several authors have shown additional functional impairment of cortical regions including the prefrontal cortex [Clark et al., 2002; Thiruvady et al., 2007; Weinberger et al., 1988].
In this study, we chose to investigate the neural correlates underlying WM dysfunction in HD patients. The neuropsychological concept of WM provides a framework for conceptualizing the role of temporary information manipulation and storage in the performance of a wide range of complex cognitive tasks [Baddeley, 2000, 2003]. WM is thought to underlie a variety of cognitive processes in humans by providing an interface between attention, memory, and executive control [Baddeley, 2003; Goldman‐Rakic, 1996]. In healthy control subjects, functional neuroimaging studies have shown that WM subprocesses such as manipulation and maintenance of information are associated with the lateral prefrontal cortex and the striatum [Lewis et al., 2004; Rypma and D'Esposito, 1999; Wolf and Walter, 2005]. In line with the notion that WM processes are subserved by frontoparietal and striatal areas, WM deficits and frontostriatal dysfunction have also been demonstrated in other disorders of the basal ganglia, e.g., Parkinson's disease [PD] [Altgassen et al., 2007; Lewis et al., 2003; Monchi et al., 2000]. In HD, WM dysfunction is present during early stages of the illness [Lemiere et al., 2004] and has been demonstrated in both patients with manifest HD and individuals with the HD gene mutation who are presymptomatic for the motor symptoms of the disorder [pre‐HD individuals] [Lawrence et al., 1996; Montoya et al., 2006; Nehl et al., 2001]. In a sample of pre‐HD individuals, we have recently shown aberrant activation of the dorsolateral prefrontal cortex (DLPFC) during WM performance [Wolf et al., 2007b], demonstrating that DLPFC dysfunction may occur several years before the onset of manifest HD symptoms.
To investigate the functional neuroanatomy underlying WM deficits in HD patients, we used a previously validated parametric verbal WM task known to elicit robust frontostriatal activity [Wolf and Walter, 2005]. An event‐related functional magnetic resonance imaging [fMRI] design [Josephs and Henson, 1999] allowed us to control for the confound of impaired accuracy on the task. Moreover, voxel‐based morphometry [VBM] [Ashburner and Friston, 2000; Good et al., 2001] was used to control for potentially confounding cortical and subcortical atrophy. We also sought to provide additional information about the studied HD population by using a complementary behavioral assessment of other cognitive domains in addition to verbal WM, including attention, inhibition of prepotent responses, and executive function. As demonstrated by previous studies [Lemiere et al., 2004; Snowden et al., 2001; Ward et al., 2006], we predicted behavioral deficits in HD patients during WM and executive performance. On the functional level, we were particularly interested in the circuitry involving the lateral prefrontal cortex, since impaired prefrontal circuitry has been recognized to play a crucial role in the pathophysiology of the cognitive symptoms found in manifest HD [Montoya et al., 2006; Snowden et al., 2001; Zakzanis, 1998]. We hypothesized that WM deficits associated with increasing cognitive processing would be accompanied by underactivity of prefrontal and striatal regions, as it has been previously demonstrated in cognitively impaired early PD patients [Lewis et al., 2003]. Furthermore, since abnormal activation of the DLPFC has been shown to occur before the onset of clinically relevant HD symptoms [Wolf et al., 2007b], we specifically expected to find a dysfunction of this cortical region in manifest HD.
MATERIALS AND METHODS
Subjects
We studied 16 right‐handed [Oldfield, 1971] HD patients with genetically confirmed HD in early clinical Stages I and II according to the classification of Shoulson [Shoulson and Fahn, 1979], recruited from the European Huntington's Disease Network (EHDN) REGISTRY database. Patients with a history of other neurological disorder, learning disabilities or a history of substance abuse were excluded from the study. Depressive symptoms were rated by means of the Beck Depression inventory (BDI). All HD patients were screened for symptoms of manifest HD using the subscales derived from the UHDRS [Huntington Study Group, 1996] and the Total Functional Capacity score (TFC); see Table I for a detailed description of demographics, CAG repeat length, and clinical test scores. The age of onset was assessed as the onset of motor symptoms; this information was obtained through patients' self‐reports and reports from their relatives. The mean interval between the onset of motor symptoms and fMRI was 6.6 ± 3.2 years. At the time of scanning, six HD patients were being treated with various psychotropic drugs including sertraline [n = 3, mean daily dosage, m.d.d., 75 mg], venlafaxine [n = 2, m.d.d. 150 mg], paroxetine [n = 1, m.d.d 20 mg], amitryptiline [n = 1, m.d.d. 75 mg], trimipramine [n = 1, m.d.d. 150 mg], mirtazapine [n = 1, m.d.d. 15 mg], citalopram [n = 1, m.d.d. 40 mg], clozapine [n = 1, m.d.d. 50 mg], and memantine [n = 1, m.d.d. 10 mg]. None of these patients received a stable regime of benzodiazepines. Seven HD patients were not receiving any psychotropic medication at the time of fMRI scanning.
Table I.
Subject demographics, CAG repeat length, and test scores
| Healthy controls (n = 16) | HD patients (n = 12) | |||
|---|---|---|---|---|
| Mean | SD | Mean | SD | |
| Age (years) | 36.3 | 11.4 | 48.4* | 10.4 |
| Education (years) | 15.1 | 3.5 | 14.0 | 3.0 |
| Sex (M/F) | 11/5 | 9/3 | ||
| Duration of illness (years) | 6.6 | 3.2 | ||
| CAG repeat size | n.a. | 44.8 | 3.5 | |
| UHDRS motor score | n.a. | 28.3 | 8.9 | |
| UHDRS behavioral score | n.a. | 4.9 | 7.9 | |
| UHDRS cognitive score | n.a. | 215.9 | 53.7 | |
| Total Functional Capacity score | n.a. | 11.6 | 1.0 | |
| Beck Depression inventory | 1.8 | 4.7 | 7.9* | 6.3 |
n.a. indicates not applicable.
Significant at P <0.05.
Head motion for 14 HD patients was <2 mm translation and <2.5° rotation. Two patients were excluded from the functional data analysis because of head motion >2 mm translation and >2.5° rotation. To minimize cerebral activation effects associated with poor fMRI task performance, two patients who were not accurate above chance level were excluded from the functional data analysis. Thus, MRI data were analyzed from a group of 12 HD patients (three females).
The healthy control group consisted of 16 right‐handed subjects (five females) matched for education and handedness. Control subjects with a neurological or psychiatric disorder and a history of substance abuse or dependence were excluded. Since we additionally investigated pre‐HD individuals in a previous study [Wolf et al., 2007b], the healthy control group and the HD patients were not matched for age to allow further comparisons with the presymptomatic HD sample. Thus, all statistical analyses were covaried for age differences. The project was approved by the local Institutional Review Board. Written informed consent according to the Declaration of Helsinki was obtained from all participants following a complete description of the study.
Cognitive Tasks
Neuropsychological tests
A comprehensive neuropsychological test battery was administered to each subject. The battery consisted of eight tests, which assess alertness, divided attention, verbal and spatial WM, executive function, and inhibition processes.
Tonic and phasic alertness (tAL/pAL), as well as divided attention (DA), were measured using computerized tasks from a standardized test battery [Zimmermann and Fimm, 1994]. During the tAL test, a gray cross was presented at random time intervals on a black screen, prompting the subject to press a button as quickly as possible with the right index finger. During the pAL test, a short auditory signal preceded the appearance of a visually presented stimulus, and subjects were instructed to press a button immediately after the presentation of the visual input (a gray cross, identical to the stimulus presented during the tAL test). The DA test required the simultaneous processing of two concurrent tasks: subjects were instructed to focus on a randomly presented 4 × 4 dot matrix presented on a screen, as well as to alternating, binaurally presented high and low frequency pitches. During this test, targets consisted either of 2 × 2 squares, or of two pitches identical in their frequency, requiring a button press with the right index finger once a target has been identified. Verbal and spatial WM tests included the digit and spatial span tasks. WM maintenance functions were assessed by forward testing, and WM manipulation processes were determined by backward testing (12 verbal and 9 spatial items, respectively, presented at 1 Hz). Executive function was measured using a computerized version of the Wisconsin Card Sorting Test [WCST] [Nelson, 1976]. This WCST variant consisted of 48 cards and a maximum of six categories including five category switches. Inhibition was tested by a computerized version of the Stroop Word‐Color Interference Test [Perlstein et al., 1998] based on randomized single trials (20 trials per color and condition).
FMRI working memory task
The cognitive activation task has been described elsewhere in full detail [Wolf and Walter, 2005; Wolf et al., 2006]. In brief, three capital gray letters appeared on a black screen during the stimulus period. One, two, or three of these letters would then become highlighted at the end of the stimulus period (Fig. 1). Subjects were instructed that, during the subsequent 6,000 ms delay period, they were to focus only on those letters, which had become highlighted, and to memorize the letters, which followed them in the alphabet (manipulated set). Thus, we introduced a manipulation component during the delay period by emphasizing the shifting of memoranda toward other letters of the alphabet. Low manipulation demand was characterized by one letter, which had to be identified as the one that followed next in the alphabet and had to be maintained for a short period of time (load level 1). Intermediate and high manipulation demands were characterized by two and three letters, respectively (load levels 2 and 3). In the probe period, a lower case letter was presented, and subjects had to indicate whether this letter was or was not part of the manipulated set. The control condition displayed three gray Xs and required a stereotype button press in response to the presentation of a lower case x during the probe period, thus forming a motor task without mnemonic requirements.
Figure 1.

fMRI activation paradigm, shown for a trial of load level 2: In the stimulus period, three capital gray letters appeared on a black screen (1,500 ms). One, two, or three of these letters would then become highlighted at the end of the stimulus period (500 ms). Subjects were instructed that, during the subsequent delay period (6,000 ms), they were to focus only on those letters that were highlighted and to memorize the letters that followed them in the alphabet (manipulated set). In the probe period (2,000 ms), a lower case letter was presented, and subjects had to indicate whether this letter was or was not part of the manipulated set. The control condition displayed three gray Xs and required a stereotype button press in response to the presentation of a small x during the probe period. In this example, the probe (t) was part of the manipulated set (starting from the highlighted letters S and G).
Functional Data Acquisition
The functional data were acquired using a 3 T Magnetom ALLEGRA (Siemens, Erlangen, Germany) head MRI system. T2*‐weighted images were obtained using echo‐planar imaging in an axial orientation (TR = 2,400 ms, TE = 35 ms, FoV 192 mm, 64 × 64 matrix, 28 slices, slice thickness 4 mm, gap 1 mm). Stimuli were presented via LCD video goggles (Resonance Technologies, Northridge, CA) and both reaction times and accuracy indices were recorded. Head movement was minimized using padded ear phones. The fMRI protocol was an event‐related design with a pseudorandomized time jitter of 1.5 ± 0.5 TR intertrial interval. Trial duration was 10 s ± 2.4–4.8 s. Stimuli were pseudorandomized and counterbalanced for the relative appearance frequency of each letter per load, highlighted position, and probe letter. The task design avoided the appearance of probes from recent negative trials to prevent proactive interference during retrieval [Jonides et al., 1998]. Subjects performed three sessions in total, each including 28 trials, comprising 164 volumes (492 volumes in total). The first eight volumes of each session were discarded to allow for equilibration effects.
Volumetric MRI Data Acquisition
As we were interested in identifying brain activation differences without the confound of local anatomical changes associated with cortical volume loss, we additionally investigated regional changes in brain volume using VBM [Ashburner and Friston, 2000; Good et al., 2001]. VBM is a user‐independent, automated whole‐brain analysis to detect structural differences between groups of subjects. This method involves voxelwise comparisons of the probability of the presence of gray or white brain matter (described as density or concentration). VBM is an unbiased exploration of the whole brain, and it has been therefore an increasingly useful approach in the analysis of structural images of patients with HD [Kassubek et al., 2005]. As for the functional data, VBM data were acquired using a 3 T Magnetom ALLEGRA (Siemens, Erlangen, Germany) head MRI system. The MRI parameters of the three‐dimensional magnetization‐prepared rapid gradient‐echo (3D‐MPRAGE) sequences used for VBM were as follows: TE = 3.93 ms; TR = 2,080 ms; TI = 1,100 ms; FOV = 256; slice plane = axial; slice thickness = 1 mm; resolution = 1.0 × 1.0 × 1.0; number of slices = 256.
Data Analysis
Behavioral data analysis
Neuropsychological tests.
Performance measures were recorded as follows: (1) Alertness (AL): Mean reaction times (RT in ms) during tonic (tAL, target presentation without alert) and phasic (pAL, target presentation after an alert) alertness; (2) Divided Attention (DA): Mean reaction times (RT in ms) of correctly identified targets and number of omitted targets (DA‐om); (3) Digit Span, Forward and Backward Condition (DS‐f and DS‐b): Number of correctly retrieved items; (4) Spatial Span, Forward and Backward condition (SS‐f and SS‐b): Number of correctly retrieved items; (5) WCST‐P: Number of perseverative errors (WCST‐P), number of completed categories (WCST‐cat), and adjusted switch costs following the procedure by [Spitzer et al., 2001] (WCST‐sc, reported in s); (6) Stroop‐Test: Mean RT of correctly identified targets (Stroop‐RT in ms) and error differences between incongruent and congruent conditions (Stroop‐Err). After covarying for age and sex, a one‐way between‐group analysis of covariance (ANCOVA) was conducted between healthy controls and HD patients (P < 0.05).
FMRI working memory task.
Task accuracy was recorded as percentage of correct responses during target and nontarget trials as well as reaction times (RT) of correctly performed trials. Changes in task accuracy and RT with increasing load were assessed separately using a repeated measures analysis of variance (ANOVA; P < 0.05) with the factors group and load for accuracy and RT, followed by Scheffé's test post‐hoc (P < 0.05). Additionally, we performed planned t‐tests for accuracy and RT for all WM conditions (P < 0.05) between controls and HD patients.
Analysis of functional MRI data
All functional data analyses were performed with SPM2 (Wellcome Department of Cognitive Neurology, London) and MATLAB 7.0 (MathWorks, Natick, MA). The functional images were first subject to slice‐timing, then corrected for motion artifacts and spatially normalized to the SPM2 EPI standard template of 3 × 3 × 3 mm3 voxels. All images were spatially smoothed with a 9‐mm full width at half maximum isotropic Gaussian kernel. Single subject analyses and group comparisons were performed within the framework of the General Linear Model [Friston et al., 1995a] using the “canonical‐hrf” function as a predictor to estimate the hemodynamic response function of each event. For single subject (1st level) analyses, only correct trials were included, i.e., incorrectly performed trials were removed. We modeled stimulus and target periods as one regressor, thus obtaining a lower degree of event correlation relative to the delay period. To test for differential activation during delay, these intervals were modeled as one event occurring at the beginning of the 6,000 ms delay period. Additionally, incorrectly performed trials and the first‐order motion parameters were pooled and used as individual regressors of no interest for each session and subject. The functional images were entered into a fixed effects model for each subject [Friston et al., 1995b] and adjusted for global effects. Low frequency drifts were removed via a highpass filter using low frequency cosine functions with a cutoff of 137 s. High frequency drifts were removed via a Gaussian lowpass filter of 4 s. For each subject, regionally specific main effects of load were calculated for the delay period of each condition (control condition, loadn+1) using linear contrasts.
To account for interindividual variance and to generalize inferences [Holmes and Friston, 1998], we conducted random‐effects analyses on the 2nd level. Activation differences between healthy controls and HD patients during the delay period were assessed by an analysis of variance (ANCOVA) by entering the specific contrasts for the four conditions of each subject [Walter et al., 2007; Wolf et al., 2007a]. A nonspherictiy correction was conducted for all analyses. Since both groups differed from each other with respect to age, we treated these data as a nuisance variable. For within‐group comparisons, we contrasted each of the three load levels [i.e. 1, 2, or 3 manipulated letter(s)] with the control condition. For group‐by‐condition interactions, we calculated the following contrasts: ([load‐control condition]controls > [load‐control condition]HDpatients), ([loadn + 1 − loadn]controls > [loadn + 1 − loadn]HDpatients), and vice versa, using directed t‐tests.
For further characterization of the relative fMRI signal increases with increasing WM load, we extracted mean effect parameters (corresponding to the percent signal change differences relative to the control condition) per subject at the most significantly activated clusters of the prefrontal and subcortical regions of interest emerging from the between group comparisons (Table III). An a priori significance threshold of P < 0.001 (uncorrected at the voxel level, corrected for spatial extent at P < 0.05) was chosen for the main effect of group and all group‐by‐load interactions. We report all anatomical regions and denominations according to the atlases of Talairach and Tournoux [1988] and Duvernoy [1999]. Coordinates are maxima in a given cluster according to the standard MNI‐template.
Table III.
Brain regions showing load‐dependent brain activation differences between healthy control subjects and HD patients during the delay period
| WM load level | Anatomical region | x | y | z | Z |
|---|---|---|---|---|---|
| Load level 2 | Right cerebellum | 27 | −63 | −30 | 4.45 |
| Load level 3 | Left middle frontal gyrus (BA 9) | −30 | 33 | 36 | 4.46 |
| Left inferior frontal gyrus (BA 44) | −51 | 0 | 39 | 4.10 | |
| Right inferior parietal lobule (BA 40) | −51 | −45 | 51 | 3.92 | |
| Left precuneus (BA 7) | −9 | −69 | 48 | 4.42 | |
| Right precuneus (BA 7) | 3 | −53 | 54 | 4.35 | |
| Left superior parietal gyrus (BA 7) | −27 | −50 | 48 | 4.40 | |
| Left putamen | −18 | 9 | −3 | 4.10 | |
| Right cerebellum | 30 | −63 | −33 | 5.42 | |
| Brainstem | 12 | −33 | −48 | 3.82 |
Results of the between‐group ANCOVA, P < 0.001 (uncorrected at the voxel level, P < 0.05 corrected for spatial extent).
x, y, and z are Talairach coordinates of the most significant center of activation within an activated cluster; Z = Z‐value; BA = Brodmann Area.
In order to examine the relationship between clinical correlates with and neural function in HD patients, we conducted exploratory correlation analyses (P < 0.05, uncorrected for multiple comparisons) of CAG repeat length, duration of motor symptoms, and UHDRS subscores with the mean fMRI activation response. A nonparametric analysis was chosen to minimize potential effects of data outliers and of a non‐Gaussian distribution of the data. Spearman correlations were computed using the appropriate clinical variables and the extracted mean effect parameters per subject and WM load at the most significantly activated cluster in the cortical and subcortical regions emerging from the between group comparisons (Figs. 3 and 4).
Figure 3.
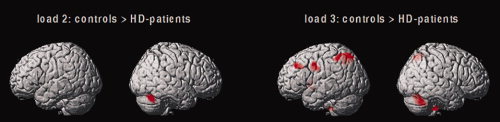
Brain regions in which healthy controls showed relatively more cerebral activation compared with HD patients. Results of the 2nd level between‐group ANCOVA (load‐by‐group contrasts at load levels 2 and 3, voxel level P < 0.001 uncorrected, P < 0.05 corrected for spatial extent).
Figure 4.

Mean activation effects (estimated beta parameters) in the left middle frontal gyrus, the left inferior frontal gyrus, the left inferior parietal cortex, the left putamen, and the right cerebellum. The β parameters were extracted from the between‐group ANCOVA (significant group differences between healthy controls and HD patients; center of local maximum at the most significant voxel; P < 0.001 at the voxel level, P < 0.05 corrected for spatial extent).
Analysis of volumetric MRI data
All VBM data analyses were performed with SPM2 (Wellcome Department of Cognitive Neurology, London) and MATLAB 7.0 (MathWorks, Natick, MA).The images were analyzed using the optimized VBM methods, as previously described in detail by Ashburner and Friston [2000] and Good et al. [2001]. We used the VBM tools written by C. Gaser (http://dbm.neuro.uni-jena.de/vbm). A study‐specific whole brain template was created using the structural images from the healthy control group. In addition, gray/white matter prior images were computed for each participant. Using the customized template and priors, each participant's original image was spatially normalized and segmented into gray and white matter, according to the optimized VBM protocol. The images were resliced with 1.0 × 1.0 × 1.0 mm3 voxels. This procedure yielded modulated and unmodulated types of gray and white matter images. Modulated data were used for the group comparison of voxelwise gray matter volume (GMV) differences, i.e., for comparisons of an absolute amount of tissue type within a region [Ashburner and Friston, 2000]. The resulting GM images were smoothed with a Gaussian kernel of 8 mm full width at half maximum (FWHM), on which all between‐group analyses were performed.
We used volumetric VBM to make the results more comparable with the extant literature. To identify the brain regions of GMV reduction in HD patients relative to the healthy controls, we performed an analysis of covariance (ANCOVA) using SPM2. The global GM volumes and the age of all participants were included as covariates. This analysis yielded statistical parametric maps (SPMs), based on a voxel‐level height threshold of P < 0.001 (familywise error corrected for multiple comparisons). All anatomical regions and denominations are reported according to the atlases of Talairach and Tournoux [1988] and Duvernoy [1999]. Coordinates are maxima in a given cluster according to the standard MNI‐template implemented in SPM2.
RESULTS
Behavioral Results
Neuropsychological results
HD patients performed significantly worse across almost all cognitive tasks including tonic and phasic alertness, divided attention, verbal WM, and spatial WM (both forward and backward maintenance and manipulation). Worse performance during card sorting was characterized by significantly increased perseverative errors and higher switch costs. The lower number of achieved categories in the patient group was not significant at P <0.05. No between‐group differences were found for performance during the Stroop task; see Table II for detailed results of the statistical analysis.
Table II.
Results of the neuropsychological assessment
| Test | Healthy controls (n = 16) | HD patients (n = 12) | Analysis | |||
|---|---|---|---|---|---|---|
| Mean | SD | Mean | SD | Statistic | P‐value | |
| tAL | 220.0 ms | 29.6 | 371.2 ms | 97.7 | F(1, 26) = 31.719 | 0.001 |
| pAL | 215.0 ms | 35.9 | 355.0 ms | 90.4 | F(1, 26) = 32.005 | 0.001 |
| DA | 636.2 ms | 84.4 | 847.5 ms | 145.56 | F(1, 26) = 23.571 | 0.001 |
| DA‐om | 0.7 | 0.9 | 8.3 | 6.1 | F(1, 26) = 24.523 | 0.001 |
| DS‐f | 10.4 | 1.7 | 7.5 | 2.2 | F(1, 26)=17.241 | 0.003 |
| DS‐b | 7.9 | 1.7 | 3.7 | 2.1 | F(1, 26) = 45.188 | 0.001 |
| SS‐f | 8.1 | 1.3 | 5.6 | 1.1 | F(1, 26) = 20.304 | 0.001 |
| SS‐b | 7.2 | 1.4 | 4.3 | 1.4 | F(1, 26) = 31.524 | 0.001 |
| WCST‐P | 0.6 | 1.3 | 3.1 | 3.0 | F(1, 26) = 9.0941 | 0.006 |
| WCST‐cat | 6.0 | 0.0 | 5.4 | 1.1 | F(1, 26) = 4.1115 | 0.053 |
| WCST‐sc | 2.4 s | 2.0 | 5.3 s | 4.0 | F(1, 26) = 6.5043 | 0.017 |
| Stroop‐RT | 97.8 ms | 58.7 | 61.0 ms | 83.2 | F(1, 26) = 1.8928 | 0.181 |
| Strrop‐err | 2.7 | 2.5 | 3.8 | 4.4 | F(1, 26) = 0.6663 | 0.422 |
Between‐group ANCOVA, P < 0.05.
tAL, tonic alertness; pAL, phasic alertness; DA, divided attention; DS‐f, digit span forward; DS‐b, digit span backward; SS‐f, spatial span forward; SS‐b, spatial span backward; WCST‐P, number of perseverative errors; WCST‐sc, switch costs; WCST‐cat, number of achieved categories; Stroop‐RT, Stroop effect, reaction time; Stroop‐Err, Stroop effect, number of errors.
See the “Materials and Methods” section for a detailed description of the cognitive tasks, the statistical analysis, and the levels of significance.
FMRI working memory task
In both groups, we found increasing reaction times (RT) with increasing load [F(3, 78) = 183.59, P = 0.0001]. HD patients were significantly slower than healthy controls [F(1, 26) = 40.207, P = 0.001]. The group by load interaction was not significant [F(3, 78) = 1.0423, P = 0.3787]; post‐hoc t‐tests indicated that HD patients were slower across all WM load conditions as well as during the control condition (P < 0.05); see also Figure 2 for further details.
Figure 2.
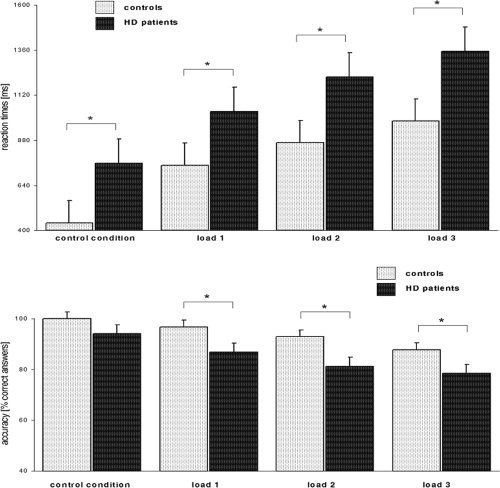
Behavioral performance during the fMRI task. Upper Panel: Average reaction times across all load levels (±standard error), shown for healthy controls and HD patients. Lower Panel: Average accuracy (±standard error) across all load levels. * indicates significant differences at P < 0.05.
We observed a significant linear decline in accuracy with increasing load [F(3, 78) = 15.854, P = 0.0001]. HD patients were significantly less accurate than healthy controls [F(1, 26) = 14.972, P = 0.007]. The group by load interaction was not significant [F(3, 78) = 0.7573, P = 0.5210]; post‐hoc t‐tests indicated that HD patients were less accurate across all WM load conditions (P < 0.05); see also Figure 2 for further details.
Functional Imaging Results
Load effects within groups
Both groups showed a main effect of WM load in a widely distributed cortical and subcortical network including the bilateral DLPFC (Brodmann Area [BA] 9, 46), the ventrolateral prefrontal cortex (VLPFC; BA 44, 45, 47), the left anterior prefrontal cortex (BA 10), the premotor cortex, the supplementary motor area, the bilateral superior and inferior parietal cortex, the bilateral striatum, and the cerebellum. HD patients additionally showed bilateral activation of the thalamus (figures and detailed coordinates are available on request).
Between‐group differences
The 2nd level ANCOVA revealed a significant main effect of group and linearly increasing WM load in the left middle frontal gyrus (BA 9), the left inferior frontal gyrus (BA 44 and 45), the bilateral superior parietal gyrus (BA 7), the left inferior parietal gyrus (BA 40), the left precuneus (BA 7), the anterior cingulate gyrus (BA 32), the left premotor cortex, the left putamen, the bilateral cerebellum, and the brainstem (detailed coordinates available on request).
Group‐by‐load interaction contrasts showed no activation differences between healthy controls and HD patients at load level 1 (L1). At load level 2 (L2), healthy controls showed increased activation of the right cerebellum. At load level 3 (L3), controls showed increased activation of the left middle frontal gyrus (BA 9), the left inferior frontal gyrus (BA 44), the bilateral precuneus (BA 7), the left inferior parietal lobule (BA 40), the left superior parietal gyrus (BA 7), the left putamen, the right cerebellum, and the brainstem (Table III; Fig. 3). As shown by the mean activation size in these regions, both groups exhibited a linear activation relationship with increasing WM load demand in the left inferior parietal lobule (BA 40) and the right cerebellum. HD patients exhibited an activation plateau at high WM load levels in the left inferior frontal gyrus (BA 44) and the left putamen. In the left middle frontal gyrus (BA 9), healthy controls showed a linear activation pattern with increasing WM demand, whereas HD patients exhibited a significantly lower degree of brain activation independent of WM load (Fig. 4). The contrasts [HD patients > controls] did not yield any significant activation differences across all WM load levels.
Correlations With Clinical Measures
A positive correlation was found between activation in the left middle frontal gyrus (BA 9) at load level 3 and CAG repeat length (Spearman's r = 0.58). At load level 3, activation in the left inferior frontal gyrus (BA 44) was positively correlated with the UHDRS motor score (r = 0.64), and negatively correlated with the UHDRS cognitive score (r = −0.62). In addition, a positive correlation between activation in the right cerebellum and clinical measures was found for the UHDRS cognitive score (r = 0.76) and the duration of motor symptoms (r = 0.64) at load level 3; for further details see supplementary data available online. In the right cerebellum, the CAG repeat length was negatively correlated at load level 1 only (r = −0.66).
There were no significant results when correlating the duration of motor symptoms, the UHDRS subscores, and the CAG repeat length with the activation size in the left parietal cortex (BA 40) and the left putamen.
Differences in Gray Matter Volume Between HD Patients and Healthy Controls
Compared to healthy controls, HD patients showed reduced gray matter volume in the right middle frontal gyrus (BA 9 and 9/46), the bilateral inferior parietal lobule (BA 40), the bilateral primary motor cortex, the cingulate gyrus (BA 32), the bilateral caudate nucleus, and the bilateral thalamus (Table IV, Fig. 5). Post‐hoc Shapiro–Wilks W‐tests showed normal distribution of the structural data (P > 0.05). Since the VBM data suggested an anatomical overlap between regions showing both functional and volumetric alterations, we used the differential VBM results to create a volumetric mask, which was further employed for a 2nd analysis of the functional data. Using the 2nd level ANCOVA described in the Analysis of Functional MRI Data section and the volumetric mask, the functional activation differences between HD patients and control subjects were thus restricted to those brain regions unaffected by overt volume alterations. However, after correction for brain atrophy, the functional differences between healthy controls and HD patients remained stable as described above.
Table IV.
Brain regions showing significant gray matter volume differences between healthy control subjects and HD patients
| Anatomical region | x | y | z | Z |
|---|---|---|---|---|
| Right middle frontal gyrus (BA 9/46) | 49 | 32 | 24 | 5.63 |
| Right middle frontal gyrus (BA 9) | 37 | 42 | 33 | 5.62 |
| Right middle frontal gyrus (BA 9) | 46 | 13 | 35 | 5.60 |
| Left inferior parietal lobule (BA 40) | −50 | −41 | 50 | 5.95 |
| Right inferior parietal lobule (BA 40) | 44 | −51 | 54 | 5.63 |
| Right postcentral gyrus | 36 | −40 | 58 | 5.52 |
| Left postcentral gyrus | −40 | −53 | 53 | 5.50 |
| Left precuneus | −4 | −50 | 40 | 5.36 |
| Left cingulate gyrus | 43 | −13 | 8 | 5.29 |
| Left caudate | −9 | 8 | 13 | inf (T17.08) |
| Right caudate | 11 | 11 | 8 | 7.10 |
| Fornix | −3 | 6 | −5 | 6.70 |
| Left thalamus | −1 | −13 | 11 | 6.23 |
| Right thalamus | 2 | −20 | 5 | 5.38 |
Results of the between‐group ANCOVA, P < 0.001 (familywise error corrected at the voxel level, P < 0.05 corrected for spatial extent).
x, y, and z are the Talairach coordinates of the most significant center of volume reduction within cluster; Z = Z‐value; BA = Brodmann Area.
Figure 5.

Gray matter volume reductions in HD patients displayed on the glass brain implemented in SPM2, maximum‐intensity‐projected (MIP) regions; results of the ANCOVA, P < 0.001 (familywise error corrected for multiple comparisons).
DISCUSSION
In this study, we investigated verbal WM function in HD patients using event‐related fMRI. Along with significantly impaired task performance (both RT and accuracy), HD patients exhibited significantly lower task‐related activation in the left dorsolateral prefrontal cortex (DLPFC, BA 9), the left inferior frontal gyrus (BA 44), the bilateral parietal cortex, and the putamen with increasing WM load. In line with previous VBM findings in early stages of HD [Kassubek et al., 2005], HD patients showed reduced gray matter volume in the right middle frontal gyrus (BA 9 and 9/46), the inferior parietal lobule (BA 40), the bilateral primary motor cortex, the cingulate gyrus (BA 32), the bilateral caudate nucleus, and the bilateral thalamus, compared to healthy controls. However, the cortical volume loss did not sufficiently explain the regions of hypoactivation found in HD patients relative to healthy controls during WM performance.
Cognitive dysfunction is considered to be intrinsic to HD, and there is abundant neuropsychological evidence for WM and executive deficits in HD patients both during early and late stages of the disorder [Butters et al., 1978; Lange et al., 1995; Paulsen et al., 1995]. In accordance with previous studies on cognitive dysfunction in HD [Zakzanis, 1998], the behavioral data provided by this study is indicative of demonstrated a widespread deficit in a variety of cognitive domains including alertness, divided attention, verbal and spatial WM, and executive function. Consistent with this neuropsychological deficit pattern, HD patients showed marked behavioral impairment during the fMRI task increasing by load level, indicating a load‐dependent deficit during verbal WM manipulation and delayed recall.
Performance differences during the fMRI task were associated with lower cerebral activation in the patient group compared with healthy participants. The prefrontal and parietal activation differences found in this study are in accordance with early neurocognitive activation studies in HD patients using positron emission tomography (PET) and single‐photon emission computed tomography (SPECT). In HD patients, several authors have shown functional abnormalities of frontoparietal regions in addition to subcortical areas [Deckel et al., 2000; Goldberg et al., 1990], although yielding some conflicting results with regard to prefrontal cortex function [Weinberger et al., 1988]. Only a few studies so far have used fMRI to investigate cerebral activation in HD patients during cognitive performance. However, currently available fMRI findings considerably differ across studies, showing activation decreases in the occipital and parietal cortex [Clark et al., 2002], as well as both increased [Clark et al., 2002] and decreased activation in the bilateral middle frontal gyrus [Kim et al., 2004] during a variety of cognitive activation tasks. Methodological limitations such as the use of different cognitive tasks, blocked fMRI paradigms, and the lack of an adequate control of differences in cognitive performance may partly account for the heterogeneity of previous findings.
In this HD patient sample, hypoactivation of left lateralized dorso‐ and ventrolateral prefrontal and parietal areas, as well as hypoactivation in the left putamen and the right cerebellum, was found at high WM load levels. In healthy controls, these regions are part of a neural network, which is thought to subserve manipulation during WM as well as covert subvocal rehearsal [Baddeley, 2003; D'Esposito et al., 2000]. The load‐dependent patterns which were found in these cortical and subcortical areas suggest a linear relationship between WM demand and activation in patients, similar to the activation pattern found in controls subjects. However, HD patients showed a nonlinear relationship in the left DLPFC only, indicating that this prefrontal area might have been consistently underactivated across all WM load levels. Apart from its role in the central executive subcomponent of WM [Baddeley, 2003], the DLPFC has been implicated in mediating cognitive and behavioral control as well as in sustaining supraspan memory capacity [Rypma et al., 2002]. Thus, hypoactivation of the left DLPFC in HD patients might reflect a fundamental functional deficit associated with cognitive and behavioral deficits found in early stages of HD [Butters et al., 1978]. Of note, lower activation of the left DLPFC during WM performance was found in virtually the same prefrontal region (BA 9) in cognitively intact pre‐HD individuals [Wolf et al., 2007b], suggesting that impaired function of the lateral prefrontal cortex might increasingly have an impact on manifest executive and WM dysfunction in early and advanced stages of the illness. However, the decreased activation of dorso‐ and ventrolateral regions in HD patients does not necessarily imply an intrinsic cortical pathology of prefrontal areas, since the lateral prefrontal cortex is interconnected with ventrolateral prefrontal, temporolimbic, striatal, and thalamic regions [Alexander et al., 1986]. Moreover, recent fMRI research suggests that poor cognitive performance in HD patients is associated with a loss of interhemispheric connectivity between lateral prefrontal and cingulate regions rather than by activation differences in circumscribed cortical areas [Thiruvady et al., 2007]. Thus, aberrant prefrontal activation in HD patients might alternatively reflect a functional impairment of prefrontostriatal circuits due to anatomical changes in subcortical regions and their corresponding tracts, or due to changes in functional connectivity [Voermans et al., 2004]. This hypothesis was not directly tested in this study, and it needs further direct investigation, e.g. by diffusion‐tensor‐imaging [Rosas et al., 2006] or functional connectivity methods [Thiruvady et al., 2007].
In addition to cortical activation differences, we found hypoactivation of the right cerebellum during both intermediate and high levels of WM processing. This is particularly surprising, since in HD patients, cerebellar dysfunction related to cognitive performance has not been reported so far. However, recent morphometric findings in HD patients suggest that the cerebellum is affected over time [Ruocco et al., 2007], and thus could already be involved in the cognitive clinical manifestations of the disorder in an early stage. Apart from its contribution to motor coordination and control, there is increasing neuropsychological and functional imaging evidence that the cerebellum is involved in human cognition [Ben‐Yehudah et al., 2007; Fiez, 1996]. Specifically, an emphasis has been placed on cerebellar contributions to articulatory rehearsal processes subserving verbal WM function [Ben‐Yehudah et al., 2007]. In HD patients, this mechanism might become increasingly relevant when verbal information tends to accumulate, i.e. during intermediate and high WM load levels, and thus may reflect a dysfunction of the phonological loop [Baddeley, 2003] rather than an executive deficit. However, the precise role of the cerebellum in HD and its contribution to the cognitive symptoms of the disorder are yet unclear and warrant further investigation.
We did not find direct evidence for a functional impairment of the caudate nucleus in HD patients compared with healthy subjects. Although gray matter changes were most obvious in the bilateral caudate, both groups did not differ with regard to activation of this region, in accordance with previous fMRI findings in early HD [Kim et al., 2004]. Although hypoperfusion, reductions in striatal neurotransmission, and decreased glucose utilization in the striatum are the most common PET and SPECT findings in HD [Montoya et al., 2006; Rosas et al., 2004], reduced activation of the striatum during fMRI has not been consistently replicated [Kim et al., 2004]. This might be due to an increased variability in caudate volume and activation extent, as shown for both HD patients and clinically unaffected carriers of the HD gene mutation (pre‐HD subjects) [Kim et al., 2004; Paulsen et al., 2004]. The variability in findings may also be accounted for by compensatory striatal activation in response to volumetric abnormalities. In conjunction, the functional and the volumetric data suggest that despite striatal atrophy, striatal activation in HD patients might not necessarily be altered during fMRI.
Since currently available data on correlations between clinical and cognitive measures and activation differences in HD are sparse [but see Feigin et al., 2006], the correlational pattern in prefrontal cortical regions merits further discussion. In HD patients, CAG repeat length and cerebral activation in the left DLPFC were found to be positively correlated at load level 3 only. With regard to cognitive measures, activation in the left inferior frontal gyrus (BA 44) was negatively correlated with the UHDRS cognitive score at load level 3. At first glance, these results may appear to be contradictory to the notion of increased cortical activation in clinically less affected patients. However, these preliminary correlations provide an indirect evidence for potential compensatory mechanisms in patients who are clinically affected to a greater extent. The hypothesis of a compensatory neural mechanism in HD has been suggested previously considering data derived from pre‐HD subjects individuals who were found to exhibit a negative correlation between regional cerebral blood flow and cognitive performance [Feigin et al., 2006]. With regard to this study, we hypothesize speculate that the more poorly the HD patients perform on the UHDRS cognitive subscore, the more their prefrontal cortex attempts to compensate for this deficit, albeit with only partial success. However, although this notion receives further support from the positive correlation between UHDRS motor score and activation in the left inferior frontal gyrus, the correlational evidence provided by this study is limited by the current sample size and has to be regarded as preliminary.
One potential limitation of this study is that HD patients and healthy controls were not matched with respect to age. Since we separately studied two HD populations (patients and pre‐HD subjects), we sought to use one single healthy control group to homogenize between‐group comparisons. The potential disadvantage of comparisons not matched for age was minimized by (1) covarying for age in all between‐group analyses and (2) by reanalyzing the HD data using a subgroup of healthy controls [n = 10 (4f, 6m), age = 43.0 ± 6.9 years, P = 0.23]. The latter analyses confirmed the main neuropsychological as well as the volumetric and functional findings, as described and discussed above. It could also be generally argued that functional activation differences in patients with neuropsychiatric disorders may merely reflect an artifact of impaired task performance at high WM load levels [Weinberger and Berman, 1996]. However, this objection does not hold for the event‐related design which was used in this study, since our functional analysis excluded incorrectly performed trials. Moreover, the activation differences between HD patients and controls remained stable when the 2nd level between‐group ANCOVA was recalculated using both accuracy and RT as nuisance variables, suggesting that poor motor performance did not overtly affect WM‐related activation differences in the patient group. Thus, the functional results can be interpreted as related to the disease and cannot be simply explained as an epiphenomenon of impaired cognitive performance, since similar between‐group comparison conditions were provided.
In conclusion, we have shown that poor cognitive performance during a verbal WM task is associated with hypoactivation of several cortical and subcortical structures in cognitively impaired patients with HD. These activation differences are not directly affected by manifest cortical gray matter changes and reflect suggest a dysfunction of cortico‐subcortical networks, or both in early stages of HD. Disrupted WM‐related circuitry and impaired function of the DLPFC provide a functional framework for might account for the manifest cognitive and behavioral deficits, which are inherent to HD in later stages of the illness.
Supporting information
Additional Supporting Information may be found in the online version of this article.
Supporting Information Figure 6
Acknowledgements
This study was supported by the European Huntington's Disease Network (EHDN).
The authors would like to thank Timothy Laumann, Genes, Cognition and Psychosis Program, NIMH, Bethesda, for insightful comments on a previous version of this manuscript. We are grateful to Beate Englet and Sebastian Satzinger for their assistance with data collection.
REFERENCES
- Alexander G,Delong M,Strick P ( 1986): Parallel organization of functionally segregated circuits linking basal ganglia and cortex. Annu Rev Neurosci 9: 357–381. [DOI] [PubMed] [Google Scholar]
- Altgassen M,Phillips L,Kopp U,Kliegel M ( 2007): Role of working memory components in planning performance of individuals with Parkinson's disease. Neuropsychologia 45: 2393–2397. [DOI] [PubMed] [Google Scholar]
- Ashburner J,Friston KJ ( 2000): Voxel‐based morphometry—The methods. NeuroImage 11: 805–821. [DOI] [PubMed] [Google Scholar]
- Aylward EH,Li Q,Stine OC,Ranen N,Sherr M,Barta PE,Bylsma FW,Pearlson GD,Ross CA ( 1997): Longitudinal change in basal ganglia volume in patients with Huntington's disease. Neurology 48: 394–399. [DOI] [PubMed] [Google Scholar]
- Baddeley A ( 2000): The episodic buffer: A new component of working memory? Trends Cogn Sci 4: 417–423. [DOI] [PubMed] [Google Scholar]
- Baddeley A ( 2003): Working memory: Looking back and looking forward. Nat Rev Neurosci 4: 829–839. [DOI] [PubMed] [Google Scholar]
- Ben‐Yehudah G,Guediche S,Fiez JA ( 2007): Cerebellar contributions to verbal working memory: Beyond cognitive theory. Cerebellum 6: 193–201. [DOI] [PubMed] [Google Scholar]
- Brandt J,Butters N ( 1986): The neuropsychology of Huntington's disease. Trends Neurosci 9: 118–220. [Google Scholar]
- Butters N,Sax D,Montgomery K,Tarlow S ( 1978): Comparison of the neuropsychological deficits associated with early and advanced Huntington's disease. Arch Neurol 35: 585–589. [DOI] [PubMed] [Google Scholar]
- Clark VP,Lai S,Deckel AW ( 2002): Altered functional MRI responses in Huntington's disease. Neuroreport 13: 703–706. [DOI] [PubMed] [Google Scholar]
- Deckel AW,Weiner R,Szigeti D,Clark V,Vento J ( 2000): Altered patterns of regional cerebral blood flow in patients with Huntington's disease: A SPECT study during rest and cognitive or motor activation. J Nucl Med 41: 773–780. [PubMed] [Google Scholar]
- D'Esposito M,Postle BR,Rypma B ( 2000): Prefrontal cortical contributions to working memory: Evidence from event‐related fMRI studies. Exp Brain Res 133: 3–11. [DOI] [PubMed] [Google Scholar]
- Duvernoy HM ( 1999): The Human Brain. Wien, New York: Springer. [Google Scholar]
- Feigin AS,Ghilardi MF,Huang C,Yilong M,Carbon M,Guttman M,Paulsen JS,Ghez CP,Eidelberg D ( 2006): Preclinical Huntington's disease: Compensatory brain responses during learning. Ann Neurol 59: 53–59. [DOI] [PMC free article] [PubMed] [Google Scholar]
- Fiez J ( 1996): Cerebella contributions to cognition. Neuron 16: 13–15. [DOI] [PubMed] [Google Scholar]
- Friston KJ,Holmes A,Worsley KJ,Poline JB,Frith CD,Frackowiak RSJ ( 1995a): Statistical parametric maps in functional imaging: A general linear approach. Hum Brain Mapp 2: 189–210. [Google Scholar]
- Friston KJ,Holmes AP,Poline JB,Grasby PJ,Williams SC,Frackowiak RS,Turner R ( 1995b): Analysis of fMRI time‐series revisited. Neuroimage 2: 45–53. [DOI] [PubMed] [Google Scholar]
- Goldberg TE,Berman KF,Mohr E,Weinberger DR ( 1990): Regional cerebral blood flow and cognitive function in Huntington's disease and schizophrenia. A comparison of patients matched for performance on a prefrontal‐type task. Arch Neurol 47: 418–422. [DOI] [PubMed] [Google Scholar]
- Goldman‐Rakic PS ( 1996): The prefrontal landscape: Implications of functional architecture for understanding human mentation and the central executive. Philos Trans R Soc Lond B Biol Sci 351: 1445–1453. [DOI] [PubMed] [Google Scholar]
- Good CD,Johnsrude IS,Ashburner J,Henson RN,Friston KJ,Frackowiak RS ( 2001): A voxel‐based morphometric study of ageing in 465 normal adult human brains. NeuroImage 14: 21–36. [DOI] [PubMed] [Google Scholar]
- Hasselbalch SG,Oberg G,Sorensen SA,Andersen AR,Waldemar G,Schmidt JF,Fenger K,Paulson OB ( 1992): Reduced regional cerebral blood flow in Huntington's disease studied by SPECT. J Neurol Neurosurg Psychiatry 55: 1018–1023. [DOI] [PMC free article] [PubMed] [Google Scholar]
- Holmes AP,Friston KJ ( 1998): Generalisability, random effects and population inference. NeuroImage 4: 754. [Google Scholar]
- Huntington‐Study‐Group ( 1996): Unified Huntington's Disease Rating Scale: Reliability and consistency. Mov Disord 11: 136–142. [DOI] [PubMed] [Google Scholar]
- Jonides J,Smith EE,Marshuetz C,Koeppe RA,Reuter‐Lorenz PA ( 1998): Inhibition in verbal working memory revealed by brain activation. Proc Natl Acad Sci USA 95: 8410–8413. [DOI] [PMC free article] [PubMed] [Google Scholar]
- Josephs O,Henson RN ( 1999): Event‐related functional magnetic resonance imaging: Modelling, inference and optimization. Philos Trans R Soc Lond B Biol Sci 354: 1215–1228. [DOI] [PMC free article] [PubMed] [Google Scholar]
- Kassubek J,Juengling FD,Ecker D,Landwehrmeyer GB ( 2005): Thalamic atrophy in Huntington's disease co‐varies with cognitive performance: A morphometric MRI analysis. Cereb Cortex 15: 846–853. [DOI] [PubMed] [Google Scholar]
- Kim JS,Reading SA,Brashers‐Krug T,Calhoun VD,Ross CA,Pearlson GD ( 2004): Functional MRI study of a serial reaction time task in Huntington's disease. Psychiatry Res 131: 23–30. [DOI] [PubMed] [Google Scholar]
- Kuwert T,Lange HW,Langen KJ,Herzog H,Aulich A,Feinendegen LE ( 1990): Cortical and subcortical glucose consumption measured by PET in patients with Huntington's disease. Brain 113 (Part 5): 1405–1423. [DOI] [PubMed] [Google Scholar]
- Lange KW,Sahakian BJ,Quinn NP,Marsden CD,Robbins TW ( 1995): Comparison of executive and visuospatial memory function in Huntington's disease and dementia of Alzheimer type matched for degree of dementia. J Neurol Neurosurg Psychiatry 58: 598–606. [DOI] [PMC free article] [PubMed] [Google Scholar]
- Lawrence AD,Sahakian BJ,Hodges JR,Rosser AE,Lange KW,Robbins TW ( 1996): Executive and mnemonic functions in early Huntington's disease. Brain 119 (Part 5): 1633–1645. [DOI] [PubMed] [Google Scholar]
- Lemiere J,Decruyenaere M,Evers‐Kiebooms G,Vandenbussche E,Dom R ( 2004): Cognitive changes in patients with Huntington's disease (HD) and asymptomatic carriers of the HD mutation—A longitudinal follow‐up study. J Neurol 251: 935–942. [DOI] [PubMed] [Google Scholar]
- Lewis SJ,Dove A,Robbins TW,Barker RA,Owen AM ( 2003): Cognitive impairments in early Parkinson's disease are accompanied by reductions in activity in frontostriatal neural circuitry. J Neurosci 23: 6351–6356. [DOI] [PMC free article] [PubMed] [Google Scholar]
- Lewis SJ,Dove A,Robbins TW,Barker RA,Owen AM ( 2004): Striatal contributions to working memory: A functional magnetic resonance imaging study in humans. Eur J Neurosci 19: 755–760. [DOI] [PubMed] [Google Scholar]
- Monchi O,Taylor JG,Dagher A ( 2000): A neural model of working memory processes in normal subjects, Parkinson's disease and schizophrenia for fMRI design and predictions. Neural Netw 13: 953–973. [DOI] [PubMed] [Google Scholar]
- Montoya A,Price BH,Menear M,Lepage M ( 2006): Brain imaging and cognitive dysfunctions in Huntington's disease. J Psychiatry Neurosci 31: 21–29. [PMC free article] [PubMed] [Google Scholar]
- Nehl C,Ready RE,Hamilton J,Paulsen JS ( 2001): Effects of depression on working memory in presymptomatic Huntington's disease. J Neuropsychiatry Clin Neurosci 13: 342–346. [DOI] [PubMed] [Google Scholar]
- Nelson HE ( 1976): A modified card sorting test sensitive to frontal lobe defects. Cortex 12: 313–324. [DOI] [PubMed] [Google Scholar]
- Oldfield RC ( 1971): The assessment and analysis of handedness: The Edinburgh inventory. Neuropsychologia 9: 97–113. [DOI] [PubMed] [Google Scholar]
- Paulsen JS,Salmon DP,Monsch AU,Butters N,Swenson MR,Bondi MW ( 1995): Discrimination of cortical from subcortical dementias on the basis of memory and problem‐solving tests. J Clin Psychol 51: 48–58. [DOI] [PubMed] [Google Scholar]
- Paulsen JS,Zimbelman JL,Hinton SC,Langbehn DR,Leveroni CL,Benjamin ML,Reynolds NC,Rao SM ( 2004): fMRI biomarker of early neuronal dysfunction in presymptomatic Huntington's disease. AJNR Am J Neuroradiol 25: 1715–1721. [PMC free article] [PubMed] [Google Scholar]
- Pavese N,Andrews TC,Brooks DJ,Ho AK,Rosser AE,Barker RA,Robbins TW,Sahakian BJ,Dunnett SB,Piccini P ( 2003): Progressive striatal and cortical dopamine receptor dysfunction in Huntington's disease: A PET study. Brain 126: 1127–1135. [DOI] [PubMed] [Google Scholar]
- Perlstein WM,Carter CS,Barch DM,Baird JW ( 1998): The Stroop task and attention deficits in schizophrenia: A critical evaluation of card and single‐trial Stroop methodologies. Neuropsychology 12: 414–425. [DOI] [PubMed] [Google Scholar]
- Rosas HD,Feigin AS,Hersch SM ( 2004): Using advances in neuroimaging to detect, understand, and monitor disease progression in Huntington's disease. NeuroRx 1: 263–272. [DOI] [PMC free article] [PubMed] [Google Scholar]
- Rosas HD,Tuch DS,Hevelone ND,Zaleta AK,Vangel M,Hersch SM,Salat DH ( 2006): Diffusion tensor imaging in presymptomatic and early Huntington's disease: Selective white matter pathology and its relationship to clinical measures. Mov Disord 21: 1317–1325. [DOI] [PubMed] [Google Scholar]
- Ruocco HH,Bonilha L,Li ML,Lopes‐Cendes I,Cendes F: Longitudinal analysis of regional gray matter loss in Huntington disease: Effects of the length of the expanded CAg repeat. J Neurol Neurosurg Psychiatry. Published online July 5, 2007. 10.1136/jnnp.2007.116244. [DOI] [PubMed] [Google Scholar]
- Rypma B,D'Esposito M ( 1999): The roles of prefrontal brain regions in components of working memory: Effects of memory load and individual differences. Proc Natl Acad Sci USA 96: 6558–6563. [DOI] [PMC free article] [PubMed] [Google Scholar]
- Rypma B,Berger JS,D'Esposito M ( 2002): The influence of working‐memory demand and subject performance on prefrontal cortical activity. J Cogn Neurosci 14: 721–731. [DOI] [PubMed] [Google Scholar]
- Shoulson I,Fahn S ( 1979): Huntington's disease: Clinical care and evaluation. Neurology 29: 1–3. [DOI] [PubMed] [Google Scholar]
- Snowden J,Craufurd D,Griffiths H,Thompson J,Neary D ( 2001): Longitudinal evaluation of cognitive disorder in Huntington's disease. J Int Neuropsychol Soc 7: 33–44. [DOI] [PubMed] [Google Scholar]
- Spitzer M,Franke B,Walter H,Buechler J,Wunderlich AP,Schwab M,Kovar K,Hermle L,Gron G ( 2001): Enantio‐selective cognitive and brain activation effects of N‐ethyl‐3,4‐methylenedioxyamphetamine in humans. Neuropharmacology 41: 263–271. [DOI] [PubMed] [Google Scholar]
- Talairach J,Tournoux P ( 1988): Co‐Planar Stereotaxic Atlas of the Human Brain. New York: Thieme Medical Publishers. [Google Scholar]
- Thiruvady DR,Georgiou‐Karistianis N,Egan GF,Ray S,Sritharan A,Farrow M,Churchyard A,Chua P,Bradshaw JL,Brawn T‐L,Cunnington R ( 2007): Functional connectivity of the prefrontal cortex in Huntington's disease. J Neurol Neurosurg Psychiatry 78: 127–133. [DOI] [PMC free article] [PubMed] [Google Scholar]
- Voermans NC,Petersson KM,Daudey L,Weber B,Van Spaendonck KP,Kremer HP,Fernandez G ( 2004): Interaction between the human hippocampus and the caudate nucleus during route recognition. Neuron 43: 427–435. [DOI] [PubMed] [Google Scholar]
- Walter H,Vasic N,Höse A,Spitzer M,Wolf RC ( 2007): Working memory dysfunction in schizophrenia compared to healthy controls and patients with depression: Evidence from event‐related fMRI. NeuroImage 35: 1551–1561. [DOI] [PubMed] [Google Scholar]
- Ward J,Sheppard JM,Shpritz B,Margolis RL,Rosenblatt A,Brandt J ( 2006): A four‐year prospective study of cognitive functioning in Huntington's disease. J Int Neuropsychol Soc 12: 445–454. [PubMed] [Google Scholar]
- Weinberger DR,Berman KF ( 1996): Prefrontal function in schizophrenia: Confounds and controversies. Philos Trans R Soc Lond B Biol Sci 351: 1495–1503. [DOI] [PubMed] [Google Scholar]
- Weinberger DR,Berman KF,Iadarola M,Driesen N,Zec RF ( 1988): Prefrontal cortical blood flow and cognitive function in Huntington's disease. J Neurol Neurosurg Psychiatry 51: 94–104. [DOI] [PMC free article] [PubMed] [Google Scholar]
- Wolf RC,Vasic N,Walter H ( 2006): Differential activation of ventrolateral prefrontal cortex during working memory retrieval. Neuropsychologia 44: 2558–2563. [DOI] [PubMed] [Google Scholar]
- Wolf RC,Vasic N,Höse A,Spitzer M,Walter H ( 2007a): Changes over time in frontotemporal function in patients with schizophrenia during working memory performance. Schizophr Res 91: 141–150. [DOI] [PubMed] [Google Scholar]
- Wolf RC,Vasic N,Schönfeldt‐Lecuona CL,Landwehrmeyer GB,Ecker D ( 2007b): Dorsolateral prefrontal cortex dysfunction in presymptomatic Huntington's disease: Evidence from event‐related fMRI. Brain. Published online September 13, 2007. doi:10.1093/brain/awm210. [DOI] [PubMed] [Google Scholar]
- Wolf RC,Walter H ( 2005): Evaluation of a novel event‐related parametric fMRI paradigm investigating prefrontal function. Psychiatry Res Neuroimaging 140: 73–83. [DOI] [PubMed] [Google Scholar]
- Zakzanis KK ( 1998): The subcortical dementia of Huntington's disease. J Clin Exp Neuropsychol 20: 567–578. [DOI] [PubMed] [Google Scholar]
- Zimmermann P,Fimm B ( 1994): Testbatterie zur Aufmerksamkeitsprüfung (TAP). Herzogenrath: Psytest. [Google Scholar]
Associated Data
This section collects any data citations, data availability statements, or supplementary materials included in this article.
Supplementary Materials
Additional Supporting Information may be found in the online version of this article.
Supporting Information Figure 6