

Abstract
Quantitative analysis of human electroencephalogram (EEG) is a valuable method for evaluating psychopharmacological agents. Although the effects of different drug classes on EEG spectra are already known, interactions between brain locations remain unclear. In this work, cross mutual information function and appropriate surrogate data were applied to assess linear and nonlinear couplings between EEG signals. The main goal was to evaluate the pharmacological effects of alprazolam on brain connectivity during wakefulness in healthy volunteers using a cross‐over, placebo‐controlled design. Eighty‐five pairs of EEG leads were selected for the analysis, and connectivity was evaluated inside anterior, central, and posterior zones of the scalp. Connectivity between these zones and interhemispheric connectivity were also measured. Results showed that alprazolam induced significant changes in EEG connectivity in terms of information transfer in comparison with placebo. Trends were opposite depending on the statistical characteristics: decreases in linear connectivity and increases in nonlinear couplings. These effects were generally spread over the entire scalp. Linear changes were negatively correlated, and nonlinear changes were positively correlated with drug plasma concentrations; the latter showed higher correlation coefficients. The use of both linear and nonlinear approaches revealed the importance of assessing changes in EEG connectivity as this can provide interesting information about psychopharmacological effects. Hum Brain Mapp, 2010. © 2009 Wiley‐Liss, Inc.
Keywords: alprazolam, benzodiazepine, drug effect, EEG, mutual information
INTRODUCTION
Quantitative analysis and interpretation of human electroencephalogram (EEG) has been used since the late‐1980s in clinical neuropsychopharmachology. It has proven to be a valuable technique for classifying psychopharmacological agents and assessing their pharmacodynamics. It is also used to objectively and quantitatively evaluate drug functional bioavailability in the human brain [Barbanoj et al.,2002; Saletu et al.,1987]. The method most widely used to help in the diagnostic process of psychiatric and neurological disorders and to evaluate the influence of drugs is based on changes obtained in spectral EEG variables. Currently, four spectral bands are considered of clinical interest in pharmaco‐EEG studies: delta (δ), theta (θ), alpha (α), and beta (β). The effect of different drug classes on the spectral variables of univariate EEG time series is already known. Benzodiazepines, for example, basically decrease α1 power and increase β power (defined from 7.5 to 10.5 Hz and from 13 to 35 Hz, respectively) [Barbanoj et al.,1994; Saletu and Pakesch,1987]. However, interactions between brain locations remain unclear.
Traditionally, coherence and cross‐correlation have been the main methods to assess the degree of functional connectivity between brain areas that could be associated with different functional states [Achermann and Borbély,1998]. Spatial statistics of scalp EEG have usually been presented as coherence estimates in individual frequency bands. Nevertheless, the main limitation of these approaches is that only the linear statistical link between EEG signals is indicated.
Several nonlinear approaches have recently been applied to univariate EEG time series to evaluate different phenomena. These include monitoring the depth of anesthesia [Ferenets et al.,2006] and recovery after an asphyxia injury [Shanbao et al.,2003], and diagnosing epileptic seizures [Srinivasan et al.,2007] or cardiac diseases [Huyn‐Chool et al.,2006].
In the last few years, nonlinear techniques have also been used to detect nonlinear interactions in neurophysiology, applying methods derived from information theory [Palus,1996b; Schreiber and Schmitz,2000], from generalized synchronization [Abarbanel et al.1996; David et al.,2004; Kreuz,2004], and from phase synchronization [David et al.,2004; Stam et al.,2002,2003]. A number of different approaches aiming at a quantification of the degree of synchronization between signals have been proposed in the literature. Multivariate nonlinear analysis does not necessarily coincide with the evaluation obtained from linear methods, and this is the main reason why nonlinear tools are not intended to substitute linear tools. Indeed, nonlinear methods are useful to assess the interdependences between neural assemblies and to provide additional information with respect to linear tools [Pereda et al.,2005]. Some recent studies have compared different nonlinear approaches, but it is difficult to objectively assess the performance of these measures in EEG data. Moreover, most of the nonlinear indexes seem to be correlated [David et al.2004; Kreuz,2004; Quiroga et al.,2002].
Within the framework of information theory, mutual information (MI) analysis represents a general method to detect both linear and nonlinear statistical dependences between time series, and it can be considered an alternative to the well‐known correlation analysis. Intuitively, cross mutual information (CMI) obtained from two signals or time series quantifies the amount of information gained about one signal from the measurement of another one as a function of delay between these two time series. CMI can thus provide a quantitative measure of linear and nonlinear components of coupling between two processes or time series in terms of information transfer when appropriate surrogate data are used [Alonso et al.,2007; Hoyer et al.,2005; Palus,1996a; Pereda et al.,2005; Prichard and Theiler,1994; Schreiber and Schmitz,2000; Theiler et al.,1992].
Nonlinear interactions between EEG time series can therefore be assessed by means of MI, whose derived indexes have been found to be promising in yielding useful information in several studies, particularly in epilepsy [Kreuz,2004], in Alzheimer disease [Hornero et al.,2009; Jeong et al.,2001], and in schizophrenia [Na et al.,2002]. MI is also considered useful for many other studies, such as during anesthesia [Frasch et al.,2007], stimuli processing [Teplan et al.,2006], cognitive performance [Jin et al.,2006a,b], sleep deprivation [Na et al.,2006], and motor tasks [Chun‐Chuan et al.,2008]. Moreover, David et al. [2004] evaluated interdependence changes, and MI retained sensitivity to variations of the coupling strength between signals.
However, most of the above‐mentioned studies did not quantify the nonlinear dependence of electrical potentials across brain areas or they did so measuring linear and nonlinear dependences together. Approaches related to nonlinear information transmission have not been applied to date for the assessment of electrophysiological changes induced on EEG by medications in a placebo‐controlled, cross‐over study in healthy volunteers.
The use of data coming from a strictly controlled experimental design in laboratory conditions in healthy volunteers minimizes uncontrolled sources of variance [Warrington,1997]. Running a pharmacological challenge with well‐known compounds allows us to integrate the available information about their mechanism of action into the electrophysiological realm [Riba and Barbanoj,2008].
Two aspects that influence brain connectivity studies and should be taken into account are volume conduction and reference electrode. Respect to the former [Nolte et al.2004] proposed a modified coherence measure that depended on the effects related to brain interactions but skull propagation. Nunez and Srinivasan [2006] explained that capacitive effects at macroscopic scales have a minimal influence on EEG volume conduction due to the dielectric properties of the neocortex at frequencies associated with EEG. In other words, volume conduction is independent of source frequency in the usual EEG range. Moreover, as electrical measurements depend on skull properties, it is advisable to use normalized variables, independently of the amplitude of the recorded signals. The second issue is the choice of reference electrode location in EEG recordings. The intuitive idea of an “inactive” electrode means that the recording electrodes should be near the generating sources, whereas reference electrodes should be placed far from them. In practice, distant points are not usually available [Nunez and Srinivasan,2006]. Averaged mastoids or earlobes [Barbanoj et al.,2008; Lucchesia et al.,2003; Romano et al.,2002; Sampaio et al.,2007; Tan et al.,1998] have traditionally been used for pharmaco‐EEG studies (e.g., nose reference was used in [Fingelkurts et al.,2004]). In this study, averaged mastoids were selected as reference.
Any effects of reference electrode and volume condition on the results were reduced by the experimental and statistical design of the study: we conducted a double comparison between before and after intake and between drug and placebo conditions, for each subject. As the effects of field spread and reference could be considered identical in all cases, they were cancelled by this double comparison, and the differences obtained were due to a pharmacological effect.
The design of the experiment for this study followed the guidelines of the International Pharmaco‐EEG Group [Dümermuth et al.,1987; Ferber et al.,1999; Stille and Herrmann,1982] and was focused on revealing the differences between the administration of the drug and placebo.
To consider only the net pharmacological effect, all measured variables were baseline corrected; that is, the value of a variable measured before intake was subtracted from the same variable obtained after drug intake. To remove the effects of circadian rhythms, all experimental sessions started at the same time of day, and statistical comparison was performed between baseline corrected variables obtained after placebo and drug.
The effects of a single administration of alprazolam were studied in this work. Alprazolam is a short‐acting drug of the benzodiazepine class, and it is extensively prescribed in the Western World for the treatment of anxiety and panic disorders. Absorption following oral dosing is rapid and almost complete. Peak plasma concentrations are obtained between 0.5 and 2 h after intake [Greenblat and Wright,1993]. Regarding brain effects, it is widely known that benzodiazepine activity runs in a progressive continuum from anxiolytic, to sedative, hypnotic, and anesthetic effects, each well characterized by specific behavioral features [Malizia and Nutt,1995]. Benzodiazepines induce an enhancement of the inhibitory pathways through their activity on the GABAA receptor complex, favoring the entrance to chloride ions into the neurons [Haefely,1990]. Up to now, few studies have analyzed human EEG connectivity after drug dispensation. Besides, the few concerning benzodiazepine administration have only been based on linear techniques, such as coherence [Romano et al.,2002, Sampaio et al.,2007], or on the so‐called index of structural synchrony [Fingelkurts et al.,2004], and results are conflictive.
Because of the enhancement of the inhibitory pathways that arises as a consequence of the neurophysiological effects of benzodiazepine, a weakening or even an impairment of functional connectivity was hypothesized. However, this increase of inhibitory activity could help to reveal connections that were not previously apparent, such as weak nonlinear interactions between EEG time series.
The aim of this study was to describe short‐term changes caused by alprazolam in terms of brain connectivity, by separately quantifying effects on linear and nonlinear coupling between EEG leads.
METHODOLOGY
Experimental Protocol
A single oral dose of alprazolam 1 mg was administered to nine volunteers under fasting conditions in a double‐blind randomized crossover placebo‐controlled design. Volunteers, aged between 20 and 32 years (mean age 23 years), were reported to be in good health and not allowed to take any psychoactive drugs in the two weeks before the study or during the study period. In addition, they abstained from alcohol, tobacco, and caffeinated drinks in the 48 h before each experimental day, and experimental days were separated by 1‐week washout period. The study was conducted in accordance with the Declaration of Helsinki and subsequent revisions concerning experimentation in humans and approved by the Hospital Ethics Committee and the Spanish Ministry of Health.
Upon arrival in the laboratory, volunteers received instructions from the experimenter, a cannula was placed in the cubital vein for blood sampling, and medication was given. Blood was drawn immediately after each signal recording at various time points to establish the pharmacokinetic profile of the drug. Blood samples were heparinized and centrifuged, and plasma concentrations of alprazolam were measured by a validated liquid chromatography tandem mass spectrometry method.
During each recording session, volunteers were seated in a comfortable reclining chair in a dimly lit, sound‐attenuated, and electrically shielded chamber. EEG was recorded with eyes closed to reduce eye‐related artifacts such as blinking, and volunteers were asked to remain alert throughout the experiment. All spontaneous EEG recordings were vigilance‐controlled, that is, they were visually monitored for alertness. As soon as drowsiness patterns such as suppression of alpha wave trains appeared in the EEG signals, volunteers were aroused by gentle acoustic stimulation and recovered their initial alertness state. Drowsiness patterns showed an average of 0.13 occurrences per minute of recording.
A 3‐min EEG was recorded before drug intake (PRE‐recording) and at six time‐points after drug intake: 30 min, 45 min, 1 h, 1.5 h, 2.5 h, and 4 h. We recorded vertical and horizontal electrooculogram (EOG) signals, and 19 EEG channels corresponding to Fp1, Fp2, F7, F3, Fz, F4, F8, T3, C3, Cz, C4, T4, T5, P3, Pz, P4, T6, O1, and O2 (according to the international 10‐20 system) referenced to averaged mastoid electrodes (A1 and A2). Gold‐plated standard EEG electrodes were used (keeping electrode impedance below 5 kΩ). EEGs were analogically band‐pass filtered between 0.1 and 50 Hz and recorded by means of a NEUROSCAN SynAmps amplifier with an A/D resolution of 24 bits at a sampling frequency of 100 Hz.
Artifact Reduction and Rejection
A two‐step artifact processing procedure was used. The first stage consisted of an ocular artifact reduction process based on blind source separation (BSS). An automatic artifact (saturation, muscles, and movement) rejection procedure was implemented in a second stage, as described by Anderer et al. [1992].
BSS is a statistical signal processing technique whose goal is to express a set of signals as a linear combination of statistically independent component signals. One way to formulate the BSS problem is to consider the following generative model for the data:
| (1) |
where x is a matrix composed of n row vectors (raw EOG and EEG signals recorded at different electrodes), s is a matrix composed of m row vectors (source signals), the columns of x and s correspond to the time points, and A is the n × m matrix, which must be estimated. In other words, x
i (0 < i ≤ n) are mixtures composed of original sources s
j (0 < j ≤ m). Nothing is known about the mixing process A or the sources s
j, whose estimation is the objective of the BSS. Second‐order statistics are usually sufficient to solve the linear BSS problem if temporal information is taken into account. In particular, the SOBI: second order blind identification algorithm [Belouchrani et al.,1997], which is based on eigenvalue decomposition of a linear combination of several time delayed covariance matrices, was applied in this paper. Rows of the output data matrix  are the estimated source signals. After detecting the source signals related to ocular interference, corrected EEG signals can be reconstructed from the remaining components by zeroing out the corresponding rows of matrix
  . Automatic identification of these ocular sources was based on frequency and scalp topography aspects of the source signals and was previously described at Romero et al. [2008]. The number of components identified as artifacts ranged from one to four, with an average number of 2.44 components per recording. No statistically significant differences in the number of such components were found between placebo and drug or between different recording instants.
After ocular artifact reduction procedures, an automatic artifact identification algorithm based on temporal and spectral variables of EEG signals was applied. Each 5‐s epoch was analyzed and rejected due to artifacts if any of the following rules was broken [Anderer et al.,1987,1992]:
-
1
Maximum amplitude of EEG channels had to be lower than ±150 mV to avoid electrode‐related artifacts or remaining ocular contamination.
-
2
Absolute power in the 35–45 Hz band had to be lower than 25 mV2 in each EEG channel to reject muscular artifacts. Frontopolar, frontal, and temporal derivations had a higher threshold set to 50 mV2.
-
3
Absolute power ratio between α (7.5–13 Hz) and δ (1.3–3.5 Hz) bands had to be higher than a variable threshold, which depended on the EEG channel's amplitude and alpha activity present in the signal. This criterion was set to detect drowsiness patterns associated with a decrease in alpha activity and also to counterbalance a possible incorrect elimination of ocular artifacts, mainly indicated by an increase in delta activity.
After computing the two‐step artifact processing procedure, an artifact‐free consecutive 90‐s segment was cropped out. Each available signal was filtered between 1.3 and 35 Hz using a type‐II Chebyshev filter of order 20. Zero‐phase forward and reverse digital filtering was applied to cancel phase distortions.
Mutual Information Calculation
Mutual information function (MIF) assesses temporal dependencies in terms of information transfer as a function of a time horizon (τ). Mutual information is zero valued when series are independent and reaches a maximum value if series are identical. In other words, MIF estimates the predictability over a time horizon, either in a single time series (auto mutual information function) or between two time series (cross mutual information function, CMIF). CMIF can thus be considered a nonlinear counterpart of the cross‐correlation function and in fact, its linear component is closely related to the squared cross‐correlation function. The reduction of uncertainty, or the amount of information transmitted from one signal to another, can be calculated using the following equation to quantify the coupling between two signals ξ(t) and η(t + τ) [Alonso et al.,2007; Hoyer et al.,2005]:
| (2) |
where H(η) represents the a priori uncertainty with regard to η, and H(ξ,η) − H(ξ) is the remaining a posteriori uncertainty with regard to η if ξ is known. H denotes the Shannon entropy, which is defined as follows:
| (3) |
for a discrete probability distribution {p i} of any random variable ξ. As base‐2 logarithm is used, this entropy measures the average information of ξ in bits. In this work, the amplitude range of the data series was quantized using a standard partition with partition points given by the (i/8)‐quantiles, i = 1, 2,…,7. Thus (1) CMIF is independent of the amplitude of the signal and (2) CMIFs maximum possible value is only reached when both time series are identical, being equal to log2(8) = 3 bits. The resulting uniformly distributed signal is invariant under monotonic distortions of the original signal and robust against outliers and trends [Escudero et al.,2009]. This methodology for CMIF calculation was exactly the same as that applied to demodulated EMG time series in a previous study [Alonso et al.,2007].
CMIF was obtained as a function of time lag (τ), by repeating the calculation of I(ξ,η) over a time delay ranging from −0.5 to 0.5 s.
Linear and Nonlinear Contribution of Mutual Information
CMI takes into account all statistical dependences between two series, both linear and nonlinear. To identify nonlinear couplings, it was thus necessary to obtain a special type of bivariate phase‐randomized surrogate data [Hoyer et al.,2005; Prichard and Theiler,1994; Theiler et al.,1992].
In general, surrogate data come from manipulations of the original data conducted to conserve all the statistical properties of the data under study except the property of interest [Kantz and Schreiber,2000; Pereda et al.,2005]. Two points have to be considered to calculate phase randomized surrogates: spurious results may be produced if the amplitude distribution of the original data is not Gaussian; and phase relations between signals must be kept constant [Alonso et al.2007; Kantz and Schreiber,2000; Prichard and Theiler,1994].
In this study, surrogate data that conserve all complex linear interactions were calculated as per the following steps: (1) amplitude normalization; (2) synchronous phase randomization, that is, keeping the phase relations between channels constant; (3) amplitude rescaling.
These kinds of surrogates represent the special case of possible linear stochastic synchronization, which is rejected in the case of phase synchronized nonlinear systems. Hence, if there is linear stochastic synchronization between signals, surrogates are able to preserve it.
Twenty sets of surrogate data were obtained for each pair of EEG signals under study (see Table I). CMI functions were then calculated for each set of surrogates. The average function of all these CMI functions was calculated and labeled linear contribution of CMIF, because this function provided the linear coupling between the each pair of EEG time series considered. The nonlinear contribution of CMIF was measured as the difference between the original CMIF, calculated from the EEG time series, and the linear contribution of CMIF.
Table I.
Connectivity zones used in this work and EEG pairs included in each grouping
| Connectivity zone | EEG channels |
|---|---|
| Frontal | Fp1‐Fp2, Fp1‐F7, Fp1‐F3, Fp1‐Fz, Fp2‐Fz, Fp2‐F4, Fp2‐F8, F3‐Fz, F3‐F4, F4‐F8, F7‐F3, F7‐F8, Fz‐F4 |
| Central | T3‐C3, T3‐T4, C3‐Cz, C3‐C4, Cz‐C4, C4‐T4 |
| Posterior | T5‐P3, T5‐T6, T5‐O1, P3‐Pz, P3‐P4, P3‐O1, Pz‐P4, Pz‐O1, Pz‐O2, P4‐T6, P4‐O2, T6‐O2, O1‐O2 |
| Frontal–central | Fp1‐T3, Fp1‐C3, Fp1‐Cz, Fp2‐Cz, Fp2‐C4, Fp2‐T4, F7‐T3, F7‐C3, F3‐T3, F3‐C3, F3‐Cz, Fz‐Cz, F4‐Cz, F4‐C4, F4‐T4, F8‐C4, F8‐T4 |
| Frontal–posterior | Fp1‐T5, Fp1‐P3, Fp1‐Pz, Fp1‐O1, Fp2‐Pz, Fp2‐P4, Fp2‐T6, Fp2‐O2, F7‐T5, F7‐O1, F3‐P3, F3‐Pz, F3‐O1, Fz‐P3, Fz‐Pz, Fz‐P4, F4‐Pz, F4‐P4, F4‐O2, F8‐T6, F8‐O2 |
| Central–posterior | T3‐T5, T3‐P3, T3‐O1, C3‐T5, C3‐P3, C3‐O1, Cz‐P3, Cz‐Pz, Cz‐P4, C4‐P4, C4‐T6, C4‐O2, T4‐P4, T4‐T6, T4‐O2 |
| Interhemispheric | Fp1‐Fp2, F7‐F8, F3‐F4, T3‐T4, C3‐C4, T5‐T6, P3‐P4, O1‐O2 |
Finally, the area under the curve (area) was calculated for linear and nonlinear contributions of CMIF as a measure of linear and nonlinear couplings, respectively. This variable was obtained for all volunteers, for all time instants, and for all considered pairs of channels, as a global measure of statistical dependence, considering time lags between −0.5 and 0.5 s. After systematic evaluation of the obtained functions, this lag interval was considered sufficiently long. CMIF generally reached very low values with respect to the maximum outside this range of time delays (see Fig. 1).
Figure 1.
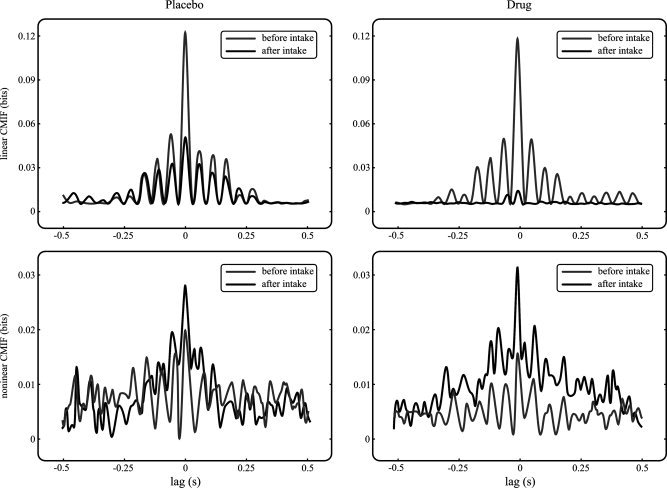
CMIF functions from a frontal–central pair of EEG leads, before and after drug intake. Left column shows placebo results for linear and nonlinear contributions of CMIF (top and bottom axes, respectively). Right column shows linear and nonlinear contributions (top and bottom axes, respectively) for drug intake situation.
Connectivity Assessment
Eighty‐five pairs of EEG leads (see Table I) were selected for the analysis to evaluate the most interesting couplings between electrode locations. Connectivity was evaluated over anterior, central, and posterior regions of the scalp. Connectivity between these regions and interhemispheric connectivity were also measured (see Fig. 2). So as to consider only the net pharmacological effect, all measured variables were baseline and placebo‐corrected.
Figure 2.
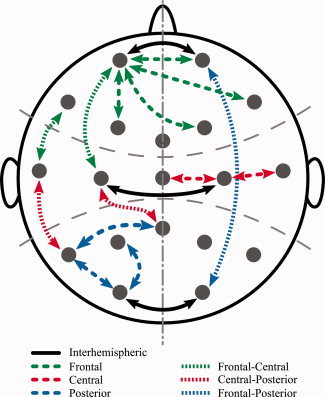
Examples of pairs of EEG leads used to assess: global interhemispheric, individual (frontal, central, and posterior) and interregion (frontal–central, frontal–posterior, and central–posterior) connectivity.
Statistics
Statistics were performed using two‐sided Wilcoxon signed rank tests to compare placebo and drug intake at the different time‐points. As explained earlier, the value at PRE instant had previously been subtracted from the values at each of these times. Results from the statistical tests for all pairs of leads were represented by statistical parametric maps (SPM). SPM are schematic representations of electrodes over the scalp where statistically significant comparisons between EEG leads are shown by lines connecting their corresponding electrodes. In this work, warm‐colored lines were used when significant increases of area were found, whereas cold‐colored lines indicated significant decreases of this variable. Thick dark‐colored lines represented statistically significant changes with P‐values lower than 0.01, whereas thick and thin light‐colored lines indicated P‐values lower than 0.05 and 0.1, respectively.
To detect changes in EEG connectivity related to drug effect, an omnibus significance test based on the binomial theorem was performed [Cross and Chaffin,1982], which corrects the higher chance of false positive results due to the multiple comparison tests. Thus, SPM with more than nine significant channel pairs of 85 (P < 0.1) were considered to reject the global null hypothesis.
Time changes in the net pharmacological effect were compared to plasma concentrations of alprazolam averaged for all subjects as a function of time. To have a quantitative measure of this comparison in the range from zero to one, the maximum absolute value of the normalized cross‐correlation function between both variables was calculated.
RESULTS
Linear Connectivity
Statistically significant differences between changes obtained after placebo and alprazolam for linear connectivity are shown in Figure 3a. Statistically significant decreases were found immediately after drug intake (30 min). The number of significant differences remained until 1 h after drug administration, gradually decreased thereafter, and had disappeared at 4 h. These decreases in linear connectivity seemed to affect the whole scalp.
Figure 3.
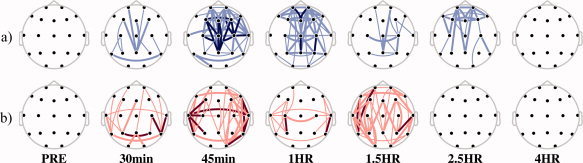
SPM showing differences caused by (a) linear and (b) nonlinear CMIF contribution in area variable between electrodes. Maps show the net pharmacological change (‐PRE, ‐placebo) at six time‐points after drug intake. Cold and warm colors depicted significant decreases and increases, respectively. Color intensity and trace thickness indicate different P‐values, the lighter and narrower: the higher, that is, dark color and thick traces meant highly significant (P‐value < 0.01), and light color and thin lines represented the less significant case (P‐value < 0.1). Only maps with more lines than 10% of the total number of channel pairs were depicted.
The net pharmacological effect on the area (averaged over all available interhemispheric pairs of channels) obtained from the linear contribution of CMIF is depicted along the different time points in Figure 4.
Figure 4.
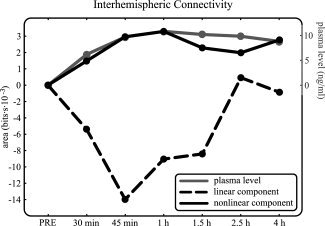
Net pharmacological effects on area as a function of time after drug intake averaged for all interhemispheric pairs of channels (see left axis scale). Black dashed traces correspond to the linear component of CMIF, whereas black solid traces indicate nonlinear connectivity measures. Plasma drug concentrations are also shown as a function of time (see right axis scale, gray solid traces). Nonlinear measures were positively correlated with plasma levels and showed higher correlation coefficients than linear measures, which were negatively correlated with plasma levels.
The linear component of the global interhemispheric connectivity showed a progressive decrease, reaching a minimum at 45 min after drug intake. It recovered its initial values after 2.5 h. Similar trends were obtained when the net pharmacological effect along the different timepoints on the linear contribution of CMIF was calculated for the individual (frontal, central, and posterior) and interregion (frontal–central, frontal–posterior, and central–posterior).
Maximum values of normalized cross‐correlation function between time changes of the net pharmacological effect on the area assessing the linear components of CMIF (averaged curves among EEG pairs and volunteers) and plasma concentrations of alprazolam as a function of time ranged between 0.775, which was obtained at the posterior evaluation, and 0.915 at the frontal–posterior evaluation (see Table II).
Table II.
Maximum absolute values of normalized cross‐correlation function between time changes in the net pharmacological effect on area values obtained from linear and nonlinear components of CMIF and drug plasma concentrations
| Connectivity | Correlation coefficient for linear component | Correlation coefficient for nonlinear component |
|---|---|---|
| Global interhemispheric | 0.828 | 0.985 |
| Frontal | 0.854 | 0.896 |
| Central | 0.858 | 0.913 |
| Posterior | 0.775 | 0.969 |
| Frontal–central | 0.891 | 0.942 |
| Frontal–posterior | 0.915 | 0.985 |
| Central–posterior | 0.889 | 0.981 |
Nonlinear Connectivity
Statistically significant differences between changes obtained after placebo and alprazolam for nonlinear connectivity are shown in Figure 3b. SPMs revealed significant increases of nonlinear connectivity from 30 min until 1.5 h after drug intake. These increases in nonlinear connectivity seemed to affect the entire scalp.
The net pharmacological effect on the area (averaged over all available interhemispheric pairs of channels) obtained from nonlinear contribution of CMIF is depicted along the different time points in Figure 4. The nonlinear component of the global interhemispheric connectivity showed a progressively sustained increase until 1.5 h, remaining at approximately the same level until 4 h. Similar trends were obtained when the net pharmacological effect along the different time points on the nonlinear contribution of CMIF was calculated for the individual (frontal, central, and posterior) and interregion (frontal–central, frontal–posterior, and central–posterior) evaluation assessments.
Maximum values of normalized cross‐correlation function between time changes of the net pharmacological effect on the area assessing the nonlinear components of CMIF (averaged curves among EEG pairs and volunteers) and plasma concentrations of alprazolam as a function of time ranged between 0.896, obtained at the frontal evaluation, and 0.985, which was obtained at the frontal–posterior evaluation (see Table II).
DISCUSSION AND CONCLUSION
Drug effects on EEG have been studied to date by means of linear techniques such as classical spectral analysis [Tan et al.,1998], coherence [Romano et al.,2002; Sampaio et al.,2007], and other measures such as the so‐called index of structural synchrony [Fingelkurts et al.,2004]. Although EEG is usually recorded using the 10‐20 placement for electrodes, some connectivity studies only took into account interhemispheric pairs of channels, see for instance [Sampaio et al.,2007]. In the last decades, linear techniques for electrophysiological signal analysis have been substantially extended by nonstationary, nonlinear, and complexity approaches. Complexity has usually been assessed with regard to a single time scale, disregarding complex physiology organized on several different time scales. This drawback has been overcome by information transfer functions such as CMIF, which has been confirmed as an appropriate approach for the analysis of time scale related complexity between biomedical signals series [Chun‐Chuan et al.,2008; Jeong et al.,2001; Jin et al.,2006a,b; Na et al.,2002,2006].
Electrophysiological signals, which are not related to brain activity, can be a source of contamination for EEG. The largest of these is the EOG, which is originated by the electrical dipole contained in the eye. To analyze and interpret EEG, artifacts need to be removed. In this work, a BSS‐based filtering approach was chosen, because it has proven to be an effective method for removing ocular artifacts from spontaneous EEG recordings [Romero et al.,2008; Vigon et al.,2000], overcoming limitations of linear regression methods. Moreover, BSS approaches can well preserve the nonlinear characteristics of EEG after artifact removal [Zhaojun et al.,2006].
This study assessed the electrophysiological effects of alprazolam on scalp EEG connectivity. The electrophysiological changes of EEG coupling were evaluated separately by means of linear and nonlinear CMIF contributions. So as to evaluate both kinds of functional couplings separately, appropriate surrogate data were used.
The results were obtained in a strictly controlled environment after a pharmacological challenge, which made it possible to formulate an explicit experimental hypothesis: like all benzodiazepines, alprazolam facilitates the action of GABA, the main inhibitory neurotransmitter on the CNS. As a consequence of the enhancement of inhibitory pathways, a weakening or even an impairment of functional connections was hypothesized. In other words, we expected that the elements (either single neurons or neuronal populations) of the CNS would have a decreased influence on each other, thus inducing a global reduction in connectivity.
Linear results only showed significant decreases (see Figs. 3a and 4) that indicated a decoupling between areas after drug intake. Linear decreases of connectivity could be found from 30 min to 1 h after drug administration and were consistent with reported timing of peak plasma concentrations [Greenblat et al.,1993]. Correlations between plasma drug concentrations and the variable obtained from linear contribution of CMIF were high for all scalp regions and interhemispheric connectivities. These results agreed with the experimental hypothesis, but they did not agree with a previously published work in which interhemispheric coherence increased due to drug action [Sampaio et al.,2007]. Interestingly, after benzodiazepine intake, a decrease in absolute and relative power of the alpha frequency band (7.5–10.5 Hz) was observed when applying spectral analysis to EEG data [Barbanoj et al.,1994]. This reduction in alpha activity has been associated behaviorally with a decrease in the vigilance level produced after acute ingestion of these drugs [Barbanoj et al.,2007] and with a weakening of the thalamocortical interactions [Destexhe and Sejnowski,2001]. Thus, both decreases could be related and the reduction of EEG linear couplings might be associated with the decrease of functional connectivity between subcortical and cortical structures. However, further analyses and other experimental measures should be performed to confirm this hypothesis.
Nonlinear connectivity, on the other hand, presented significant increases (see Figs. 3b and 4). These significant differences of CMIF between original and surrogate data could be due either to nonlinear structure in one or both time series or to nonlinear coupling between the time series. In any case, results indicate that there is a nonlinear functional structure in the system of EEG coupled time series as a consequence of drug action.
Statistical differences were found between 30 min and 1.5 h after drug ingestion, and these changes were almost totally correlated with the levels of plasma concentrations as a function of time (see Fig. 4). Correlation coefficients were even higher than those obtained for linear connectivity (see Table I).
The increases obtained with nonlinear analyses agreed with the results reported by increases of the index of structural synchrony in [Fingelkurts et al.,2004]. After benzodiazepine intake, an increase in absolute and relative power of the beta frequency band (13–35 Hz) has been observed when applying spectral analysis to EEG data [Barbanoj et al.,1994]; this was associated behaviorally with increases in cognitive efficiency [Adler and Brassen,2001]. In addition, improvements in cognitive efficiency have been related with augmented local brain integration [Polunina and Davydov,2006], and local cortical neuronal behavior has been found to be weakly nonlinear [Stam,2005]. Thus, it could be hypothesized that stronger nonlinear structure of the underlying system of coupled EEG time series could be related to an augmentation of functional connectivity between cortico‐cortical structures. Nevertheless, as mentioned earlier, further analysis and experimental measures should be done to conclude and confirm these hypotheses.
It should be noted that CMIF did not directly estimate axonal connections or cortico‐cortical communication. Information transfer quantified by CMIF should be understood in a statistical sense to mean that one could obtain information about the time series at one site from the time series at another site. Neither linear nor nonlinear contributions revealed the exact mechanism or pathways through which this statistical relation was established. Therefore, an impairment or improvement of long/short cortico‐cortical fibers might not be the sole cause of the explanation for changes in the linear and nonlinear components of connectivity after drug intake. The changes observed could also be caused by the dissociation or synchronization between cortical and subcortical structures [Jeong et al.,2001].
In conclusion, our results showed that drug intake induced changes in EEG connectivity in terms of information transfer. However, trends were opposite depending on their statistical characteristics: a decrease in linear interactions and an increase in nonlinear couplings. These effects were generally spread over the entire scalp. The pattern of changes over time in the connectivity maps was very highly correlated with the time course of drug plasma concentrations, providing consistent information about brain changes in terms of connectivity. Finally, the study indicated that changes in EEG connectivity that provide interesting information about psychopharmacological effects should be assessed by both linear and nonlinear approaches.
Acknowledgements
CIBER‐BBN is an initiative of the Instituto de Salud Carlos III, Spain.
REFERENCES
- Abarbanel HD, Huerta R, Rabinovich MI, Rulkov NF, Rowat PF, Selverston AI ( 1996): Neural Comput 8: 1567–1602. [DOI] [PubMed] [Google Scholar]
- Adler G, Brassen S ( 2001): Short‐term rivastigmine treatment reduces EEG slow‐wave power in Alzheimer patients. Neuropsychobiology 43: 273–276. [DOI] [PubMed] [Google Scholar]
- Achermann P, Borbély AA ( 1998): Coherence analysis of the human sleep electroencephalogram. Neuroscience 85: 1195–1208. [DOI] [PubMed] [Google Scholar]
- Alonso JF, Mañanas MA, Hoyer D, Topor ZL, Bruce EN ( 2007): Evaluation of respiratory muscles activity by means of mutual information function at different levels of ventilatory effort. IEEE Trans Biomed Eng 54: 1573–1582. [DOI] [PubMed] [Google Scholar]
- Anderer P, Saletu B, Kinsperger K, Semlitsch H ( 1987): Topographic brain mapping of EEG in psychopharmacology, Part 1: Methodological aspects. Meth Find Exp Clin Pharmacol 9: 369–382. [PubMed] [Google Scholar]
- Anderer P, Semlitsch H, Saletu B, Barbanoj MJ ( 1992): Artifact processing in topographic mapping of electroencephalographic activity in neuropsychopharmacology. Psychiatry Res 45: 79–93. [DOI] [PubMed] [Google Scholar]
- Barbanoj MJ, Anderer P, Antonijoan RM, Torrent J, Saletu B, Jané F ( 1994): Topographic pharmaco‐EEG mapping of increasing doses of buspirone and its comparison with diazepam. Hum Psychopharmacol 9: 101–109. [Google Scholar]
- Barbanoj MJ, Riba J, Morte A, Antonijoan RM, Jané F ( 2002): Basics of PK‐PD using QEEG: Acute/repetitive administration, interactions. Focus on anxiolytics with different neurochemical mechanisms as examples. Methods Find Exp Clin Pharmacol C 24( Suppl.): 67–83. [PubMed] [Google Scholar]
- Barbanoj MJ, Urbano G, Antonijoan RM, Ballester RM, Valle M ( 2007): Different acute tolerance development to EEG, psychomotor performance and subjective assessment effects after two intermittent oral doses of alprazolam. Neuropsychobiology 55: 203–212. [DOI] [PubMed] [Google Scholar]
- Barbanoj MJ, Riba J, Clos S, Giménez S, Grasa E, Romero S ( 2008): Daytime Ayahuasca administration modulates REM and slow‐wave sleep in healthy volunteers. Psychopharmacology 196: 315–326. [DOI] [PubMed] [Google Scholar]
- Belouchrani A, Abed‐Meraim K, Cardoso JF, Moulines E ( 1997): A blind source separation technique using second‐order statistics. IEEE Trans Signal Process 45: 434–444. [Google Scholar]
- Chun‐Chuan C, Jen‐Chuen HS, Yu‐Zu W, Po‐Lei L, Shyan‐Shiou C, Niddam DM, Tzu‐Chen Y, Yu‐Te W ( 2008): Mutual‐information‐based approach for neural connectivity during self‐paced finger lifting task. Hum Brain Mapp 29: 265–280. [DOI] [PMC free article] [PubMed] [Google Scholar]
- Cross EM, Chaffin WW ( 1982): Use of the binomial theorem in interpreting results of multiple tests of significance. Educ Psychol Meas 42: 25–34. [Google Scholar]
- David O, Cosmelli D, Friston K ( 2004): Evaluation of different measures of functional connectivity using a neural mass model. NeuroImage 21: 659–673. [DOI] [PubMed] [Google Scholar]
- Destexhe A, Sejnowski TJ ( 2001). Thalamocortical Assemblies: How Ion Channel, Single Neurons and Large‐Scale Networks Organize Sleep Oscillations. Oxford: Oxford University Press. [Google Scholar]
- Dümermuth G, Ferber G, Herrmann WM, Hinrichs H, Künkel H ( 1987): International Pharmaco‐EEG Group (IPEG). Committe on standarization of data acquisition and signal analysis in pharmaco‐EEG investigations. Neuropsychobiology 17: 213–218. [DOI] [PubMed] [Google Scholar]
- Escudero J, Hornero R, Abasolo D ( 2009): Interpretation of the auto‐mutual information rate of decrease in the context of biomedical signal analysis. Application to electroencephalogram recordings. Physiol Meas 30: 187–199. [DOI] [PubMed] [Google Scholar]
- Ferber G, Abt K, Fichte K, Luthringer R ( 1999): IPEG guideline on statistical design and analysis for pharmacodynamic trials. Neuropsychobiology 39: 92–100. [DOI] [PubMed] [Google Scholar]
- Ferenets R, Lipping T, Anier A, Jantti V, Melto S, Hovilehto S ( 2006): Comparison of entropy and complexity measures for the assessment of depth of sedation. IEEE Trans Biomed Eng 53: 1067–1077. [DOI] [PubMed] [Google Scholar]
- Fingelkurts AA, Kivisaari R, Pekkonen E, Ilmoniemi RJ, Kähkönen S ( 2004): Enhancement of GABA‐related signalling is associated with increase of functional connectivity in human cortex. Hum Brain Mapp 22: 27–39. [DOI] [PMC free article] [PubMed] [Google Scholar]
- Frasch MG, Walter B, Friedrich H, Hoyer D, Eiselt M, Bauer R ( 2007): Detecting the signature of reticulothalamocortical communication in cerebrocortical electrical activity. Clin Neurophysiol 118: 1969–1979. [DOI] [PubMed] [Google Scholar]
- Greenblat DJ, Wright CE ( 1993): Clinical pharmacokinetics of alprazolam: Therapeutic implications. Clin Pharmacokinet 24: 453–471. [DOI] [PubMed] [Google Scholar]
- Haefely W ( 1990): Benzodiazepine receptor and ligands: structural and functional differences In: Hindmarch I, Beaumnot G, Brandon S, Leonard BE, editors. Benzodiazepines: Current Concepts. Biological, Clinical and Social Perspectives. Chichester: Wiley; pp 1–18. [Google Scholar]
- Hornero R, Abásolo D, Escudero J, Gómez C ( 2009): Non‐linear analysis of EEG and MEG in patients with Alzheimer's disease. Philos Trans R Soc A 367: 317–336. [DOI] [PubMed] [Google Scholar]
- Hoyer D, Pompe B, Chon KH, Hardraht H, Wicher C, Zwiener U ( 2005): Mutual information function assesses autonomic information flow of heart rate dynamics at different time scales. IEEE Trans Biomed Eng 52: 584–592. [DOI] [PubMed] [Google Scholar]
- Huyn‐Chool S, Shanbao T, Yamashita S, Xiaofeng J, Geocadin G, Thakor N ( 2006): Quantitative EEG and effect of hypothermia on brain recovery after cardiac arrest. IEEE Trans Biomed Eng 53: 1016–1023. [DOI] [PMC free article] [PubMed] [Google Scholar]
- Jeong J, Gore JC, Peterson BS ( 2001): Mutual information analysis of the EEG in patients with Alzheimer's disease. Clin Neurophysiol 112: 827–835. [DOI] [PubMed] [Google Scholar]
- Jin SH, Kwon YJ, Jeong JS, Kwon SW, Shin DH ( 2006a): Differences in brain information transmission between gifted and normal children during scientific hypothesis generation. Brain Cogn 62: 191–197. [DOI] [PubMed] [Google Scholar]
- Jin SH, Kwon YJ, Jeong JS, Kwon SW, Shin DH ( 2006b): Increased information transmission during scientific hypothesis generation: Mutual information analysis of multichannel EEG. Int J Psychophysiol 62: 337–344. [DOI] [PubMed] [Google Scholar]
- Kantz H, Schreiber T ( 2000): Nonlinear Time Series Analysis. Cambridge University Press. [Google Scholar]
- Kreuz T ( 2004): Measuring synchronization in model systems and electroencephalographic time series from epilepsy patients, Doctoral dissertation. Document publicly available at http://www.fz-juelich.de/nic-series/NIC-Series-e.html.
- Lucchesia LM, Pompéiaa S, Manzanob GM, Kohnc AF, Galduroza JFC, Buenoa OFA ( 2003): Flunitrazepam‐induced changes in neurophysiological, behavioural, and subjective measures used to assess sedation. Prog Neuropsychopharmacol Biol Psychiatry 27: 525–533. [DOI] [PubMed] [Google Scholar]
- Malizia AL, Nutt DJ ( 1995): Psychopharmacology of benzodiazepines—An update. Hum Psychopharmacol 10: 1–14. [Google Scholar]
- Na SH, Jin SH, Kim SY, Ham BJ ( 2002): EEG in schizophrenic patients: Mutual information analysis Clin Neurophysiol 113: 1954–1960. [DOI] [PubMed] [Google Scholar]
- Na SH, Jin SH, Kim SY ( 2006): The effects of total sleep deprivation on brain functional organization: Mutual information analysis of waking human EEG. Int J Psychophysiol 62: 238–242. [DOI] [PubMed] [Google Scholar]
- Nolte G, Wheaton OBL, Mari Z, Vorbach S, Hallett M ( 2004): Identifying true brain interaction from EEG data using the imaginary part of coherency. Clin Neurophysiol 115: 2292–2307. [DOI] [PubMed] [Google Scholar]
- Nunez PL, Srinivasan R ( 2006): Electric Fields of the Brain: The Neurophysics of EEG. Oxford University Press. [Google Scholar]
- Palus M ( 1996a): Detecting nonlinearity in multivariate time series. Phys Lett A 213: 138–114. [Google Scholar]
- Palus M ( 1996b): Nonlinearity in normal human EEG: Cycles, temporal asymmetry, nonstationarity and randomness, not chaos. Biol Cybern 75: 389–396. [DOI] [PubMed] [Google Scholar]
- Pereda E, Quiroga RQ, Bhattacharya J ( 2005): Nonlinear multivariate analysis of neurophysiological signals. Prog Neurobiol 77: 1–37. [DOI] [PubMed] [Google Scholar]
- Polunina AG, Davydov DM ( 2006): EEG correlates of Wechsler adult intelligence scale. Int J Neurosci 116: 1231–1248. [DOI] [PubMed] [Google Scholar]
- Prichard D, Theiler J ( 1994): Generating surrogate data for time series with several simultaneously measured variables. Phys Rev Lett 73: 951–954. [DOI] [PubMed] [Google Scholar]
- Quiroga RQ, Kraskov A, Kreuz T ( 2002): Grassberger performance of different synchronization measures in real data: A case study on electroencephalographic signals. Phys Rev E 65: 041903. [DOI] [PubMed] [Google Scholar]
- Riba J, Barbanoj MJ ( 2008): Drugs and neurophysiological measures, a bidirectional relationship. Int J Psychophysiol 69: 158. [Google Scholar]
- Romano M, Borja E, Chao C, del Río Y, Corsi M ( 2002): Effect of diazepam on EEG power and coherent activity: Sex differences. Psychoneuroendocrinology 27: 821–833. [DOI] [PubMed] [Google Scholar]
- Romero S, M. A. Mañanas MA, Barbanoj MJ ( 2008): A comparative study of automatic techniques for ocular artifact reduction in spontaneous EEG signals based on clinical target variables: A simulation case. Comput Biol Med 38: 348–360. [DOI] [PubMed] [Google Scholar]
- Saletu B, Pakesch G ( 1987): Recent advances in the clinical pharmacology of benzodiazepines, Part 1: Pharmacokinetics. Hum Psychopharmacol 2: 3–10. [Google Scholar]
- Saletu B, Anderer P, Kinsperger K, Grünberger J ( 1987): Topographic brain mapping of EEG in neuropsychopharmacology, Part 2: Clinical applications (pharmaco‐EEG imaging). Meth Find Exp Clin Pharmacol 9: 385–408. [PubMed] [Google Scholar]
- Sampaio I, Puga F, Veiga H, Cagy M, Piedade R, Ribeiro P ( 2007): Influence of bromazepam on cortical interhemispheric coherence. Arq Neuropsiquiatr 65: 77–81. [DOI] [PubMed] [Google Scholar]
- Schreiber T, Schmitz A ( 2000): Surrogate time series. Phys D 142: 346–382. [Google Scholar]
- Shanbao T, Bezerianos A, Malhotra A, Yisheng Z, Thakor N ( 2003): Parameterized entropy analysis of EEG following hypoxic‐ischemic brain injury. Phys Lett A 314: 354–361. [Google Scholar]
- Srinivasan V, Eswaran C, Sriraam N ( 2007): Approximate entropy‐based epileptic EEG detection using artificial neural networks. IEEE Trans Inf Technol Biomed 11: 288–295. [DOI] [PubMed] [Google Scholar]
- Stam CJ ( 2005): Nonlinear dynamical analysis of EEG and MEG: Review of an emerging field. Clin Neurophysiol 116: 2266–2301. [DOI] [PubMed] [Google Scholar]
- Stam CJ, van Capellen van Walsum AM, Pijnenburg YA, Berendse HW, de Munck JC, Scheltens P, van Dijk BW ( 2002): Generalized synchronization of MEG recordings in Alzheimer's disease: Evidence for involvement of the gamma band. J Clin Neurophysiol 19: 562–574. [DOI] [PubMed] [Google Scholar]
- Stam CJ, Breakspear M, van Capellen van Walsum AM, van Dijk BW ( 2003): Nonlinear synchronization in EEG and whole‐head MEG recordings of healthy subjects. Hum Brain Mapp 19: 63–78. [DOI] [PMC free article] [PubMed] [Google Scholar]
- Stille G, Herrmann WM ( 1982): Guidelines for pharmaco‐EEG studies in man. Pharmacophychiatry 15: 107–108. [Google Scholar]
- Tan X, Uchida S, Matsuura M, Nishihara K, Iguchi Y, Kojima T ( 1998): Benzodiazepine effects on human sleep EEG spectra: A comparison of triazolam and flunitrazepam. Life Sci 63: 675–684. [DOI] [PubMed] [Google Scholar]
- Teplan M, Krakovska A, Stolc S ( 2006): EEG responses to long‐term audio‐visual stimulation. Int J Psychophysiol 59: 81–90. [DOI] [PubMed] [Google Scholar]
- Theiler J, Eubank S, Longtin A, Galdrikian B, Farmer JD ( 1992): Testing for nonlinearity in time series: The method of surrogate data. Phys D 58: 77–94. [Google Scholar]
- Vigon L, Saatchi MR, Mayhew JEW, Fernandes R ( 2000): Quantitative evaluation of techniques for ocular artefact filtering of EEG waveforms. IEE Proc Sci Meas Technol 147: 219–228. [Google Scholar]
- Warrington SJ ( 1997): Ethical aspects of research in healthy volunteers In: O'Grady J, Joubert PH, editors. Handbook of Phase I/II Clinical Drug Trials. Boca Raton: CRC Press; pp 103–110. [Google Scholar]
- Zhaojun X, Jia L, Song L, Baikun W ( 2006): Using ICA to remove eye blink and power line artifacts in EEG. First Int Conf Innov Comput Inf Cont 3: 107–110. [Google Scholar]