

Abstract
Magnetoencephalography (MEG), in which magnetic fields generated by brain activity are recorded outside of the head, is now in routine clinical practice throughout the world. MEG has become a recognized and vital part of the presurgical evaluation of patients with epilepsy and patients with brain tumors. We review investigations that show an improvement in the postsurgical outcomes of patients with epilepsy by localizing epileptic discharges. We also describe the most common clinical MEG applications that affect the management of patients, and discuss some applications that are close to having a clinical impact on patients. Hum Brain Mapp, 2009. © 2009 Wiley‐Liss, Inc.
Keywords: MEG, EEG, imaging, brain tumors, epilepsy, presurgical mapping, interictal, ictal, eloquent cortex, motor
INTRODUCTION
Magnetoencephalography (MEG) has become an indispensible diagnostic technology and aids in treatment decisions for patients. Although MEG has been applied most commonly to neurosurgical patients, and particularly in patients with epilepsy and brain tumors, it also reveals how the brain processes information normally, such as in language and memory. MEG is now a widely accepted diagnostic tool in evaluating patients with epilepsy who are not responding to antiseizure medications (also known as medically refractory epilepsy). Recent clinical studies, reviewed below, demonstrate that taking MEG into account in the clinical management can improve the postsurgery outcomes of these patients. In this mini review we concentrate on the clinical applications of MEG that currently affect clinical management of patients, including mapping eloquent cortex and epileptic discharges. We also briefly review some clinical research studies that currently are performed on patients to study the underlying neural mechanisms for brain disorders such as schizophrenia, but are not used for clinical decisions. As the utility of MEG continues to evolve, the distinction between these categories is changing. Some applications that are on the cusp of clinical use are reviewed here alongside those that are in clinical practice. Throughout, we emphasize applications that take advantage of the high temporal resolution of MEG.
BASIC MEG METHODOLOGY
The basic measurement of MEG is the magnetic field, in the range of femto‐ to picotesla, as a function of time, typically with a sampling rate of 1 kHz [Hamalainen et al., 1993]. To improve the signal‐to‐noise ratio, averaging tens or hundreds of event‐related responses is often necessary. In some situations it is also possible to average epileptic spikes in the spontaneous or raw MEG data. Examination of the quality of raw MEG data is essential for accurate interpretation of clinical MEG data. Currently, there are no widely agreed upon standard methods for filtering and other preprocessing as there are for clinical EEG, although a number of proposals have been made [Barkley, 2004].
Even when MEG is recorded in a sophisticated magnetically shielded room, artifacts are unavoidable. Environmental, dental, eye, cardiac, and muscle artifacts are commonly found with any subjects. Patients often have specific artifacts, such as those caused by vagal nerve stimulators or cardiac pacemakers. New signal processing techniques make it possible to eliminate or drastically reduce some of these artifacts. One such technique is the Signal Space Separation (SSS) method, which can efficiently remove several types of artifacts often seen with clinical patients, for example, due to implanted electrodes and magnetized dental hardware [Taulu et al., 2005].
PRESURGICAL PLANNING
In the clinical practice today, by far the most common MEG exam is for the presurgical mapping of epilepsy. This includes localizing and characterizing epileptic discharges and mapping normally functioning eloquent cortex relative to the epileptic discharges. Essential areas, whose preservation during surgery is critical, include the motor, somatosensory, and language cortices. MEG is well suited to detect activity in a sulcal wall that may often be difficult to localize even with invasive intracranial recordings.
Localization of Epileptic Discharges
Seizures affect about 1% of the world's population during a lifetime. Epilepsy, defined as repeated episodes of seizures, is typically classified as focal (partial) or generalized. Many cases of epilepsy are generalized, in which case there are multiple epileptic sources or a general abnormality in the brain that lowers the seizure threshold. For some forms of epilepsy, the area where the seizures begin, termed the epileptogenic zone, is focal and removing that seizure focus may be curative. Without treatment, epilepsy invariably results in a decline in brain function; therefore, finding an effective treatment not only stops or reduces the seizures, but can also preserve brain function [Jokeit and Ebner, 2002]. Focal epilepsy often originates in the temporal lobe and may have a structural abnormality near the site of the seizure onset, such as mesial temporal sclerosis (scarring of the hippocampus) or cortical dysplasia so that no further evaluation is needed. However, in about a third of the surgical candidates, the exact location of the seizure focus remains unclear. MEG is useful in these clinically difficult situations.
A clinical MEG evaluation of epilepsy patients typically involves a simultaneous whole‐head MEG and EEG recording of spontaneous activity, which consists of basic rhythmic activity, sleep‐related activity, and seemingly random activity, in addition to the epileptic discharges. Localizing the source of interictal (i.e., between overt seizures) spikes present in the MEG data (see Fig. 1) has been found to provide useful information about the site of the epileptogenic zone [Tang et al., 2003]. The most common source model for epileptic discharges is the equivalent current dipole (ECD). Many MEG studies use a single ECD model near or at the peak of an epileptic discharge. However, this may not always match the location of the seizure onset. The high spatiotemporal resolution of MEG may provide more detailed information about the pathophysiology of epilepsy. In particular, source analysis using a distributed source model, such as minimum norm estimate (MNE), may be helpful in demonstrating the time‐course of cortical activation and thereby reveal the generation and propagation of epileptic activity [Shiraishi et al., 2005a, b]. Although MEG is most commonly used for capturing interictal activity, it can also localize epileptic discharges during seizures (ictal). The localization of these ictal discharges at times improves the confidence that the location of the epileptic discharges is where the seizures begin.
Figure 1.
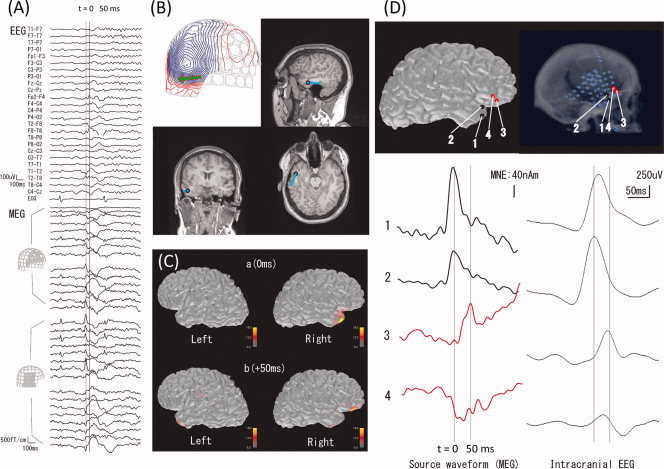
Localization of epileptic spikes. (A) Simultaneously acquired EEG (top) and MEG (bottom) signals from a patient with epilepsy. An epileptic spike is seen in MEG sensors over the right temporal and frontal regions. (B) An equivalent current dipole (ECD) computed at the peak of the spike (“0 ms”; the corresponding isocontour map of the MEG data, with the ECD as a green arrow, is shown at top left) is localized in the temporal lobe (blue dots superimposed on the anatomical MRI). (C) Distributed source estimates, the noise‐normalized minimum‐norm estimate (MNE), also known as dynamic statistical parametric map (dSPM), for the MEG data are displayed on the cortical surface representation reconstructed from anatomical MRI. The source estimates suggest that the activity propagates from a right temporal region (“0 ms”) to the right frontal region (“50 ms”). (D) Comparison of MEG data with ECoG. The left panel shows the estimated MEG source waveforms (MNE) at four locations (“1” and “2” temporal, “3” and “4” frontal). The right panel shows the ECoG of an epileptic spike at corresponding locations. The MEG and ECoG are consistent in suggesting temporal activity propagating to the frontal lobe over a 50‐ms time period.
Because of the different sensitivity patterns of MEG and electroencephalogram (EEG) (see Fig. 2), differing scalp patterns and waveforms occur between MEG and EEG even when they are simultaneously recorded. Complementary information from MEG and EEG may be particularly important in postoperative patients who have large skull defects, which can lead to sharp‐appearing activity on EEG, but has little effect on MEG [Parra et al., 2004]. The location, orientation, and spatial extent of the epileptic discharges, as well as the strength and location of other spontaneous brain activity all contribute to the sensitivity of MEG and EEG, making it difficult to predict a priori in any particular subject whether MEG or EEG will be most helpful. Studies that investigate the regional sensitivity of MEG and EEG suggest that MEG is more sensitive for some areas of the brain compared with EEG, such as the superficial frontal lobe [Goldenholz et al., 2009; Hillebrand and Barnes, 2002]. This suggests that MEG is most likely to be useful for superficial cortex (i.e., the neocortex), and is thus especially useful in patients with neocortical epilepsy. Studies of simultaneous MEG and EEG have shown complementary performance in epileptic spike detection [de Jongh et al., 2005; Knake et al., 2006; Ramantani et al., 2006].
Figure 2.
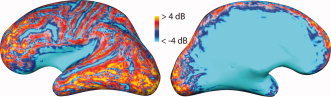
Relative signal‐to‐noise ratio (SNR) of cortical sources in MEG and EEG. The color coding indicates regions where the expected SNR of a focal cortical sources is larger in MEG than in EEG (red and yellow) or vice versa (blue). Lateral (left) and medial (right) view of an inflated representation of the left‐hemisphere cerebral cortex is shown. Maps like this help to understand why epileptic spikes and other cortical activity may at times be detectable only in MEG or only in EEG but not necessarily in both. SNR was calculated from a forward model as the logarithm of the sum across all sensors of the ratio of measured signal from a unit source divided by the noise variance on the sensor, divided by the number of sensors (from Goldenholz et al., Hum Brain Mapp, 2009, 30, 1077–1086, © Wiley‐Liss, reproduced by permission).
MEG improves clinical management and postsurgical outcome of surgical epilepsy patients
In the last few years, a number of studies have demonstrated that the addition of MEG to the standard clinical evaluation of medically refractory epilepsy patients improves the quality of medical care. Perhaps most importantly, MEG improved the outcomes of surgery, such as being seizure free 6 months after surgery, indicating that including the MEG in the evaluation of surgical epilepsy increased the likelihood of surgical success [Knowlton, 2008; Knowlton et al., 2008a, b]. In other studies, MEG has been demonstrated to provide nonredundant information in between one fifth and one third of the epilepsy cases that were performed during the presurgical evaluation [Knake et al., 2006; Sutherling et al., 2008].
Somatomotor Cortex Identification
The central sulcus is an important landmark for neurosurgeons, since damage to the motor cortex during a surgical resection can result in the paralysis of the patient. The somatomotor cortex may be identified during surgery by the electrocorticogram (ECoG) of sensory‐evoked potentials, sometimes combined with intraoperative ultrasound, making it possible to successfully remove tumors in or near the central sulcus [Firsching et al., 1992]. ECoG involves placing an electrode on the cortical surface. This is invasive and must be done in the operating room while the patient is under anesthesia, which carries some risk to the patient. Hence, noninvasive methods, such as MEG, to localize the somatomotor cortex are desirable. MEG can be used to identify the somatosensory cortex (normally located in the postcentral gyrus) or the motor cortex (in the precentral gyrus). Clinically it is important to determine whether a mass lesion distorts the central sulcus, and whether the motor cortex is displaced anteriorly or posteriorly. MEG is well suited for this purpose, even in the face of hemodynamic compromise that may, for example, complicate the interpretation of functional magnetic resonance imaging (fMRI) results.
Somatosensory cortex
The primary somatosensory cortex can be located with MEG using a tactile or electrical stimulator. The somatosensory homunculus can be mapped by successive tactile stimulation of finger digits, foot digits, and lip. If an electrical nerve stimulator is used, the electrodes are placed on the respective peripheral nerves (e.g., median, tibial, etc), and the intensity set such that muscle twitching is barely elicited. With the median nerve electrical stimulation, the early N20m component of the evoked magnetic field is easily detected in nearly all patients, including ones under deep anesthesia or in a coma. The N20m generator is normally located in the anterior wall of the postcentral gyrus (Brodmann area 3b), with a tangential orientation, well suited for detection with MEG. Usually the primary somatosensory cortex is localized by determining an ECD model location of the N20m.
MEG identification of the somatosensory cortex has been validated by several groups using intraoperative measurements [e.g., Gallen et al., 1993; Kamada et al., 1993]. Schiffbauer et al. [ 2001] found that regardless of the tumor grade, intra‐axial brain tumors may border on or invade the somatosensory or auditory cortex. Interestingly, low‐grade tumors were more likely than high‐grade tumors to involve the functionally viable cortex. Low‐grade tumors, due to slow growth, more often demonstrate functional activity within the radiologically abnormal areas, than high‐grade tumors. High‐grade (aggressive) tumors, on the other hand, often show functional activity at the margins. These findings suggest physical displacement of the functional tissue due to mass effect of the high‐grade tumor, rather than invasion. Firsching et al. [ 2002] reported that in 30 patients, ECD for the tactile neuromagnetic response localized in the somatosensory cortex, and was without exception in agreement with ECoG phase reversal measured at the time of surgery. The magnitude and latency of evoked fields in brain tumor patients with known sensory or motor deficits may be diminished, yielding clues to the degree of invasion or destruction of eloquent cortex. In addition to mapping the location of the normal somatosensory cortex, the somatosensory evoked field (SEF) can be used to identify abnormally functioning cortex, for example, by detecting the so‐called giant SEF in patients with myoclonus epilepsy [Uesaka et al., 1993].
Motor cortex
Many functional imaging techniques, such as fMRI and positron emission tomography (PET), can accurately identify the somatomotor cortex. However, isolating pure motor activity, for example, of the precentral gyrus with fMRI and PET is difficult due to inevitable activation of the adjacent somatosensory cortex and the entire motor network. The high temporal resolution of MEG can be used to dissociate activity in different brain areas. The precise timing of the onset of motor movement, e.g., a self‐paced button press or by squeezing an object can be used to average the event‐related magnetic fields. The primary motor cortex is identified by localizing the neuromagnetic activity that peaks between 20 and 50 ms before the onset of movement, as measured by electromyogram (EMG) surface electrodes.
Another method to identify the motor cortex is with the help of a coherence analysis relating the MEG signal with the EMG waveform [for a review see Mima and Hallett, 1999] recorded with bipolar electrodes over the first interosseous muscle, while the patient displaces the index finger laterally against the thumb (see Fig. 3). The MEG‐EMG coherence spectrum has a peak centered near 20 Hz. This represents synchronization of muscle subunit twitches with the 20 Hz component of the cerebral “mu” rhythm, the source of which is in the motor cortex [Salenius et al., 1996]. This method can be used for both proximal and distal muscle groups, including the trunk musculature. MEG‐EMG coherence and source analysis can also identify the entire neural network activated during the planning and the act of motor movement, including supplementary cortex, premotor cortex, thalamus and even cerebellum [Gross et al., 2001].
Figure 3.
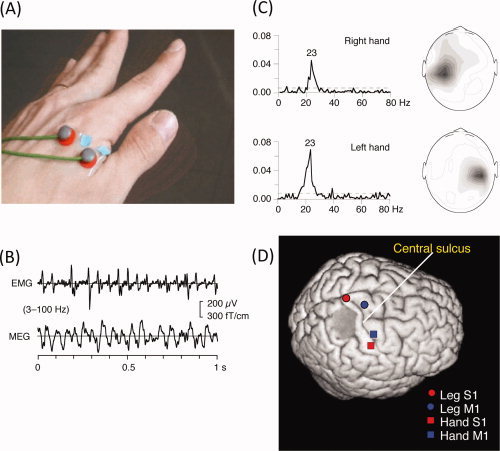
Motor cortex localization using MEG‐EMG coherence. (A) Placement of the surface bipolar electromyogram (EMG) electrodes on the first interossesous muscle. (B) Waveforms of EMG and MEG (from a sensor over the motor cortex). (C) Coherence between the EMG and MEG signals as a function of frequency. (D) Locations of equivalent current dipoles in the right primary motor cortex, obtained by localizing the peak coherence (∼20 Hz). (B) and (C) From Salenius et al., J Neurophysiol, 1997, 77, 3401–3405, © American Physiological Society, reproduced by permission. (D) From Makela et al., Hum Brain Mapp, 2001, 12, 180–192, © Wiley‐Liss, reproduced by permission.
Language Cortex
For patients undergoing surgery in the perisylvian region, or mesial temporal lobe, finding the cerebral hemisphere that is dominant in language is essential. Language representation is usually in the left cerebral hemisphere, termed “left hemispheric dominance.” Language pathology has also been studied with MEG, although it has been mainly done for research purposes [Salmelin, 2007]. For example, dyslexic adults have impaired reading processing, although the visual feature processing is unaffected. Here we concentrate on the presurgical mapping and lateralizing language cortex.
The intracarotid injection of amobarbital, known as the Wada test, is considered the gold standard for determination of hemispheric dominance. In their original study, Wada and Rasmussen [ 1960] found that more than 93% of all patients, and more than 96% of right‐handed patients were left hemispheric language dominant, although recent studies suggest that many patients have a more bilateral representation of language than in the original studies. In patients with brain pathology, the pattern of lateralization changes. In left‐handed epilepsy patients, about 70% of patients were reported to demonstrate left hemispheric dominance for language, and about 15% of epilepsy patients have bilateral language lateralization. The Wada test is a minimally invasive procedure that carries a small but finite risk to the patient. Further, the Wada test has been criticized because of potential cross‐flow to the contralateral hemisphere, and the lack of testing of the occipital lobes and portions of the temporal lobe (territory supplied by the posterior circulation). Source localization methods applied to language‐related MEG and EEG data can be used to noninvasively determine the language lateralization. The overall concordance of MEG with Wada tests is reported to be around 90% and the sensitivity 90–100% with a specificity between 70% and 100% [Papanicolaou et al., 2004]. Closely related to language mapping, MEG may also be used for lateralization and localization of semantic memory‐related activity. There are fewer reports of MEG mapping for memory than for language, but it is increasingly being used clinically [Papanicolaou et al., 2002].
It is important to understand how modern functional neuroimaging methods such as MEG, as well as EEG, fMRI and PET, differ fundamentally from Wada tests and other invasive mapping techniques. Although general mapping of language‐related brain areas is of great interest scientifically, the practical needs of the presurgical workup are different from a basic research approach. First, the neurosurgical application requires precise localization and lateralization of language in an individual, yet the neuroscientist can average the response over several subjects in order to increase the signal‐to‐noise ratio of even small activations. Second, the neurosurgeon usually requires mapping of the essential language areas, not just those that participate in language. Removal of essential language areas will result in a language deficit. Participating areas are activated during language tasks, but do might not result in a postoperative language deficit after resection, either because there is redundant processing or because other areas take over the function. Neuroimaging methods, including MEG, fMRI and PET directly measure participating areas, which likely includes the essential cortices, although not exclusively. The task chosen for the MEG can influence the ability to identify the essential language areas. The specific procedures for determining hemispheric dominance or regional language processing depend on the ability of the patient to follow instructions. Semantic decision tasks that require a response from the patient, such as a forced binary decision, are often used clinically since they allow for monitoring the patient's performance. Other techniques might be able to estimate the location of essential cortex (e.g., transcranial magnetic stimulation or TMS).
The same source localization techniques used for determining hemispheric dominance can also be applied to regional language mapping. Equivalent current dipoles can be used to estimate activity in both the posterior (Wernicke's area, in the posterior temporal lobe) and the anterior (Broca's area, in the frontal operculum) language areas. MEG‐based maps of language‐related activation have similar profiles as determined by invasive electrocorticography (ECoG). The latency of the evoked activity in Wernicke's area (receptive language) is typically between 200 and 400 ms, and Broca's area (productive language) 400 and 1,000 ms, depending on the individual subject and the particular language task. Combining visual, auditory, and picture naming techniques may provide an even more powerful paradigm for determining the language lateralization with MEG.
Sequential dipole fitting analysis of MEG data is often used to determine language dominance for clinical purposes due to its ease of implementation and robust results. Papanicolaou et al. [ 1999] proposed a set of criteria to accept ECD at each time point within a latency window. The lateralization index (LI) is calculated as the difference in the number of accepted ECDs in the left and right hemispheres, and normalizing by the total number of ECD accepted (see Fig. 4). Multiple reports show a strong correlation of this method with both intraoperative mapping techniques [Kamada et al., 2007a] and the results of the Wada test [reviewed in Salmelin, 2007]. Kober et al. [ 2001] proposed using a spatial filter that localizes simultaneously active sources, Continuous Localization by Spatial Filtering (CLSF), to determine language hemispheric dominance. In CLSF the brain is parcellated into approximately 6,000 elementary sources and the current produced in each elementary source is calculated, and the LI is calculated by comparing the source current strengths in each hemisphere.
Figure 4.
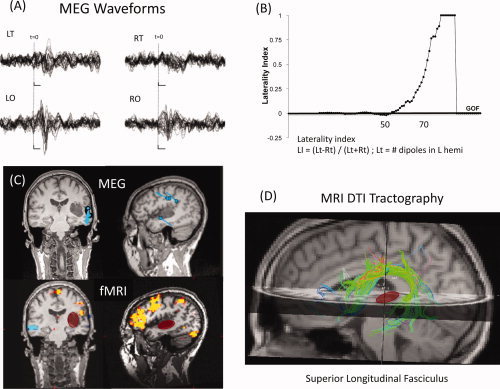
Multimodal imaging of language (MEG, fMRI, and DTI). (A) MEG waveforms for left and right temporal (LT and RT, respectively) and occipital (LO, RO) sensors, showing evoked responses to a language task. (B) Laterality index as a function of goodness of fit (GOF) of a sequential equivalent current dipole (ECD) fit to the MEG data, suggesting left‐hemisphere dominance. (C) Locations of the ECDs for the MEG data (top) and functional MRI (bottom) for a visual reading task, displayed in coronal and sagittal slices of an anatomical MRI. Note the cluster of MEG dipoles in the posterior superior temporal gyrus, presumably including Wernicke's area. Functional MRI shows largest activation in the inferior lateral left frontal cortex. The location of a tumor in the left temporal lobe is highlighted with the red oval. (D) MRI tractography showing the superior longitudinal fasciculus (SLF), which includes the arcuate fasciculus, that connects temporal and frontal language areas. Note that the tumor (red) does not interrupt or displace the SLF white matter fiber bundle. (Case courtesy of Drs. Emad Eskandar, M.D., Ph.D. and Andrew Cole, M.D., of Massachusetts General Hospital).
Auditory stimulus paradigms can be used for both language mapping as well as for localizing and characterizing early auditory process. A large deviation in the amplitude or latency of an early auditory‐evoked response suggests cortical dysfunction, such as the result of cortical damage from a tumor, stroke, or repeated seizures. Other basic research studies suggest that some fundamental dysfunctions of the auditory cortex make MEG well positioned to aid in the diagnosis and characterization of schizophrenia, dyslexia, and other disorders [for a review see Reite et al., 1999]. Early auditory responses have some language content, such as phonetic and lexical processing. Related to this early activity, in the time 100–200ms is the auditory mismatch potential and mismatch field. The mismatch response has diverse clinical applications that are close to meeting the threshold for use that affects the diagnosis and treatment of patients [Reite et al., 1999]. The mismatch response to even simple stimuli such as to tone pips is markedly different in many schizophrenic patients and may relate to the underlying cortical dysfunction.
Neuronavigation
Adoption of MEG for neurosurgical applications has been facilitated by the coregistration of MEG source analysis with structural MRI. This allows the functional information to be brought into the neurosurgical suite. A neuronavigational system allows the neurosurgeon to use a pointer device to find functional cortex that was identified in the preoperative imaging. Frameless stereotactic systems accurately locate small, deep tumors or other lesions during neurosurgery, with a precision approaching 2 mm. Ganslandt et al. [ 1999] combined MEG somatosensory mapping with a free‐hand stereotactic pointing device in 25 cases of perirolandic tumors and masses. They found agreement with intraoperative somatosensory‐evoked potential in all cases. Rezai et al. [ 1997] report that combining MEG‐derived functional mapping, CT scans, MRI, and digital angiography leads to a reduction in surgical risk and minimizes functional morbidity. Sources of error in localization include precision of fiducial markers, registration of functional and structural MRIs, shift of brain contents, and inaccuracy in the MEG inverse solutions. To allow the neurosurgeon to account for the shift of brain contents during an operation, inclusion of the sulcal landmarks on 3D reconstructions aid in accurate reregistration of fMRI, MEG, and MRI diffusion tensor imaging (DTI) white matter tractography results (see Fig. 4D).
OTHER CLINICAL RESEARCH WITH MEG
Many of the current applications that affect patient management focus on localizing brain function, usually in the context of removing a neurosurgical lesion. This is valuable and continues to make MEG a useful tool for neurologists and neurosurgeons. Still, if the technology is to continue to thrive, expansion of the clinical use of MEG is needed. We have already reviewed a few clinical and research applications of MEG that are near clinical acceptance; we will now review some other applications that might be considered more distant from clinical adoption. There are hundreds of studies that have applied MEG and EEG to understand and potentially diagnose a variety of human brain diseases. Rather than an exhaustive review, we wish to highlight a few innovative approaches to study brain rhythms (oscillations), brain connectivity, and multimodal imaging that emphasize high temporal resolution and that have the potential to have a direct clinical impact in the future.
Oscillatory Activity
The brain encodes information in spatiotemporal patterns of neural assemblies. Importantly from the clinical point of view, alterations in the spectral content of neural signals in characteristic frequency bands are linked to alterations in specific biochemical changes in the brain—both in the white matter and in cortical and subcortical neurotransmitter systems. Disruption of cortical oscillations may explain some of the cognitive deficits in learning disorders, depression, and schizophrenia [Engel and Singer, 2001]. In epilepsy applications, high‐frequency activity (>50 Hz and up to 500 Hz with depth electrodes) correlates better with epileptogenic areas than does the peak of epileptic discharges in some cases [Ramachandrannair et al., 2008]. In the temporal lobe these are termed ripples and are often found on the affected hemisphere in ictal ECoG and MEG.
Brain oscillations, emanating from subcortical and cortical structures, are especially important in memory formation and retrieval, which may be abnormal in diseased brains. The theta rhythm, an oscillation at 4–8 Hz, originates in both the hippocampus and the cerebral cortex, and encodes memory and spatial navigation. Neural activity in the gamma frequency band (greater than 30 Hz and sometimes centered near 40 Hz) has been hypothesized to reflect the synchronization of neural assemblies involved in the binding of object features within a single sensory modality or across sensory modalities [Engel and Singer, 2001]. There is evidence of specific frequency alterations in the ability of the neural response to follow an auditory stimulus at 40 Hz and 20 Hz (steady‐state auditory response) in schizophrenia [Vierling‐Claassen et al., 2008].
In cognitive tasks, both the spectral power and the phase relationships of the neural signals are modulated. The first signal identified in both EEG and MEG was the 8–10 Hz alpha rhythm—an oscillation that dominates raw tracings. The alpha‐band power increases when the eyes are closed, and decreases when the eyes are opened or during intense mental activation. In healthy subjects, declarative memory encoding and retrieval are associated with increased gamma‐band activity and increased theta frequency band [Osipova et al., 2005]. In patients with Alzheimer's disease and mild cognitive impairment MCI have decreased power in the alpha and beta (15–30 Hz) bands during declarative memory tasks [Osipova et al., 2005].
Connectivity
Brain connectivity includes functional and effective connectivity [Friston and Frith, 1995]. Functional connectivity shows correlations of activity across brain regions, whereas effective connectivity measures the influence of brain regions on each other. Corticomuscular coherence described above is a type of functional connectivity of the motor cortex and the muscle subunits (see Fig. 3). Abnormalities in brain connectivity may result in brain dysfunction, with the quintessential example being epilepsy. Abnormally high functional or effective connectivity across small distances might be a factor in epileptic spike generation. Increased connectivity across brain areas has been hypothesized to be responsible for the propagation and generalization of epileptic discharges. On the other hand, a failure of integration of perceptions might suggest a failure in “binding” object features within and across brain regions, which may lead to psychiatric diseases such as schizophrenia.
Functional connectivity in the brain occurs at various time scales. Functional connectivity using temporal correlations has made it possible to map neural networks, such as the motor system with fMRI, although the temporal resolution is on the order of seconds [Fox and Raichle, 2007]. The high temporal resolution of MEG and EEG makes it possible to perform connectivity analysis at a high temporal resolution (see Fig. 5). Functional connectivity, using the high temporal resolution of MEG and EEG, has been useful in defining epileptogenic cortex (see Lin et al., this issue), as well as in examining abnormal patterns of activity in Parkinson's disease, schizophrenia [Spencer et al., 2008], and other brain disorders.
Figure 5.
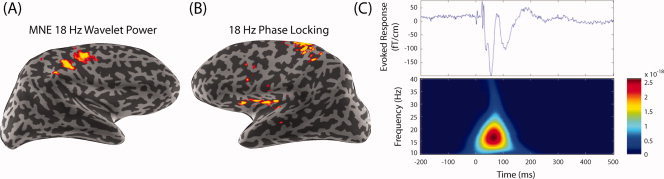
Spectral spatiotemporal mapping of the somatosensory system. (A) The 18‐Hz wavelet‐based spectral spatiotemporal maps using minimum‐norm estimate (MNE) in the right hemisphere (left‐hand median nerve stimulation). (B) Transhemispheric phase locking between the primary somatosensory cortex (SI) and the contralateral secondary somatosensory cortex (SII). Based on the maximal power dipole in the right hemisphere, a left‐hemisphere phase‐locking (phase synchrony) map shows 18‐Hz synchrony of the right SI and left SII. (C) For the somatosensory‐evoked response by median nerve stimulation, the evoked response is found in the contralateral hemisphere with an initial peak at ∼20 ms (upper panel). The spectrogram shows a burst centered around 18 Hz and peaking in magnitude at about 85 ms after the mean nerve was stimulated (lower panel) (From Lin et al., Neuroimage, 2004, 23, 582–595, © Academic Press, reproduced by permission).
Multimodal Imaging
The millisecond temporal resolution, achievable with MEG and EEG, is important in understanding how information is processed in the brain. Despite the spatial accuracy of MEG and EEG approaching a few millimeters in certain situations, fMRI has a superior overall spatial resolution. In order to enhance the MEG source estimates, spatial information provided by other measures, such as fMRI can be used to guide the MEG inverse solution [e.g., Ahlfors and Simpson, 2004; Dale et al., 2000].
The physiologic differences in mechanisms generating the fMRI and MEG/EEG signal suggest which modality might be most useful for a particular clinical application. MEG and fMRI may have complementary sensitivity patterns. For example, in language mapping, MEG has been found to detect lateralization differences in the middle temporal gyrus, whereas fMRI has been found to detect differences in the frontal lobes [Billingsley‐Marshall et al., 2007]. MEG is useful in cases with compromised hemodynamic compensatory mechanisms, such as arteriovenous malformations and, importantly, tumors. Tumors with edema mass effect that lead to a disruption of normal hemodynamic response may lead to an incorrect localization with fMRI. Thus, abnormal vascular supply may decrease the hemodynamic response measured by fMRI. MEG is helpful in these cases.
Coregistering MEG with diffusion tensor images, including tractography, aids in the visualization of frontotemporal language white matter fiber bundles relative to activations and pathology (See Fig. 4D) [Kamada et al., 2007b]. Diffusion tensor MRI (DTI) measures white matter integrity, including the density of myelination. The interindividual differences in the latency of the neuromagnetic‐evoked fields and DTI images can lead to an understanding of networks of white matter connectivity [Stufflebeam et al., 2008]. Specifically, subjects with shorter‐latency MEG peaks have reduced myelination detectable on DTI, likely related to more rapid conduction due to increased myelination in the participating fiber bundles.
CONCLUSIONS AND FUTURE DIRECTIONS
Before the medical community accepts new clinical MEG applications, they must be validated. Perhaps more importantly, the clinical value above the best current clinical evaluation must be shown. This has been accomplished by MEG in the presurgical evaluation of patients with epilepsy. Beyond epilepsy and the presurgical mapping of eloquent cortex, clinical research studies suggest that MEG can be applied to a diverse spectrum of diseases, and some of the critical validation studies are underway. This includes studies in aphasia, autism, and schizophrenia, and others. Combining MEG, EEG, fMRI and new methods of connectivity are also being evaluated for clinical applications. These studies will continue to change how MEG and EEG are used.
REFERENCES
- Ahlfors SP,Simpson GV ( 2004): Geometrical interpretation of fMRI‐guided MEG/EEG inverse estimates. Neuroimage 22: 323–332. [DOI] [PubMed] [Google Scholar]
- Barkley GL ( 2004): Controversies in neurophysiology. MEG is superior to EEG in localization of interictal epileptiform activity: Pro. Clin Neurophysiol 115: 1001–1009. [DOI] [PubMed] [Google Scholar]
- Billingsley‐Marshall RL,Clear T,Mencl WE,Simos PG,Swank PR,Men D,Sarkari S,Castillo EM,Papanicolaou AC ( 2007): A comparison of functional MRI and magnetoencephalography for receptive language mapping. J Neurosci Methods 161: 306–313. [DOI] [PubMed] [Google Scholar]
- Dale AM,Liu AK,Fischl BR,Buckner RL,Belliveau JW,Lewine JD,Halgren E ( 2000): Dynamic statistical parametric mapping: Combining fMRI and MEG for high‐resolution imaging of cortical activity. Neuron 26: 55–67. [DOI] [PubMed] [Google Scholar]
- de Jongh A,de Munck JC,Goncalves SI,Ossenblok P ( 2005): Differences in MEG/EEG epileptic spike yields explained by regional differences in signal‐to‐noise ratios. J Clin Neurophysiol 22: 153–158. [DOI] [PubMed] [Google Scholar]
- Engel AK,Singer W ( 2001): Temporal binding and the neural correlates of sensory awareness. Trends Cogn Sci 5: 16–25. [DOI] [PubMed] [Google Scholar]
- Firsching R,Bondar I,Heinze HJ,Hinrichs H,Hagner T,Heinrich J,Belau A ( 2002): Practicability of magnetoencephalography‐guided neuronavigation. Neurosurg Rev 25: 73–78. [DOI] [PubMed] [Google Scholar]
- Firsching R,Klug N,Borner U,Sanker P ( 1992): Lesions of the sensorimotor region: Somatosensory evoked potentials and ultrasound guided surgery. Acta Neurochir (Wien) 118: 87–90. [DOI] [PubMed] [Google Scholar]
- Fox MD,Raichle ME ( 2007): Spontaneous fluctuations in brain activity observed with functional magnetic resonance imaging. Nat Rev Neurosci 8: 700–711. [DOI] [PubMed] [Google Scholar]
- Friston KJ,Frith CD ( 1995): Schizophrenia: A disconnection syndrome? Clin Neurosci 3: 89–97. [PubMed] [Google Scholar]
- Gallen CC,Sobel DF,Waltz T,Aung M,Copeland B,Schwartz BJ,Hirschkoff EC,Bloom FE ( 1993): Noninvasive presurgical neuromagnetic mapping of somatosensory cortex. Neurosurgery 33: 260–268; discussion 268. [PubMed] [Google Scholar]
- Ganslandt O,Fahlbusch R,Nimsky C,Kober H,Moller M,Steinmeier R,Romstock J,Vieth J ( 1999): Functional neuronavigation with magnetoencephalography: Outcome in 50 patients with lesions around the motor cortex. J Neurosurg 91: 73–79. [DOI] [PubMed] [Google Scholar]
- Goldenholz DM,Ahlfors SP,Hamalainen MS,Sharon D,Ishitobi M,Vaina LM,Stufflebeam SM ( 2009): Mapping the signal‐to‐noise‐ratios of cortical sources in magnetoencephalography and electroencephalography. Hum Brain Mapp 30: 1077–1086. [DOI] [PMC free article] [PubMed] [Google Scholar]
- Gross J,Kujala J,Hamalainen M,Timmermann L,Schnitzler A,Salmelin R ( 2001): Dynamic imaging of coherent sources: Studying neural interactions in the human brain. Proc Natl Acad Sci USA 98: 694–699. [DOI] [PMC free article] [PubMed] [Google Scholar]
- Hamalainen M,Hari R,Ilmoniemi RJ,Knuutila J,Lounasmaa OV ( 1993): Magnetoencephalography—Theory, instrumentation, and application to noninvasive studies of the working human brain. Rev Modern Phys 65: 413–497. [Google Scholar]
- Hillebrand A,Barnes GR ( 2002): A quantitative assessment of the sensitivity of whole‐head MEG to activity in the adult human cortex. Neuroimage 16: 638–650. [DOI] [PubMed] [Google Scholar]
- Jokeit H,Ebner A ( 2002): Effects of chronic epilepsy on intellectual functions. Prog Brain Res 135: 455–463. [DOI] [PubMed] [Google Scholar]
- Kamada K,Sawamura Y,Takeuchi F,Kuriki S,Kawai K,Morita A,Todo T ( 2007a): Expressive and receptive language areas determined by a non‐invasive reliable method using functional magnetic resonance imaging and magnetoencephalography. Neurosurgery 60: 296–305; discussion 305–306. [DOI] [PubMed] [Google Scholar]
- Kamada K,Takeuchi F,Kuriki S,Oshiro O,Houkin K,Abe H ( 1993): Functional neurosurgical simulation with brain surface magnetic resonance images and magnetoencephalography. Neurosurgery 33: 269–272; discussion 272–273. [DOI] [PubMed] [Google Scholar]
- Kamada K,Todo T,Masutani Y,Aoki S,Ino K,Morita A,Saito N ( 2007b): Visualization of the frontotemporal language fibers by tractography combined with functional magnetic resonance imaging and magnetoencephalography. J Neurosurg 106: 90–98. [DOI] [PubMed] [Google Scholar]
- Knake S,Halgren E,Shiraishi H,Hara K,Hamer HM,Grant PE,Carr VA,Foxe D,Camposano S,Busa E,Witzel T,Hamalainen MS,Ahlfors SP,Bromfield EB,Black PM,Bourgeois BF,Cole AJ,Cosgrove GR,Dworetzky BA,Madsen JR,Larsson PG,Schomer DL,Thiele EA,Dale AM,Rosen BR,Stufflebeam SM ( 2006): The value of multichannel MEG and EEG in the presurgical evaluation of 70 epilepsy patients. Epilepsy Res 69: 80–86. [DOI] [PubMed] [Google Scholar]
- Knowlton RC 2008: Can magnetoencephalography aid epilepsy surgery? Epilepsy Curr 8: 1–5. [DOI] [PMC free article] [PubMed] [Google Scholar]
- Knowlton RC,Elgavish RA,Bartolucci A,Ojha B,Limdi N,Blount J,Burneo JG,Ver Hoef L,Paige L,Faught E,Kankirawatana P,Riley K,Kuzniecky R ( 2008a): Functional imaging: II. Prediction of epilepsy surgery outcome. Ann Neurol 64: 35–41. [DOI] [PubMed] [Google Scholar]
- Knowlton RC,Elgavish RA,Limdi N,Bartolucci A,Ojha B,Blount J,Burneo JG,Ver Hoef L,Paige L,Faught E,Kankirawatana P,Riley K,Kuzniecky R ( 2008b): Functional imaging: I. Relative predictive value of intracranial electroencephalography. Ann Neurol 64: 25–34. [DOI] [PubMed] [Google Scholar]
- Kober H,Moller M,Nimsky C,Vieth J,Fahlbusch R,Ganslandt O ( 2001): New approach to localize speech relevant brain areas and hemispheric dominance using spatially filtered magnetoencephalography. Hum Brain Mapp 14: 236–250. [DOI] [PMC free article] [PubMed] [Google Scholar]
- Lin FH,Witzel T,Hamalainen MS,Dale AM,Belliveau JW,Stufflebeam SM ( 2004): Spectral spatiotemporal imaging of cortical oscillations and interactions in the human brain. Neuroimage 23: 582–595. [DOI] [PMC free article] [PubMed] [Google Scholar]
- Makela JP,Kirveskari E,Seppa M,Hamalainen M,Forss N,Avikainen S,Salonen O,Salenius S,Kovala T,Randell T,Jaaskelainen J,Hari R ( 2001): Three‐dimensional integration of brain anatomy and function to facilitate intraoperative navigation around the sensorimotor strip. Hum Brain Mapp 12: 180–192. [DOI] [PMC free article] [PubMed] [Google Scholar]
- Mima T,Hallett M ( 1999): Corticomuscular coherence: A review. J Clin Neurophysiol 16: 501–511. [DOI] [PubMed] [Google Scholar]
- Osipova D,Ahveninen J,Jensen O,Ylikoski A,Pekkonen E ( 2005): Altered generation of spontaneous oscillations in Alzheimer's disease. Neuroimage 27: 835–841. [DOI] [PubMed] [Google Scholar]
- Papanicolaou AC,Simos PG,Breier JI,Zouridakis G,Willmore LJ,Wheless JW,Constantinou JE,Maggio WW,Gormley WB ( 1999): Magnetoencephalographic mapping of the language‐specific cortex. J Neurosurg 90: 85–93. [DOI] [PubMed] [Google Scholar]
- Papanicolaou AC,Simos PG,Castillo EM,Breier JI,Katz JS,Wright AA ( 2002): The hippocampus and memory of verbal and pictorial material. Learn Mem 9: 99–104. [DOI] [PMC free article] [PubMed] [Google Scholar]
- Papanicolaou AC,Simos PG,Castillo EM,Breier JI,Sarkari S,Pataraia E,Billingsley RL,Buchanan S,Wheless J,Maggio V,Maggio WW ( 2004): Magnetocephalography: A noninvasive alternative to the Wada procedure. J Neurosurg 100: 867–876. [DOI] [PubMed] [Google Scholar]
- Parra J,Kalitzin SN,da Silva FH ( 2004): Magnetoencephalography: An investigational tool or a routine clinical technique? Epilepsy Behav 5: 277–285. [DOI] [PubMed] [Google Scholar]
- Ramachandrannair R,Ochi A,Imai K,Benifla M,Akiyama T,Holowka S,Rutka JT,Snead OC III,Otsubo H ( 2008): Epileptic spasms in older pediatric patients: MEG and ictal high‐frequency oscillations suggest focal‐onset seizures in a subset of epileptic spasms. Epilepsy Res 78: 216–224. [DOI] [PubMed] [Google Scholar]
- Ramantani G,Boor R,Paetau R,Ille N,Feneberg R,Rupp A,Boppel T,Scherg M,Rating D,Bast T ( 2006): MEG versus EEG: Influence of background activity on interictal spike detection. J Clin Neurophysiol 23: 498–508. [DOI] [PubMed] [Google Scholar]
- Reite M,Teale P,Rojas DC ( 1999): Magnetoencephalography: Applications in psychiatry. Biol Psychiatry 45: 1553–1563. [DOI] [PubMed] [Google Scholar]
- Rezai AR,Mogilner AY,Cappell J,Hund M,Llinas RR,Kelly PJ ( 1997): Integration of functional brain mapping in image‐guided neurosurgery. Acta Neurochir Suppl 68: 85–89. [DOI] [PubMed] [Google Scholar]
- Salenius S,Portin K,Kajola M,Salmelin R,Hari R ( 1997): Cortical control of human motoneuron firing during isometric contraction. J Neurophysiol 77: 3401–3405. [DOI] [PubMed] [Google Scholar]
- Salenius S,Salmelin R,Neuper C,Pfurtscheller G,Hari R ( 1996): Human cortical 40 Hz rhythm is closely related to EMG rhythmicity. Neurosci Lett 213: 75–78. [DOI] [PubMed] [Google Scholar]
- Salmelin R ( 2007): Clinical neurophysiology of language: The MEG approach. Clin Neurophysiol 118: 237–254. [DOI] [PubMed] [Google Scholar]
- Schiffbauer H,Ferrari P,Rowley HA,Berger MS,Roberts TP ( 2001): Functional activity within brain tumors: A magnetic source imaging study. Neurosurgery 49: 1313–1320; discussion 1320–1321. [DOI] [PubMed] [Google Scholar]
- Shiraishi H,Ahlfors SP,Stufflebeam SM,Takano K,Okajima M,Knake S,Hatanaka K,Kohsaka S,Saitoh S,Dale AM,Halgren E ( 2005a): Application of magnetoencephalography in epilepsy patients with widespread spike or slow‐wave activity. Epilepsia 46: 1264–1272. [DOI] [PubMed] [Google Scholar]
- Shiraishi H,Stufflebeam SM,Knake S,Ahlfors SP,Sudo A,Asahina N,Egawa K,Hatanaka K,Kohsaka S,Saitoh S,Grant PE,Dale AM,Halgren E ( 2005b): Dynamic statistical parametric mapping for analyzing the magnetoencephalographic epileptiform activity in patients with epilepsy. J Child Neurol 20: 363–369. [DOI] [PubMed] [Google Scholar]
- Spencer KM,Niznikiewicz MA,Shenton ME,McCarley RW ( 2008): Sensory‐evoked gamma oscillations in chronic schizophrenia. Biol Psychiatry 63: 744–747. [DOI] [PMC free article] [PubMed] [Google Scholar]
- Stufflebeam SM,Witzel T,Mikulski S,Hamalainen MS,Temereanca S,Barton JJ,Tuch DS,Manoach DS ( 2008): A non‐invasive method to relate the timing of neural activity to white matter microstructural integrity. Neuroimage 42: 710–716. [DOI] [PMC free article] [PubMed] [Google Scholar]
- Sutherling WW,Mamelak AN,Thyerlei D,Maleeva T,Minazad Y,Philpott L,Lopez N ( 2008): Influence of magnetic source imaging for planning intracranial EEG in epilepsy. Neurology 71: 990–996. [DOI] [PMC free article] [PubMed] [Google Scholar]
- Tang L,Mantle M,Ferrari P,Schiffbauer H,Rowley HA,Barbaro NM,Berger MS,Roberts TP ( 2003): Consistency of interictal and ictal onset localization using magnetoencephalography in patients with partial epilepsy. J Neurosurg 98: 837–845. [DOI] [PubMed] [Google Scholar]
- Taulu S,Simola J,Kajola M ( 2005): Applications of the signal space separation method. IEEE Trans Signal Process 53: 3359–3372. [Google Scholar]
- Uesaka Y,Ugawa Y,Yumoto M,Sakuta M,Kanazawa I ( 1993): Giant somatosensory evoked magnetic field in patients with myoclonus epilepsy. Electroencephalogr Clin Neurophysiol 87: 300–305. [DOI] [PubMed] [Google Scholar]
- Vierling‐Claassen D,Siekmeier P,Stufflebeam S,Kopell N ( 2008): Modeling GABA alterations in schizophrenia: A link between impaired inhibition and altered gamma and beta range auditory entrainment. J Neurophysiol 99: 2656–2671. [DOI] [PMC free article] [PubMed] [Google Scholar]
- Wada J,Rasmussen T ( 1960): Intracarotid injection of sodium amytal for the lateralization of cerebral speech dominance: Experimental and clinical observations. J Neurosurg 17: 266–282. [DOI] [PubMed] [Google Scholar]