

Abstract
Various functional imaging tools have been used to detect epileptic activity in the neural network underlying mesial temporal lobe epilepsy (mTLE). In the present fMRI study, a data‐driven approach was employed to map interictal epileptic activity in mTLE patients by measuring the amplitude of low‐frequency fluctuation (ALFF) of the blood oxygen level‐dependent (BOLD) signal. Twenty‐four left mTLE patients and 26 right mTLE patients were investigated by comparing with 25 healthy subjects. In the patients, the regions showing increased ALFF were consistently distributed in the mesial temporal lobe, thalamus, and a few of other cortical and subcortical structures composing a mesial temporal epilepsy network proposed previously, while the regions showing decreased ALFF were mostly located in the areas of so‐called default‐mode network. Data of simultaneous EEG‐fMRI from a portion of the patients suggested that the increases in ALFF might be associated with the interictal epileptic activity. Individual analyses based on statistic parametric mapping revealed a moderate sensitivity and a fairly high specificity for the lateralization of unilateral mTLE. We conclude that the ALFF analysis may provide a useful tool in fMRI study of epilepsy. Hum Brain Mapp, 2010. © 2010 Wiley‐Liss, Inc.
Keywords: mesial temporal lobe epilepsy, functional MRI, amplitude of low‐frequency fluctuation
INTRODUCTION
Mesial temporal lobe epilepsy (mTLE) is the most common type of medically intractable epilepsy characterized by the pathological substrate of hippocampal sclerosis (HS) and localization‐related symptoms [Engel, 2001]. Patients with mTLE can benefit from surgical treatment of anterior temporal lobectomy; therefore localization or even simply lateralization for epileptic activity is important for presurgical estimation. A recently proposed mesial temporal epilepsy network points to a new way for understanding, diagnosis and treatment of mTLE. [Spencer, 2002]. Currently, electroencephalography (EEG), positron emission tomography (PET) and single‐photon emission computed tomography (SPECT) are the most commonly used tools to detect epileptic activity. With better temporal and spatial resolutions, blood oxygenation level‐dependent (BOLD) fMRI has been broadly used as an effective non‐invasive technique for investigation of epilepsy [Gotman et al., 2006].
By employing general‐linear model analysis, most of recent fMRI studies of epilepsy were combined with simultaneous EEG measurement, which allows the observation of brain activation and deactivation induced by interictal epileptiform discharges (IEDs) [Gotman et al., 2006; Krakow et al., 2001]. Meanwhile, newly emerged data‐driven approaches provide more options for imaging data analysis with various advantages, and have been successfully applied to epilepsy studies [Chen et al., 2006; Morgan et al., 2004; Rodionov et al., 2007]. Using these data‐driven approaches, most of current fMRI studies focused on the characterization of spontaneous neuronal activities (SNA), based on the fact that there are coherent low‐frequency fluctuated BOLD signals in widespread but functionally related brain regions [Biswal et al., 1995; Fox and Raichle, 2007]. Moreover, it has been suggested that the amplitude or power (square of amplitude) of low frequency fluctuations can provide both the nature and extent of signal changes underlying SNAs [Duff et al., 2008; Fransson, 2006; Yang et al., 2007; Zang et al., 2007]. Recently, an approach that can directly measure the amplitude of low frequency fluctuation (ALFF) was used to investigate brain functions of both healthy subjects [Yang et al., 2007] and clinical patients [Zang et al., 2007].
Although epileptic discharges reflect abnormal spontaneous activities, they have been assumed to be equivalent to the activities associated with an “external task” [Benar et al., 2002; Lemieux et al., 2001; Salek‐Haddadi et al., 2003]. Thus the BOLD responses induced by IEDs, being superimposed on a baseline signal of SNA, may increase the amplitude of fluctuation in the signals similar to that induced by a task or stimulus [Duff et al., 2008; Fox and Raichle, 2007; Yang et al., 2007]. Therefore, this enhanced fluctuation amplitude is expected to reflect the BOLD activation induced by epileptic activity. In the present study, we applied this ALFF analysis to the resting‐state fMRI data collected from patients with unilateral mTLE in order to explore the ALFF alteration related to epileptic events, and to tentatively determine the lateralization of mTLE.
MATERIALS AND METHODS
Participants
A total of 50 right‐handed patients with unilateral mTLE participated in the present study, including 26 right mTLE patients (11 women; ages: 25.7 ± 7.1 years, epilepsy durations: 8.8 ± 5.5years) and 24 left mTLE patients (nine women; ages: 23.3 ± 7.7 years, epilepsy durations: 10.7 ± 6.3 years). All patients underwent a comprehensive clinical evaluation with the following inclusion criteria: (1) Symptoms of mTLE. All patients had complex partial seizures, and parts of them were accompanied by simple partial seizures or secondary generalized tonic‐clonic seizures. They had one or more typical symptoms of mTLE, such as aura, abnormal emotional experiences, and psychiatric symptoms, automatisms, dystonic posturing of the limbs and olfactory hallucinations. Thirty‐seven patients had febrile convulsions in their childhood and three had encephalitis. (2) MRI manifestations of the unilateral HS in the left and right mTLE patients. Hippocampal volume less than the Chinese normal hippocampus volume (2.62 cm3 on the right, and 2.48 cm3 on the left; these criteria were set as the two standard deviations below the mean hippocampal volume of the healthy Chinese adults) [Wu et al., 1998] measured in coronal T1 images, and increase in T2 fluid‐attenuated inverted recovery (FLAIR) signal in the hippocampus were used as diagnostic criteria for HS. There was no structural MRI abnormality other than HS found in the patient's brain. (3) EEG findings. Interictal and ictal scalp EEGs showed epileptic spikes in the left/right frontotemporal/temporal lobes (FPS, F7/F8, T3/T4 and T5/T6) in the left/right mTLE patients. (4) Surgical processes of anterior temporal lobectomy were performed in 14 left and 17 right mTLE patients by our neurosurgeons (QT, JS). All the above evidences were employed for the identification of the side of mTLE.
Twenty‐five right‐handed healthy volunteers were recruited as controls (nine women; ages: 25.3 ± 5.8 years). None of them had neurological or psychiatric disorders. All examinations were carried out under the guidance of the Declaration of Helsinki 1975. Written informed consent forms were obtained from all the groups. The research protocol was approved by the local Medical Ethics Committee in Jinling Hospital, Nanjing University School of Medicine.
Data Acquisitions
MRI data were collected using a 1.5T scanner (GE‐Signa, Milwaukee). Participants were instructed to rest with their eyes closed and keep their heads still. To enhance the occurrence of IEDs, the patients were instructed to hyperventilate for 30 times 5 min prior to the fMRI scan. Each patient showed frequent IEDs on the scalp EEG recorded prior to the fMRI experiment. For controlling the experimental condition, each healthy subject was also instructed to perform a hyperventilation procedure similar to that of the patients' before fMRI scan. Significant difference of cardiac or respiratory rates was not found between the patients and healthy subjects.
Axial anatomical images were acquired using a T1‐FLAIR sequence (TR/TE = 2,200 ms/24 ms, matrix = 512 × 512, FOV = 24 × 24 cm2, slice thickness/gap = 4.0 mm/0.5 mm, 23 slices covered the whole brain). Functional data were collected in the same orientation with a T2*‐weighted single‐shot echo planar imaging sequence: TR/TE = 2,000 ms/40 ms, FA = 80°, matrix = 64 × 64, FOV = 24 × 24 cm2, 250 volume measurements in exception for six patients who underwent simultaneous EEG‐fMRI (see below). Subsequently, coronal T1 and T2 FLAIR images of 14 slices were collected in order to measure hippocampal volumes and detect the hippocampal lesions.
To further investigate possible electrophysiological mechanisms underlying the alterations of ALFF in the present study, four/two patients with the patients with the right/left mTLE underwent simultaneous EEG‐fMRI. EEG signals were recorded with 5,000 Hz sampling rate by a 32‐channel Ag/AgCl electrode in an MRI compatible EEG system (®Brain Products, Munich, Germany). The EEG detector was placed inside MRI scanner and connected to a recording computer outside the scanner room through an amplifier (®BrainAmp) and fiber optic cables. The MRI protocol was the same as the above description except that two sessions of EEG‐fMRI scans with 500 volumes were obtained in each patient.
Data Processing and ALFF Calculation
Data preprocessing was performed using a software package SPM2 (http://www.fil.ion.ucl.ac.uk/spm). After slice‐timing adjustment and realignment for head‐motion correction, four right/three left mTLE patients whose head motion exceeded 1.0 mm or involved rotation exceeding 1.0° during the fMRI scanning were excluded. The standard Montreal Neurological Institute (MNI) template provided by SPM2 was used for spatial normalization with a resampling voxel size of 3 × 3 × 3 mm3. After smoothing (FWHM = 8 mm), the imaging data were temporally filtered (band pass, 0.01–0.08 Hz) to remove the effects of very low‐frequency drift and high‐frequency noises (e.g., respiratory and cardiac rhythms) [Biswal et al., 1995; Lowe et al., 1998].
The EEG data were offline‐processed to remove MR, cardiac and ocular artifacts using the Brain Vision Analyzer 1.05 software [Allen et al., 2000], and then examined by an experienced electroencephalographer (LT) to estimate the numbers, timing and types of IEDs based on their amplitudes, spatial distribution, and morphology.
The ALFF analysis was carried out using the REST software (http://resting-fmri.sourceforge.net). The calculation procedure was the same as that reported in the previous studies [Yang et al., 2007; Zang et al., 2007]. Specifically, a filtered time series was transformed to the frequency domain with a fast Fourier transform; thus the power spectrum was obtained. Because the power of a given frequency is proportional to the square of the amplitude of this frequency component, the square root was calculated at each frequency of the power spectrum and the averaged square root was obtained across 0.01–0.08 Hz at each voxel. This averaged square root was taken as the ALFF measurement. For standardization, the ALFF of each voxel was further divided by the global mean of ALFF values. The standardized ALFF of each voxel then has a value of about 1 and this standardization procedure is analogous to that used in PET studies [Raichle et al., 2001].
Group Comparisons of ALFF Between the Patients and Controls
Voxelwise two‐sample t‐tests were employed to compare the differences in ALFF between each group of patients and the control group using the SPM2 software. Significant clusters of activation were determined by using the joint expected probability distribution with height (P < 0.01, T > 2.41) and extent (P < 0.001, cluster size >10 voxels) thresholds, corrected at the whole‐brain level [Poline et al., 1997]. The output was superimposed on the MNI152 T1 template provided by SPM2.
Correlation Between the Regional ALFF and the Number of IEDs
We first carried out a simulation for looking into the relationship between the number of IEDs and the ALFF of a BOLD signal created by convolving single‐trial events with a canonical hemodynamic response function (see Supporting Information, Fig. s1). Second, the data from the six patients undergoing simultaneous EEG‐fMRI were further analyzed to assess the relationship between ALFF and IEDs. Because of the limitation of a small number of patients used, we separated each session of data (500 volumes) into four segments, each consisting of 110 volumes (220s) at interval of 20 volumes (40s). After left‐to‐right flipping of the data of left mTLE patients, total 42 segments were obtained from 6 patients after 6 segments being excluded due to excessive head motion. Then the ALFF values calculated from these short‐segmented data were correlated to the IEDs numbers during this period using a correlation analysis in SPM. A statistical z‐map was generated with a corrected threshold at P < 0. 001 [with the joint expected probability distribution with height (P < 0. 01, z > 2.32) and extent (P < 0.001, cluster size >10 voxels) thresholds, corrected at the whole‐brain level] [Poline et al., 1997].
The Lateralization of ALFF
Because our patients all had unilateral lesion in the medial temporal lobe (mTL), the assessment of hemispheric asymmetry would be important for the observation of those key foci in the process of unilateral mTLE and the validation for the ALFF detection of epileptic activity. Considering the anatomically asymmetric nature of human brain, a symmetric template image was produced by averaging the MNI template and its mirror copy reversed in the sagittal plane [Blumenfeld et al., 2004; Good et al., 2001; Van Bogaert et al., 2000]. The data from the patient and control groups were first normalized to this modified template, and then left‐right flipped to obtain the mirror copies. The nonflipped ALFF data was compared with the mirror data using paired t‐tests. To preclude possible influences of the asymmetric physiological activities on the ALFF asymmetry in mTLE patients, a further comparison of the hemispheric difference between the patients and controls was performed using two‐sample t‐tests. The difference images were generated by subtracting the ALFF of mirror data from the original data. In the above steps, voxels with a corrected P value <0.001 [with the joint expected probability distribution with height (P < 0.05, T > 1.68) and extent (P < 0.001, cluster size >10 voxels) thresholds, corrected at the whole‐brain level] were considered to have statistically significant differences [Poline et al., 1997].
Individual Analyses for the Lateralization of the Changed ALFF in mTLE
To investigate whether the lateralization of mTLE could be determined from the ALFF changes in the patients, a lateralization index (LI) for ALFF in mTL of each subject was calculated by the following formula
The mTL consisted of the hippocampus, parahippocampal gyrus and amygdala which were defined by the anatomically labeled template provided by Tzourio‐Mazoyer et al. [2002].
In line with a few of previous neuroimaging studies [Bonilha et al., 2006; Carne et al., 2007; Mondadori et al., 2006; Van Bogaert et al., 2000], a random‐effect analysis was conducted to compare the ALFF map of individual patient to those of control group using SPM 2 (height threshold of P < 0.01 (t scores >2.41) and an extent threshold of P < 0.001 (cluster size >10 voxels). This method was assumed to correct any physiological ALFF lateralization in the normal brain, and was expected to detect the regional ALFF changes in each patient's brain. All the SPM outputs in both the patient groups were randomly mixed, and then were assessed by three radiologists in a blinded way in order to rate the ALFF lateralization in the temporal structures of the patients.
RESULTS
Comparison of ALFF Between the Patients and Controls
We found significant ALFF differences between the patient and control groups (Fig. 1 and Tables I and II). Compared with the controls, the two patient groups both bilaterally showed increases in ALFF (labeled in warm color) in a few of the limbic and neocortical structures. These limbic structures consisted of the bilateral mTLs (including the parahippocampal gyrus, hippocampus, amygdale, middle and inferior parts of temporal pole), cingulate cortex, lentiform nucleus and midbrain tegmentum; the neocortical structures included the lateral temporal and parietal cortices. Moreover, both the patient groups showed predominant increases in ALFF in the mTL and the thalamus ipsilateral to the epileptogenic side (Fig. 1).
Figure 1.
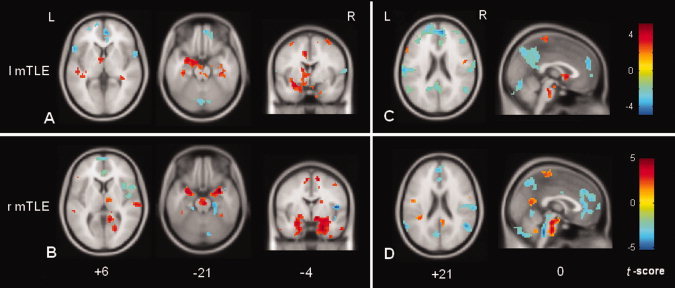
Comparisons of ALFF between the mTLE patients and controls using SPM. (A) and (C) Comparison of ALFF between the left mTLE patients and controls; (B) and (D) Comparison of ALFF between the right mTLE patients and controls. For both the patient groups, the regions with the increased ALFF are distributed bilaterally, but predominantly in the hemisphere ipsilateral to the epileptogenic side, which included the meisal temporal lobe, thalamus and pontine nucleus. The ipsilateral meisal temporal lobe had the maximal increase in ALFF. (C) and (D) show that the decreases in ALFF were distributed among the default‐mode regions. [Color figure can be viewed in the online issue, which is available at wileyonlinelibrary.com.]
Table I.
Regions showing increased ALFF in the group comparisons between the patients and controls
| Brain regions | l mTLE | r mTLE | ||||
|---|---|---|---|---|---|---|
| x, y, z (MNI) | t | Voxels | x, y, z (MNI) | t | Voxels | |
| Limbic system | ||||||
| l Amygdala | −18, −3, −21 | 4.86 | 226 | −24, −3, −21 | 3.84 | 248 |
| l PHG/ hippocampal | −33, −24, −24 | 3.60 | −21, −9, −33 | 4.32 | ||
| r Amygdala | 19, −3, −24 | 2.78 | 84 | 21, −3, −18 | 5.07 | 536 |
| r PHG/ hippocampal | 33, −24, −27 | 3.36 | 30, 3, −21 | 4.59 | ||
| l dACC | −9, −9, 45 | 5.20 | 67 | 15, −3, 45 | 2.66 | 16 |
| r dACC | 9, −6, 45 | 3.30 | 22 | −6, −3, 63 | 3.10 | 24 |
| Subcortical structures | ||||||
| Thalamus | −6, −3, 3 | 3.05 | 15 | 6, −15, 6 | 2.32 | 14 |
| l BG | −3, 9, 0 | 3.98 | 91 | −15, 3, −12 | 3.48 | 28 |
| r BG | 6, 12, 3 | 2.91 | 12 | 9, −6, −12 | 4.53 | 53 |
| PN | −6, −24, −27 | 3.95 | 75 | 3, −24, −39 | 3.91 | 112 |
| Neocortices | ||||||
| l SMC | −39, −33, 66 | 3.88 | 181 | −18, −12, 60 | 3.80 | 122 |
| r SMC | 27, −45, 66 | 4.32 | 515 | 36, −27, 63 | 3.57 | 139 |
| l PCL | −6, 18, 48 | 4.53 | 102 | −6, −3, 63 | 3.10 | 24 |
| r PCL | 15, −6, 63 | 3.08 | 11 | 12, −3, 63 | 3.68 | 86 |
| l LTG | −48, 12, −27 | 3.49 | 18 | −60, −21, −33 | 2.84 | 20 |
| r LTG | 51, 12, −24 | 3.57 | 17 | 57, −3, −33 | 3.23 | 14 |
r: right side; l: left side; PHG: parahippocampal suclus; dACC: dorsal anterior cingulate cortex; BG: basal ganglia; PN: pontine nucleus; SMC: sensorimotor cortex; PCL: paracerntral lobular; LTG: Lateral temporal gyri; MNI: Montreal Neurological Institute coordinates; t: t scores; voxels: number of voxels.
Table II.
Regions showing decreased ALFF in the group comparison between the patients and controls
| Brain region | l mTLE | R mTLE | ||||
|---|---|---|---|---|---|---|
| x, y, z (MNI) | t | Voxels | x, y, z (MNI) | t | Voxels | |
| Precuneus/PCC | −6, −72, 48 | −3.52 | 419 | −3, −69, 51 | −2.80 | 103 |
| MPFC/vACC | 6, 48, 27 | −4.81 | 523 | −3, 51, 21 | −2.78 | 120 |
| l DLPFC | −36, 36, 39 | −3.20 | 279 | −27, 54, 15 | −2.57 | 17 |
| r DLPFC | 39, 45, 30 | −3.39 | 110 | 27, 51, 27 | −3.11 | 35 |
| l Angular gyrus | −48, −66, 33 | −2.97 | 30 | −60, −51, 24 | −2.20 | 45 |
| r Angular gyrus | 51, −57, 21 | −2.80 | 25 | 51, −54, 21 | −3.31 | 46 |
| r Cerebellum | 42, −66, −33 | −3.91 | 370 | 36, −75, −51 | −4.06 | 549 |
| l Cerebellum | −33, −75, −30 | −2.93 | 229 | −24, −87, −45 | −3.00 | 189 |
r: right side; l: left side; PCC: posterior cingulate cortex; vACC: ventral anterior cingulate cortex; MPFC: mesial prefrontal cortex; DLPFC: dorsal lateral prefrontal cortex. MNI: Montreal Neurological Institute coordinates; t: t scores; voxels: number of voxels.
The regions showing decreased ALFF (labeled in cold color) in both patient groups bilaterally included the dorsal lateral prefrontal cortex, ventral anterior cingulate cortex/medial prefrontal cortex, angular gyrus, precuneus/posterior cingulate cortex, and cerebellum (Fig. 1). These regions were largely overlapped with the regions of so‐called default‐mode network [Fransson, 2005; Raichle et al., 2001]. In addition, a few of subcortical structures also showed decreases in ALFF, including the bilateral caudate heads and the posterior lobes of cerebellum.
Correlation Between the ALFF and IEDs
The simulation results revealed that, when the interval between two single‐trial events is longer than 18 s, a greater increase in the ALFF is found when more trials are included in the analysis (see Supporting Information, Fig. s1). In our patients undergoing simultaneous fMRI‐EEG, the averaged interval between IEDs was 45 s. In the correlation map, the voxels with a significant positive correlation between the ALFF and the number of IEDs were distributed bilaterally at the mTLs (left: peak z = 4.87, right: peak z = 4.88, both P < 10−5), insula (left: peak z = 5.14, P < 10−5; right: peak z = 4.48, P < 0.0001) and basal ganglia (left: peak z = 4.45, P <0.0001; right: peak z = 5.17, both P < 10−5). The right thalamus (peak z = 2.81, P = 0.004) and pontine nucleus (peak z = 3.76, P = 0.0003) also showed positive correlation. A few of key structures, such as the bilateral mTLs and the right thalamus showing positive correlation were largely in agreement with the manifestation of the increased ALFF in the above group comparisons. The voxels with a significant negative correlation were mostly located at the bilateral occipital lobes (left: peak z = −3.67, P = 0.0003; right: peak z = 4.13, P < 0.0001) (Fig. 2, Supporting Information, Table s1).
Figure 2.
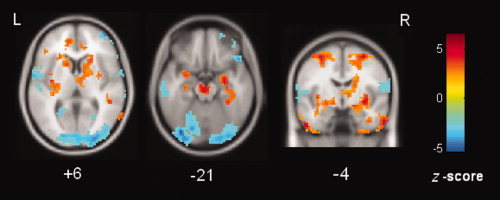
Correlation between the number of IEDs and ALFF. The voxels within the bilateral mTLs, insula, basal ganglia, pons, and the right thalamus have a positive correlation (warm color); while the voxels within the occipital cortex and cerebellum have a negative correlation (cold color). [Color figure can be viewed in the online issue, which is available at wileyonlinelibrary.com.]
The Asymmetry of ALFF
In both the patient groups, significantly different ALFF between the two hemispheres (i.e., the asymmetry) was consistently found in several brain structures, such as the mTL and thalamus. These structures corresponded primarily to the regions with increased ALFF in the patients compared to control as shown in Figure 1. In addition, the spatial patterns of the asymmetry in the patients significantly differed from that in the controls. The rightward asymmetry in the controls was located in the visual cortex and insula (Supporting Information, Fig. s2 and Supporting Information, Table s2). By comparing the ALFF asymmetry in the patients to that in the controls, both the patient groups showed that the mTL (t scores in the left mTLE/right mTLE: 2.57/2.42) and thalamus (t scores in the left mTLE/right mTLE: 3.25/2.28) were more asymmetric than the controls. These results further confirmed that the mTL and thalamus ipsilateral to the epileptogenic side had greater ALFF than the contralateral side in both the patient groups (Fig. 3).
Figure 3.
The differences of the interhemispheric asymmetry between the controls and the patients with the left mTLE (A) and right mTLE (B). The warm color labeling indicates that the interhemispheric asymmetry in the mTLE patients is more pronounced than that in the controls. The thalamus and mTL ipsilateral to the epileptogenic side are the most prominent sites showing higher ALFF than the conralateral structures in both patient groups. [Color figure can be viewed in the online issue, which is available at wileyonlinelibrary.com.]
Individual‐Subject Analysis
A quantitative analysis of LIs showed that the degrees of asymmetry in these three participant groups (LIs in the left mTLE/controls/right mTLE: 0.11 ± 0.06/0.08 ± 0.04/−0.02 ± 0.09) were significant different (one way‐ANOVA, F = 22.9, P < 0.05). Although the values of mean LI ranked from the right mTLE (lowest) to the left mTLE (highest) (Fig. 4), only the right mTLE patients showed different LIs from the left mTLE (LSD‐t test, P <0.001) and controls (LSD‐t test, P <0.001); while the left mTLE did not showed different LIs from the controls (LSD‐t test, P = 0.020). We also found moderate sensitivities and high specificities for differentiating the right mTLE from the left mTLE (sensitivity = 76%, specificity = 100%; cutoff of LI at −0.01) and the healthy control (sensitivity = 71%, specificity = 100%; cutoff of LI at −0.01). However, a low sensitivity and a low specificity were found for differentiating the left mTLE from the healthy controls (sensitivity = 55%, specificity = 46%; cutoff of LI at 0.12).
Figure 4.
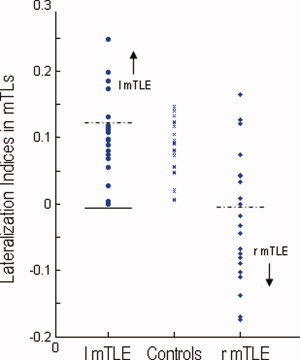
Lateralization indices (LIs) for ALFF within mTLs across three different groups. The horizontal lines indicate the cutoff points where each group of patients and healthy controls are correctly categorized. The solid lines indicate the cutoff points (−0.01) for differentiating between the patient groups, and the dashed lines indicate the cutoff points (0.12 for left mTLE and −0.01 for right mTLE) for differentiating the patients from the controls. A sensitivity of 0.55 and a specificity of 0.44 are yielded for differentiating the left mTLE patients from the healthy controls, and a moderate sensitivity of 0.71 and a high specificity of 1.0 for differentiating the left mTLE patients from the right mTLE patients (which can be swapped between the two patient groups). Whereas, a moderate sensitivity of 0.76 and a high specificity of 1.0 can be yielded for differentiating the right mTLE patients from the controls. [Color figure can be viewed in the online issue, which is available at wileyonlinelibrary.com.]
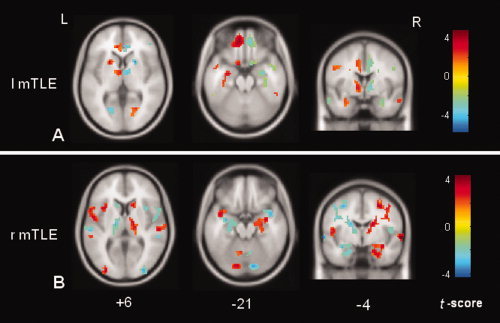
Statistical parametric comparison of each patient to the control group demonstrated the individual map of the changed ALFF. Figure 5 shows two examples of the individual SPM results of the left mTLE and right mTLE patients, respectively. The blinded visual analyses of these SPM results by three observers are summarized in Tables III and Supporting Information, Table s3. The results showed that the pattern of altered ALFF as revealed by SPM analysis could be used to differentiate the left mTLE from right mTLE on an individual basis with a moderate level of sensitivity (80.0%), and a fair specificity (87.3%). Kappa tests revealed a high agreement degree (averaged, 89.4%) between these raters (see Supporting Information, Table s3).
Figure 5.
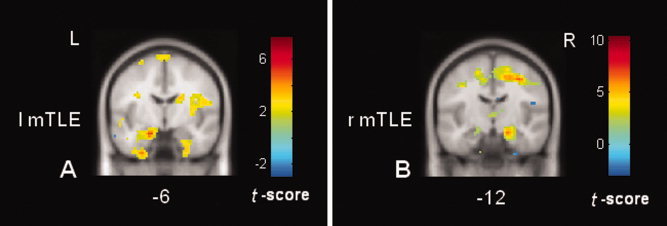
Examples of the individual SPM results by comparing each single patient to the control group. (A) The result of a left mTLE patient; and (B) the result of a right mTLE patient. The mTLs ipsilateral to the epileptogenic sides consistently show the increases in ALFF. [Color figure can be viewed in the online issue, which is available at wileyonlinelibrary.com.]
Table III.
Diagnosis of the left mTLE based on SPM output: individual patients versus normal populationa
| Rater | Classified “lmTLE” | Classified “rmTLE” | Senstivity (%) | Specificity (%) | Positive predictive value | Negative predictive value |
|---|---|---|---|---|---|---|
| I | 18 | 23 | 75.0 | 85.7 | 83.3 | 78.3 |
| II | 18 | 23 | 80.0 | 90.5 | 88.9 | 82.3 |
| III | 20 | 21 | 85.0 | 85.7 | 85.0 | 85.7 |
| Average | / | / | 80.0 | 87.3 | 85.7 | 82.1 |
Given the methodology, r mTLE responses are complementary: sensitivities and specificities can be swapped.
l mTLE: left mTLE petients; r mTLE: right mTLE petients.
DISCUSSION
The present fMRI study has demonstrated that the ALFF of BOLD signal is altered in the patients with differently sided mTLE and that these ALFF alterations are associated with the epileptic activity. These results indicate that the ALFF method is an effective fMRI analysis technique for detecting epileptic activity, and may have a clinical potential for the localization, or at least, lateralization of mTLE. Moreover, the widespread alterations of ALFF in many brain regions besides to the mTL may implicate pathological substrates of an epileptic network in mTLE [Spencer, 2002].
Changes of ALFF and its Relation to Epileptic Activity
Compared with the controls, the patients with left and right mTLE consistently showed the maximal and predominant increase in ALFF in the mTL ipsilateral to the epileptogenic side, a well‐known focus with pathological changes. The group comparisons of ALFF between the two hemispheres also demonstrated that the ipsilateral mTL had more prominent increases in ALFF than the contralateral mTL to the epileptogenic side, which was consistent with the clinical assessments of these patients with unilateral mTLE.
The ALFF changes in BOLD signal have been suggested to be associated with local neuronal activity [Logothetis et al., 2001; Yang et al., 2007; Zang et al., 2007]. We reason that the BOLD signal deviation induced by trial‐by‐trial neuronal events, e.g., the IEDs [Benar et al., 2002], can enhance the ALFF of the baseline BOLD signal. This assumption can be supported by our simulation data. Moreover, significant correlation between the IED numbers and ALFF changes within a few of key regions of the mTLs and thalamus also suggest that the increased ALFF in our patients may be related to the interictal epileptic activity.
A recent EEG‐fMRI study of mTLE has shown that the IEDs‐related activation is mostly located in the mTL with epileptogenic focus, and the deactivation is distributed in the default‐mode regions [Laufs et al., 2007]. These previous results were consistent with the distributions of the increased and decreased ALFF in our patients. Although these two methods may share the same physiological foundation that IEDs can induce the BOLD deviations, the ALFF analysis is more straightforward than the previously used general‐linear‐model method with simultaneous EEG to reflect the BOLD alteration associated with epileptic activity. Furthermore, the utilization of ALFF analysis is free of intractable technical challenges in simultaneous EEG‐fMRI, such as the time demanding of EEG under severe noises [Allen et al., 2000; Salek‐Haddadi et al., 2003] and arbitrary selection of hemodynamic function [Gotman et al., 2005].
Regions Showing Increased ALFF and the Temporal Epileptic Network
In addition to the ipsilateral mTL, many other regions, including the contralateral mTL, the ipsilateral thalamus to the epileptogenic side, and bilateral neocortices and pontine nucleus, together showed the increased ALFF. These structures comprised a network with prominent regions in the limbic system. The spatial pattern of this network was similar to that of the temporal epileptic network reported in other studies using different imaging modalities [Bernhardt et al., 2008; Blumenfeld et al., 2004; Spencer, 2002; Tae et al., 2005]. Although a general consensus has been reached that the hippocampus is the key of the epileptogenic focus, increasing evidence has shown that widespread brain structures, including the bilateral mesial temporal structures [Bernhardt et al., 2008; Seidenberg et al., 2005; Spencer, 2002], neocortices such as the lateral temporal [Blumenfeld et al., 2004; Tae et al., 2005] and parietal lobes [Englot et al., 2008; Nelissen et al., 2006; Tae et al., 2005], subcortical structures such as the thalamus [Labate et al., 2008; Schwarcz et al., 2002; Yune et al., 1998], basal ganglia and pontine nuclei [Bouilleret et al., 2005] etc., compose a reciprocal mesial temporal epileptic network contributing to the process of mTLE [Blumenfeld et al., 2004; Sakamoto et al., 2003; Spencer, 2002]. The largely overlapped results might implicate that the widespread increased ALFF is underpinned by the mesial temporal epileptic network proposed by Spencer [2002].
The thalamus was another prominent structure that showed increased ALFF and ipsilateral asymmetry in addition to the mTL. The thalamus plays a crucial and multifunctional role in the initiation, propagation and inhibition of epileptic activity via complex reciprocal networks linking cortices and other subcortical structures [Blumenfeld et al., 2004; Bruehl et al., 1998; Schwarcz et al., 2002]. Previous neuroimaging studies have revealed that the thalamus ipsilateral to the epileptogenic foci may be affected in mTLE [Bonilha et al., 2005; Kimiwada et al., 2006; Yune et al., 1998]. Our findings have also provided strong evidence supporting the important role of the thalamus in mTLE.
Regions Showing Decreased ALFF and the Default‐Mode Network
The regions showing decreased ALFF were found to be extensively overlapped with the regions of precuneus, mesial prefrontal cortex, bilateral angular gyri, and cerebellum. These regions were considered to be involved in the default‐mode network [Fransson, 2005; Raichle et al., 2001]. The epileptic deactivation in the default‐mode regions has been documented in a few of fMRI studies [Archer et al., 2003; Gotman et al., 2005; Kobayashi et al., 2006; Laufs et al., 2007]. It is assumed that IEDs can suspend normal default brain function and may point to the underlying neuropathophysiology of cognitive impairments in mTLE [Gotman et al., 2005; Kobayashi et al., 2006]. However, these previous findings have only explained a transient relationship between default‐mode function and the interictal epileptic activity for each time point in the measurement, but may not reflect a sustained state of the default‐mode function [Kobayashi et al., 2006]. In terms of the decreased ALFF within the default‐mode regions, we reason that the default‐mode function in mTLE is impaired and such impairment may be attributed to any harmful causes in mTLE, for example, ictal epileptic activity, hypoxia during a seizure state, in addition to the neuronal inhibition induced by the interictal epileptic activity [Gotman et al., 2005]. Moreover, additional possibility can be speculated that the interictal epileptic activity, just like a goal‐directed task, may suppress the power (i.e., ALFF) of the signal in the default mode network [Fransson, 2006]. However, further evidence is needed to support this speculation.
Clinical Potential and Methodological Considerations
Although the bilateral increased ALFF was assumed to reflect the bilateral nature of the mesial temporal epileptic network, the significantly asymmetric distribution of ALFF changes, as demonstrated by our group comparisons, had clinical significance for the lateralization of unilateral mTLE. The asymmetry measurement is considered as a sensitive marker for the lateralization of temporal epileptogenic regions [Van Bogaert et al., 2000]. The present study showed that the LI calculation could differentiate the right mTLE patients from both the healthy controls and left mTLE patients. However, the left mTLE patients could not be effectively differentiated from healthy controls. A normal physiological asymmetry of ALFF in mTLs in healthy controls is suspected to affect this differentiation.
To correct the latent effect of the physiological asymmetry between the brain hemispheres, individual voxel‐based statistical parametric analysis was performed by comparing the individual patient to a control group. This method could enhance the capability for epileptogenic lateralization. The outputs from blinded visual analysis for individual patients showed that the sensitivity of this method is comparable with that of interictal PET studies in the lateralization of mTLE [Nelissen et al., 2006; Tae et al., 2005]. These results also imply that this statistical parametric map‐based approach may have a potential for localization of epileptic activity.
There are theoretic and methodological limitations in the present study. First, our hypothesis that the IEDs can increase the ALFF of BOLD signal is based on that IEDs occur at rather long intervals. Sustained discharges may not cause increases in ALFF since the neurons involved may be very active and absent of modulation. On the other hand, the candidate patients are also required to have frequent discharges to ensure the occurrence during the period of fMRI scan. Hence these strict criteria may limit the application of this method of ALFF analysis. Second, although this preliminary study showed the altered ALFF might be associated to the epileptic activity, future study with more simultaneous EEG‐fMRI data is required to clarify whether the increased ALFF is induced directly by IEDs. Third, we only focused on the low frequency BOLD signals (0.01∼0.08Hz) by employing a band filtering. There might be a loss of higher frequency information about epileptic activation. More importantly, although we did not find significant difference of cardiac or respiratory rates between patients and normal subjects, difference of cardiac and respiratory rates might still exist between patients and controls during fMRI scanning. At a TR of 2,000 ms, the cardiac and respiratory fluctuation effects might be aliased into the low frequency BOLD MR signal fluctuations [Lowe et al., 1998]. Fourth, there was a concern that the reported group differences in ALFF might be associated with a cerebrospinal fluid (CSF) pulsation in the increased CSF space volume due to the hippocampal atrophy in patients with HS. Note that this concern is not always considered in most previous fMRI studies on epilepsy patients with HS [Cheung et al., 2006; Waites et al., 2006], because that the increased CSF space volume could be very mild after data being normalized to the template images. Nevertheless, such CSF effects should be carefully addressed in the present study. We found that the amplitude of the signals from the pulsation of CSF was not higher than the ALFF resulting from neuronal activity fluctuations (see Supporting Information, Fig. s3). The consistent results using various analyses in the present study all suggested that the ALFF change were related to epileptic activity in mTLE rather than the noise. Finally, in order to perform individual SPM analyses by comparing a single patient with a control group, a large number of control subjects, especially categorized by different ages and genders, are required for a fine assessment of the lateralization of mTLE.
CONCLUSION
The present fMRI study employed an ALFF analysis method to investigate the alteration of BOLD fluctuations in mTLE. Our preliminary results show that this method has the capabilities to lateralize mTLE and to map the brain networks underling mTLE, which indicates a clinical potential and is helpful for our understanding the neuropathophysiology of mTLE. Although rather simple, the ALFF analysis may provide a useful tool in fMRI study of epilepsy.
Supporting information
Additional Supporting Information may be found in the online version of this article.
Supporting Information
Acknowledgements
The authors express their appreciation to Prof. Yufeng Zang in Beijing Normal University for technical support and advice; Nelson Klahr in the University of Florida for his help on preparing this manuscript; Dr. Zongjun Zhang, Dr. Xueman Ji, and Dr. Yane Zhao in the Department of Medical Imaging, Jinling Hospital, for their assessment works in this study. Also, the authors are highly grateful to the anonymous reviewers for their significant and constructive comments and suggestions, which greatly improve the article.
REFERENCES
- Allen PJ,Josephs O,Turner R ( 2000): A method for removing imaging artifact from continuous EEG recorded during functional MRI. Neuroimage 12: 230–239. [DOI] [PubMed] [Google Scholar]
- Archer JS,Abbott DF,Waites AB,Jackson GD ( 2003): fMRI “deactivation” of the posterior cingulate during generalized spike and wave. Neuroimage 20: 1915–1922. [DOI] [PubMed] [Google Scholar]
- Benar CG,Gross DW,Wang Y,Petre V,Pike B,Dubeau F,Gotman J ( 2002): The BOLD response to interictal epileptiform discharges. Neuroimage 17: 1182–1192. [DOI] [PubMed] [Google Scholar]
- Bernhardt BC,Worsley KJ,Besson P,Concha L,Lerch JP,Evans AC,Bernasconi N ( 2008): Mapping limbic network organization in temporal lobe epilepsy using morphometric correlations: Insights on the relation between mesiotemporal connectivity and cortical atrophy. Neuroimage 42: 515–524. [DOI] [PubMed] [Google Scholar]
- Biswal B,Yetkin FZ,Haughton VM,Hyde JS ( 1995): Functional connectivity in the motor cortex of resting human brain using echo‐planar MRI. Magn Reson Med 34: 537–541. [DOI] [PubMed] [Google Scholar]
- Blumenfeld H,McNally KA,Vanderhill SD,Paige AL,Chung R,Davis K,Norden AD,Stokking R,Studholme C,Novotny EJ Jr,Zubal IG,Spencer SS ( 2004): Positive and negative network correlations in temporal lobe epilepsy. Cereb Cortex 14: 892–902. [DOI] [PubMed] [Google Scholar]
- Bonilha L,Montenegro MA,Rorden C,Castellano G,Guerreiro MM,Cendes F,Li LM ( 2006): Voxel‐based morphometry reveals excess gray matter concentration in patients with focal cortical dysplasia. Epilepsia 47: 908–915. [DOI] [PubMed] [Google Scholar]
- Bonilha L,Rorden C,Castellano G,Cendes F,Li LM ( 2005): Voxel‐based morphometry of the thalamus in patients with refractory medial temporal lobe epilepsy. Neuroimage 25: 1016–1021. [DOI] [PubMed] [Google Scholar]
- Bouilleret V,Semah F,Biraben A,Taussig D,Chassoux F,Syrota A,Ribeiro MJ ( 2005): Involvement of the basal ganglia in refractory epilepsy: An 18F‐fluoro‐L‐DOPA PET study using 2 methods of analysis. J Nucl Med 46: 540–547. [PubMed] [Google Scholar]
- Bruehl C,Wagner U,Huston JP,Witte OW ( 1998): Thalamocortical circuits causing remote hypometabolism during focal interictal epilepsy. Epilepsy Res 32: 379–387. [DOI] [PubMed] [Google Scholar]
- Carne RP,O'Brien TJ,Kilpatrick CJ,Macgregor LR,Litewka L,Hicks RJ,Cook MJ ( 2007): ‘MRI‐negative PET‐positive’ temporal lobe epilepsy (TLE) and mesial TLE differ with quantitative MRI and PET: A case control study. BMC Neurol 7: 16. [DOI] [PMC free article] [PubMed] [Google Scholar]
- Chen H,Yao D,Lu G,Zhang Z,Hu Q ( 2006): Localization of latent epileptic activities using spatio‐temporal independent component analysis of FMRI data. Brain Topogr 19: 21–28. [DOI] [PubMed] [Google Scholar]
- Cheung MC,Chan AS,Chan YL,Lam JM ( 2006): Language lateralization of Chinese‐English bilingual patients with temporal lobe epilepsy: A functional MRI study. Neuropsychology 20: 589–597. [DOI] [PubMed] [Google Scholar]
- Duff EP,Johnston LA,Xiong J,Fox PT,Mareels I,Egan GF ( 2008): The power of spectral density analysis for mapping endogenous BOLD signal fluctuations. Hum Brain Mapp 29: 778–790. [DOI] [PMC free article] [PubMed] [Google Scholar]
- Engel J Jr ( 2001): Mesial temporal lobe epilepsy: What have we learned? Neuroscientist 7: 340–352. [DOI] [PubMed] [Google Scholar]
- Englot DJ,Mishra AM,Mansuripur PK,Herman P,Hyder F,Blumenfeld H ( 2008): Remote effects of focal hippocampal seizures on the rat neocortex. J Neurosci 28: 9066–9081. [DOI] [PMC free article] [PubMed] [Google Scholar]
- Fox MD,Raichle ME ( 2007): Spontaneous fluctuations in brain activity observed with functional magnetic resonance imaging. Nat Rev Neurosci 8: 700–711. [DOI] [PubMed] [Google Scholar]
- Fransson P ( 2005): Spontaneous low‐frequency BOLD signal fluctuations: An fMRI investigation of the resting‐state default mode of brain function hypothesis. Hum Brain Mapp 26: 15–29. [DOI] [PMC free article] [PubMed] [Google Scholar]
- Fransson P ( 2006): How default is the default mode of brain function? Further evidence from intrinsic BOLD signal fluctuations. Neuropsychologia 44: 2836–2845. [DOI] [PubMed] [Google Scholar]
- Good CD,Johnsrude I,Ashburner J,Henson RN,Friston KJ,Frackowiak RS ( 2001): Cerebral asymmetry and the effects of sex and handedness on brain structure: A voxel‐based morphometric analysis of 465 normal adult human brains. Neuroimage 14: 685–700. [DOI] [PubMed] [Google Scholar]
- Gotman J,Grova C,Bagshaw A,Kobayashi E,Aghakhani Y,Dubeau F ( 2005): Generalized epileptic discharges show thalamocortical activation and suspension of the default state of the brain. Proc Natl Acad Sci USA 102: 15236–15240. [DOI] [PMC free article] [PubMed] [Google Scholar]
- Gotman J,Kobayashi E,Bagshaw AP,Benar CG,Dubeau F ( 2006): Combining EEG and fMRI: A multimodal tool for epilepsy research. J Magn Reson Imaging 23: 906–920. [DOI] [PubMed] [Google Scholar]
- Kimiwada T,Juhasz C,Makki M,Muzik O,Chugani DC,Asano E,Chugani HT ( 2006): Hippocampal and thalamic diffusion abnormalities in children with temporal lobe epilepsy. Epilepsia 47: 167–175. [DOI] [PubMed] [Google Scholar]
- Kobayashi E,Bagshaw AP,Grova C,Dubeau F,Gotman J ( 2006): Negative BOLD responses to epileptic spikes. Hum Brain Mapp 27: 488–497. [DOI] [PMC free article] [PubMed] [Google Scholar]
- Krakow K,Messina D,Lemieux L,Duncan JS,Fish DR ( 2001): Functional MRI activation of individual interictal epileptiform spikes. Neuroimage 13: 502–505. [DOI] [PubMed] [Google Scholar]
- Labate A,Cerasa A,Gambardella A,Aguglia U,Quattrone A ( 2008): Hippocampal and thalamic atrophy in mild temporal lobe epilepsy: A VBM study. Neurology 71: 1094–1101. [DOI] [PubMed] [Google Scholar]
- Laufs H,Hamandi K,Salek‐Haddadi A,Kleinschmidt AK,Duncan JS,Lemieux L ( 2007): Temporal lobe interictal epileptic discharges affect cerebral activity in “default mode” brain regions. Hum Brain Mapp 28: 1023–1032. [DOI] [PMC free article] [PubMed] [Google Scholar]
- Lemieux L,Salek‐Haddadi A,Josephs O,Allen P,Toms N,Scott C,Krakow K,Turner R,Fish DR ( 2001): Event‐related fMRI with simultaneous and continuous EEG: Description of the method and initial case report. Neuroimage 14: 780–787. [DOI] [PubMed] [Google Scholar]
- Logothetis NK,Pauls J,Augath M,Trinath T,Oeltermann A ( 2001): Neurophysiological investigation of the basis of the fMRI signal. Nature 412: 150–157. [DOI] [PubMed] [Google Scholar]
- Lowe MJ,Mock BJ,Sorenson JA ( 1998): Functional connectivity in single and multislice echoplanar imaging using resting‐state fluctuations. Neuroimage 7: 119–132. [DOI] [PubMed] [Google Scholar]
- Mondadori CR,Buchmann A,Mustovic H,Schmidt CF,Boesiger P,Nitsch RM,Hock C,Streffer J,Henke K ( 2006): Enhanced brain activity may precede the diagnosis of Alzheimer's disease by 30 years. Brain 129: 2908–2922. [DOI] [PubMed] [Google Scholar]
- Morgan VL,Price RR,Arain A,Modur P,Abou‐Khalil B ( 2004): Resting functional MRI with temporal clustering analysis for localization of epileptic activity without EEG. Neuroimage 21: 473–481. [DOI] [PubMed] [Google Scholar]
- Nelissen N,Van Paesschen W,Baete K,Van Laere K,Palmini A,Van Billoen H,Dupont P ( 2006): Correlations of interictal FDG‐PET metabolism and ictal SPECT perfusion changes in human temporal lobe epilepsy with hippocampal sclerosis. Neuroimage 32: 684–695. [DOI] [PubMed] [Google Scholar]
- Poline JB,Worsley KJ,Evans AC,Friston KJ ( 1997): Combining spatial extent and peak intensity to test for activations in functional imaging. Neuroimage 5: 83–96. [DOI] [PubMed] [Google Scholar]
- Raichle ME,MacLeod AM,Snyder AZ,Powers WJ,Gusnard DA,Shulman GL ( 2001): A default mode of brain function. Proc Natl Acad Sci USA 98: 676–682. [DOI] [PMC free article] [PubMed] [Google Scholar]
- Rodionov R,De Martino F,Laufs H,Carmichael DW,Formisano E,Walker M,Duncan JS,Lemieux L ( 2007): Independent component analysis of interictal fMRI in focal epilepsy: Comparison with general linear model‐based EEG‐correlated fMRI. Neuroimage 38: 488–500. [DOI] [PubMed] [Google Scholar]
- Sakamoto S,Tsuyuguchi N,Takami T,Morino M,Goto T,Hattori H,Tsutada T,Haque M,Sunada I,Shimogawara M and others ( 2003): Interictal patterns of cerebral glucose metabolism, perfusion, and magnetic field in mesial temporal lobe epilepsy. Epilepsia 44: 1196–1206. [DOI] [PubMed] [Google Scholar]
- Salek‐Haddadi A,Friston KJ,Lemieux L,Fish DR ( 2003): Studying spontaneous EEG activity with fMRI. Brain Res Brain Res Rev 43: 110–133. [DOI] [PubMed] [Google Scholar]
- Schwarcz R,Scharfman HE,Bertram EH ( 2002): Temporal lobe epilepsy: Renewed emphasis on extrahippocampal areas In: Davis KL, editor. Neuropsychopharmacology: The Fifth Generation of Progress. Philadelphia: Lippincott Williams & Wilkins; pp. 1843–1855. [Google Scholar]
- Seidenberg M,Kelly KG,Parrish J,Geary E,Dow C,Rutecki P,Hermann B ( 2005): Ipsilateral and contralateral MRI volumetric abnormalities in chronic unilateral temporal lobe epilepsy and their clinical correlates. Epilepsia 46: 420–430. [DOI] [PubMed] [Google Scholar]
- Spencer SS ( 2002): Neural networks in human epilepsy: Evidence of and implications for treatment. Epilepsia 43: 219–227. [DOI] [PubMed] [Google Scholar]
- Tae WS,Joo EY,Kim JH,Han SJ,Suh YL,Kim BT,Hong SC,Hong SB ( 2005): Cerebral perfusion changes in mesial temporal lobe epilepsy: SPM analysis of ictal and interictal SPECT. Neuroimage 24: 101–110. [DOI] [PubMed] [Google Scholar]
- Tzourio‐Mazoyer N,Landeau B,Papathanassiou D,Crivello F,Etard O,Delcroix N,Mazoyer B,Joliot M ( 2002): Automated anatomical labeling of activations in SPM using a macroscopic anatomical parcellation of the MNI MRI single‐subject brain. Neuroimage 15: 273–289. [DOI] [PubMed] [Google Scholar]
- Van Bogaert P,Massager N,Tugendhaft P,Wikler D,Damhaut P,Levivier M,Brotchi J,Goldman S ( 2000): Statistical parametric mapping of regional glucose metabolism in mesial temporal lobe epilepsy. Neuroimage 12: 129–138. [DOI] [PubMed] [Google Scholar]
- Waites AB,Briellmann RS,Saling MM,Abbott DF,Jackson GD ( 2006): Functional connectivity networks are disrupted in left temporal lobe epilepsy. Ann Neurol 59: 335–343. [DOI] [PubMed] [Google Scholar]
- Wu JW,Song ZQ,Chen JK,Tan QF,Li SJ,Lu GM,Zhang ZJ,Liu YX ( 1998): Volumetric measurement of hippocampal formation using MRI in the normal Chinese adults and patients with epilepsy (in Chinese). Chin J Radiol 32: 220–227. [Google Scholar]
- Yang H,Long XY,Yang Y,Yan H,Zhu CZ,Zhou XP,Zang YF,Gong QY ( 2007): Amplitude of low frequency fluctuation within visual areas revealed by resting‐state functional MRI. Neuroimage 36: 144–152. [DOI] [PubMed] [Google Scholar]
- Yune MJ,Lee JD,Ryu YH,Kim DI,Lee BI,Kim SJ ( 1998): Ipsilateral thalamic hypoperfusion on interictal SPECT in temporal lobe epilepsy. J Nucl Med 39: 281–285. [PubMed] [Google Scholar]
- Zang YF,He Y,Zhu CZ,Cao QJ,Sui MQ,Liang M,Tian LX,Jiang TZ,Wang YF ( 2007): Altered baseline brain activity in children with ADHD revealed by resting‐state functional MRI. Brain Dev 29: 83–91. [DOI] [PubMed] [Google Scholar]
Associated Data
This section collects any data citations, data availability statements, or supplementary materials included in this article.
Supplementary Materials
Additional Supporting Information may be found in the online version of this article.
Supporting Information