

Abstract
Do certain brain states predispose humans to commit errors in monotonous tasks? We used MEG to investigate how oscillatory brain activity indexes the brain state in subjects performing a Go‐noGo task. Elevated occipital alpha and sensorimotor mu activity just prior to the presentation of the stimuli predicted an upcoming error. An error resulted in increased frontal theta activity and decreased posterior alpha activity. This theta increase and alpha decrease correlated on a trial‐by‐trial basis reflecting post‐error functional connectivity between the frontal and occipital regions. By examining the state of the brain before a stimulus, we were able to show that it is possible to predict lapses of attention before they actually occur. This supports the case that the state of the brain is important for how incoming stimuli are processed and for how subjects respond. Hum Brain Mapp, 2009. © 2009 Wiley‐Liss, Inc.
Keywords: MEG, attention, response inhibition, visual system, motor system
INTRODUCTION
To be able to sustain attention is of great importance in our daily life. A momentary lapse in attention could be fairly benign such as over pouring coffee but could also have more serious consequences such as traffic accidents. Despite how common these lapses of attention are in daily life, there has yet to be developed a system‐wide understanding of the brain mechanisms underlying them [Weissman et al., 2006]. The central questions of this article is (1) can we identify states of the brain which predisposes a lapse in attention and (2) how do errors change the brain state in order to avoid future lapses in attention.
Brain states which might predict behavioral errors can be investigated by various techniques. One option is to use fMRI; however, because of the temporal smearing of the hemodynamic response function it is difficult to separate pre from poststimulus activity [Weissman et al., 2006]. Another possibility is to apply electrophysiological measures such as EEG and MEG which offer a better temporal resolution. EEG and MEG signals are often analyzed using event‐related potentials and fields (ERPs and ERFs). However, this approach can be problematic because it requires a baseline interval which is difficult to define when investigating prestimulus signals. Baseline issues are not a concern when characterizing brain states by oscillatory activity given that the absolute power of these signals can be measured and contrasted between conditions. Several recent studies do point to visual and somatosensory perception being modulated by prestimulus oscillatory activity. In particular, activity in the alpha band has been shown to predict failures in perception [Ergenoglu et al., 2004; Linkenkaer‐Hansen et al., 2004; Thut et al., 2006; van Dijk et al., 2008].
In this study, we have investigated how oscillatory brain activity is modulated before and after errors in a Go‐noGo task requiring sustained attention (the sustained attention response task: SART). We have chosen the Go‐noGo task because it is well suited for investigating both response‐inhibition and error‐processing [Bokura et al., 2001; Jaffard et al., 2008; Manly et al., 1999; Picton et al., 2007; Rubia et al., 2001]. In the paradigm participants respond by pressing a button to a frequent Go stimulus (digit 1–4 and 6–9) but must withhold responses to an infrequent noGo stimulus (digit 5). Because the Go stimuli are much more probable than the noGo stimuli, the paradigm lulls the participant into responding automatically to all stimuli. Preventing this automatic behavior severely taxes the sustained attention system, and errors are often elicited.
This study compared the prestimulus and postresponse oscillatory activity recorded using MEG from subjects performing the Go‐noGo task. We used MEG because the technique allows us to both measure and localize oscillatory brain activity. Our aim was to identify brain states characterized by oscillatory activity that prior to the onset of a noGo stimulus predicted the subject's failure to inhibit a motor response. We chose to focus on the theta, alpha, and beta frequency bands, because prior studies that have implicated the involvement of these bands in various aspects of visual processing, motor response, and error detection [Ergenoglu et al., 2004; Linkenkaer‐Hansen et al., 2004; Mazaheri and Picton, 2005; Thut et al., 2006; van Dijk et al., 2008; Yordanova et al., 2003; Zhang et al., 2008a, b]. We also analyzed oscillatory activity after erroneous motor responses to investigate the cognitive processes initiated to prevent future mistakes. Such processes might include a top‐down drive to perceptual areas. This we have characterized using a measure of functional connectivity based on power correlations in different frequency bands.
METHODS
Participants
Fourteen normal young adults (3 female) with a mean age of 27 (range 23–33) years participated as subjects. All subjects were right‐handed and all had normal or corrected‐to‐normal vision.
Experimental Procedures
The visual stimuli were single digits between 1 and 9 presented in the lower left visual field with an eccentricity of 3.2°. The width of the stimuli extended 5° by 5° and the screen was about 70 cm away from the subject. The fixation cross at the centre of the screen was constantly on. Each stimulus was displayed for 0.2 s and the intertrial interval was 1.5 s. The stimuli were presented in 12 blocks of 151 trials. Participants were asked to respond to all digits except “5” by pressing a button with the right index finger. Digits “1–4” and “6–9” are thus the “Go stimuli” and digit “5” the “noGo stimulus.” The presence or absence of a button‐press was assessed for each trial. Trials were then categorized as “Hits” (response to any digit except 5), “Correct Withholds” (no response to the digit 5), and “False Alarms” (response to the digit 5). All trials which were preceded by a noGo trial were excluded from further analysis. In all our analysis the amount of Correct Withhold and Hit trials was matched to those of False Alarms. We found that on average subjects were unable to inhibit their response to digit 5 in 40% of the trials. After artifact rejection there were on average about 40 False Alarm trials per subject.
Data Acquisition
The MEG data were acquired with a 151‐sensor axial gradiometer system (CTF Systems, Port Coquitlam, Canada) placed in a magnetically shielded room. In addition, the horizontal and vertical electrooculogram (EOG) were recorded to later discard trials contaminated by eye movements and blinks. The ongoing MEG and EOG signals were low‐pass filtered at 300 Hz, digitized at 1,200 Hz, and stored for off‐line analyses. Prior to and after the data acquisition, the subjects' head position relative to the gradiometer array was determined using coils positioned at the subject's nasion, and at the left and right ear canal.
High‐resolution anatomical images (voxel size = 1 mm3) of the whole brain were acquired using a 1.5‐T Siemens Sonata whole‐body scanner (Erlangen, Germany). These images were used for reconstruction of individual head shapes to create forward models for the source reconstruction procedures described later.
Preprocessing
The data analysis was performed using the FieldTrip which is an open source Matlab toolbox developed at the F. C. Donders Centre for Cognitive Neuroimaging (http://www.ru.nl/fcdonders/fieldtrip). Data segments contaminated with artifacts, eye movements, eye blinks, muscle activity, and jumps in the superconducting quantum interference devices (SQUIDS), were detected with a semiautomatic routine and discarded. When analyzing the topography of the power spectra at the sensor level we computed the planar gradiometer representation of the data [Bastiaansen and Knosche, 2000]. The calculated planar field gradient approximates the signals measured by physical planar gradiometers. This is often advantageous when analyzing MEG signals, because the strongest field magnitude of the planar gradient signal usually is situated above the neural sources [Ahonen et al., 1993]. The horizontal and vertical components of the planar gradients were estimated at each sensor location using the fields from the sensor and its neighboring sensors. The power values for the horizontal and vertical components after the spectral analysis were summed for each sensor location. For the ERFs the root‐mean square were calculated for the horizontal and vertical components. The same approach has been used in several other publications [Bauer et al., 2006; Jokisch and Jensen, 2007; Nieuwenhuis et al., 2008; Osipova et al., 2006]. For source reconstruction, we used the data from the true axial sensors and not the planar gradient estimate.
Prestimulus Frequency Analysis
The oscillatory activity was characterized by calculating the power spectra using one second intervals of data preceding the stimulus. A 1,200 data points Hanning taper (1 s long) was applied to the data prior to calculating the spectra. The spectra were calculated for the individual trials and the averaged.
Postresponse Time‐Frequency Representations of Power
Time‐frequency representations (TFRs) of power were calculated for each trial using a taper approach applied to short sliding time windows [Percival and Walden, 1993]. The data in each time window were multiplied with a Hanning taper having the length of the time window for the frequencies 2–30 Hz. The power values were calculated for the horizontal and vertical components of the estimated planar gradient and summed. The planar gradient power estimates were subsequently then averaged over trials for a given condition. We applied an adaptive time window of three cycles for each frequency (ΔT = 3/f). (A similar approach was used in Jokisch and Jensen [2007] and Osipova et al. [2006].
Statistical Analysis
The difference in frequency power between conditions was first quantified within each subject over all trials by means of t‐values which subsequently were converted to z‐values (SPM2, http://www.fil.ion.ucl.ac.uk/spm). The variance was estimated over trials. This procedure served to normalize the power values and to reduce the contribution of subjects with large variance in the power estimates. The significance of the difference in z‐values between conditions over subjects (random effects analysis) was tested by means of the cluster level randomization test proposed by Maris and Oostenveld [2007] also incorporated in the FieldTrip software. This test controls the Type‐1 error rate in a situation involving multiple comparisons (e.g. multiple sensors and/or time‐frequency tiles). The statistical analyses were conducted separately for each of the three frequency bands: theta (4–7 Hz), alpha (10–11 Hz), beta (18–24 Hz). These bands were loosely based on the main frequency bands used to classify the spontaneous EEG [IFSCN, 1974], and prior literature [Ergenoglu et al., 2004; Linkenkaer‐Hansen et al., 2004; Mazaheri and Picton, 2005; Thut et al., 2006; van Dijk et al., 2008; Yordanova et al., 2003; Zhang et al., 2008a, b]. From those frequency‐bands and the entire set of time points, the z‐values were subjected to a cluster‐level test. In the second step the Monte Carlo estimate of the permutation P‐value of the cluster is obtained by comparing the cluster‐level test statistic to a randomization null distribution assuming no difference between conditions. This distribution is obtained by 1,000 times randomly swapping the conditions in subjects and calculating the maximum cluster‐level test statistic. Using 1,000 random draws the Monte Carlo P‐value is an accurate estimate of the true P‐value. The same procedures were followed for the statistical analysis of the frontal theta‐alpha topography of correlations except that it was the raw correlation values at each sensor which was subjected to a cluster‐level test.
Source Reconstruction
Source reconstruction was performed using a frequency‐domain beam‐forming approach [Dynamic Imaging of Coherent Sources, DICS]. The DICS technique uses adaptive spatial filters to localize power in the entire brain [Gross et al., 2001; Liljeström et al., 2005]. A realistically shaped single‐shell description of the brain‐skull interface was constructed, based on the individual anatomical MRIs [Nolte, 2003]. The brain volume of each individual subject was discretized to a grid with a 0.8 cm resolution and the lead field was calculated for each grid point. Using the cross‐spectral density matrices and the lead‐field, a spatial filter was constructed for each grid point [Gross et al., 2001], after which the power at each grid point was estimated for both conditions separately in every subject. One filter was calculated for all conditions and then applied for the data divided over the individual conditions. Sources were estimated on time‐frequency tiles that were preselected from the sensor level analysis. As a first step, z‐values of the source estimates were calculated over trials, comparing the conditions within each subject. Prior to averaging the source estimates of the individual subjects' functional data, the individual anatomical MRI images were spatially normalized to the MNI brain [Montreal Neurological Institute (MNI), Montreal, Quebec, Canada; http://www.bic.mni.mcgill.ca/brainweb] using SPM2 (http://www.fil.ion.ucl.ac.uk/spm). The z‐values displayed for the source plots are uncorrected for multiple comparisons.
RESULTS
Fourteen subjects performed a Go‐noGo task in which they had to respond to a frequent Go stimulus (digits 1–4 and 6–9) but had to withhold responses to an infrequent noGo stimulus (digit 5).
Behavioral Data
The grand average of mean reaction times (RTs) for False Alarms (mean = 296 ms, SD = 39) was significantly shorter than for Hits (mean = 336 ms, SD = 28) (P < 0.001, two‐sided t‐test). This replicates previous studies showing that errors are more likely for short RTs [Manly et al., 1999; Robertson et al., 1997]. This speeding is likely to reflect a temporary inattention as participants are lulled into an “automatic” response mode [Robertson et al., 1997].
High Prestimulus Alpha Activity Predicts Response Errors
We set out to investigate if prestimulus oscillatory activity reflected states in which subjects were more prone to committing errors. This was done by comparing the prestimulus power spectra for False Alarms to Correct Withholds. Statistical comparison revealed significantly greater alpha activity (10–11 Hz) preceding False Alarms than preceding Correct Withholds at sensors over posterior and left central regions (P < 0.008; Fig. 1A). The same analysis did not yield any significant difference in the prestimulus amplitude of theta and beta activity between False Alarms and Correct Withholds. To identify the sources accounting for the difference in alpha, we applied a beamforming technique. When contrasting False Alarms to Correct Withholds we identified the sources in occipital cortex and left and right primary sensorimotor cortex (Fig. 1B). Note the sources were slightly more central than the hand area of primary motor cortex. The location of the occipital source and the left sensorimotor sources were consistent with differences in 10–11 Hz power observed at the sensor level (see Fig. 1).
Figure 1.
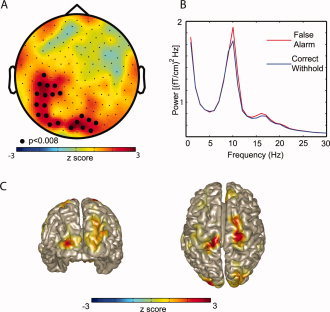
The power calculated in prestimulus interval (time −1 to 0 s) for False Alarms compared to Correct Withholds. (A) Topography of the 10–11 Hz power of the difference between False Alarms and Correct Withholds averaged over subjects (planar gradient). The cluster of sensors showing significantly stronger alpha power for False Alarms than Correct Withholds is marked with dots (P < 0.008; cluster randomization routine). (B) Grand average of the spectra calculated (−1 to 0 s; red line, False Alarms; blue line, Correct Withholds). The spectra were averaged over the cluster of sensors that showed a significant difference. (C) Using a beamforming approach we identified the regions accounting for the difference in alpha power between False Alarms and Correct Rejections to occipital and sensorimotor cortex.
We examined if the prestimulus oscillatory power was correlated with subsequent reaction‐times on a trial‐by‐trial basis. We found that prestimulus alpha activity had no effect on reaction‐times. Moreover, there was no difference in the amplitude of prestimulus alpha activity when a subset of Hit trials with fast reaction‐times was compared to those of slow reaction times. We conclude that alpha activity in occipital cortex and ∼10 Hz mu activity in sensorimotor areas are predictive of failures to inhibit motor responses.
Increase in Frontal Theta and Decreases in Alpha and Beta Activity Follow Response Errors
To investigate changes in brain states after an error was committed, we analyzed the postresponse interval aligned to the button press. We found that for both types of responses there was a transient increase in theta power (3–7 Hz) at the time of the button press, followed by posterior alpha (10–11 Hz) and central beta (18–24 Hz) suppression (see Supporting Information Fig. 1). Both the alpha and beta power rebounds at ∼500 ms were stronger for Hits than False Alarms. Subsequently, our analysis focused on the postresponse differences in oscillatory activity between False Alarm and Hit trials. Between 0 and 600 ms after the button press, theta power (3–7 Hz) was higher for False Alarm responses than for Hits in a cluster comprising frontal sensors (P < 0.001; Fig. 2A,B). The beamforming technique allowed us to localize the difference in theta activity to the left superior frontal gyrus, left superior medial gyrus, and right middle frontal gyrus (Fig. 2C). Because of the frontal distribution of the effects in the theta band, artifacts from eye movements and blinks are a concern in case the ocular artifact rejection routines did not work perfectly. To rule out such concerns, we also performed analysis on the horizontal and vertical EOG sensors. We found no significant difference in the amount of theta activity between the false alarms and hits. We conclude that eye movements and blinks do not contribute to the error related effects in the theta band.
Figure 2.
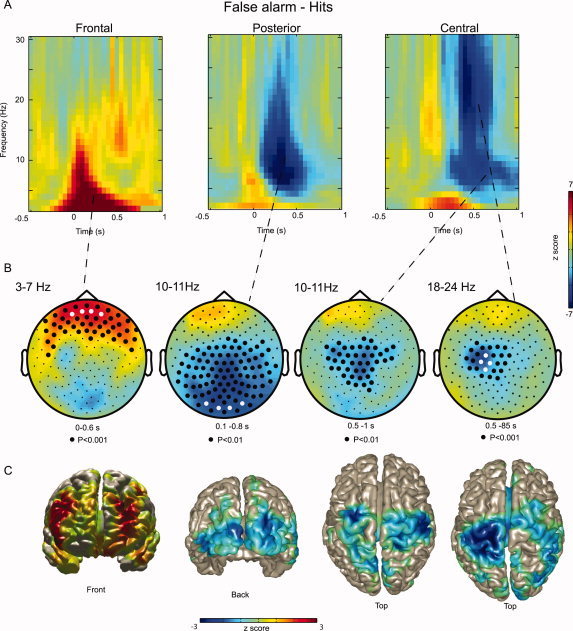
The power of oscillatory activity characterized in the postresponse interval for False Alarms compared to Hits. (A) Grand average of the difference TFRs (False Alarms–Hits) of representative frontal, posterior and central sensors (sensors marked in white). The button press occurred at t = 0 s. No baseline correction was applied. (B) Grand average of the topography of theta (3–7 Hz), alpha (10–11 Hz), mu (10–11 Hz), and beta (18–24 Hz) activity. The dots denote clusters representing significant differences (cluster randomization routine). (C) A beamforming technique was applied to localize the regions responsible for producing the difference in the power shown in (B). The theta increase was localized to frontal regions. Decrease in alpha and mu activity was localized to occipital cortex and extended sensorimotor areas. The beta decrease was localized to primary sensorimotor areas.
Between 100 and 800 ms after the button press, alpha activity (10–11 Hz) was lower for False Alarms than for Hits in central and posterior sensors (Fig. 2A; central panel; P < 0.01). The sources responsible for this decrease in alpha activity were localized in occipital cortex (Fig. 2C). Between 500 and 1,000 ms after the button press, mu activity (10–11 Hz) was lower over central areas for the same comparison (P < 0.01; Fig. 2B). The sources of the mu rhythm were localized to the left and right sensorimotor regions extending into premotor areas (Fig. 2C). Finally between 500 and 850 ms after the button press, beta power (18–24 Hz) was lower for False Alarms compared to Hits constrained to left central sensors (P < 0.0001; Fig. 2A,B). The primary source of the difference in the beta band was localized to sensorimotor cortex (Fig. 2C). In sum, when comparing erroneous to correct button presses, we found that errors were followed by an immediate increase in theta activity produced in frontal cortex, followed by a decreases in occipital alpha and sensorimotor mu and beta activity.
Functional Coupling Between Frontal Theta and Posterior Alpha Activity
Do the changes in frontal theta activity following an error have consequences for the activity in posterior areas? To address this question, we conducted an analysis quite similar to the psychophysiological interactions (PPI) approach often applied to fMRI data [Friston et al., 1997]. A psychophysiological interaction entails examining how the correlation between the activities in two areas changes with respect to an experimental manipulation. For our purposes rather than investigating cognitive modulations in BOLD signal correlations between different regions, we investigated the correlation in power changes in various frequency bands. Specifically, we asked if there were error‐related interactions between the postresponse frontal theta activity and posterior alpha activity at a time interval of 0–0.5 s after the response. We chose two frontal sensors displaying a strong difference in the theta band (False Alarms and Hits). For both Hits and False alarms, the trial‐by‐trial theta power from the seed sensors was anti‐correlated with the alpha power across all other sensors to create topographies of the correlation. The statistical significance of these topographies were assessed at the group level with a one‐sample t‐test of the correlations at each sensor and then subjected to a cluster‐level randomization test (see Methods) to correct for multiple comparisons. We found significant cross‐frequency coupling expressed as anticorrelations between frontal theta and alpha power in a cluster of right occipital sensors for False Alarms (P < 0.028, Fig. 3, left panel), but not Hits (Fig. 3, middle panel). Moreover, the anti‐correlations of these right occipital sensors were significantly greater in magnitude for False Alarms compared to Hits (pair‐wise t‐test, P < 0.026; Fig. 3B, left panel).This is also displayed in right panel of Figure 3B where we plot the correlation between frontal theta and occipital alpha power for Hits versus False Alarms. Note that most of the data points fall above the diagonal. To rule out concerns that eye movements or blinks could explain the frontal theta and posterior alpha coupling, we repeated the abovementioned analysis using the horizontal and the vertical EOG electrodes as the seed sensors. We did not find any significant task dependent changes in correlations between the theta in either of the EOG electrodes and the alpha activity across the MEG sensors. In sum, we found that after erroneous button presses, the frontal theta activity became significantly anticorrelated with occipital alpha activity.
Figure 3.
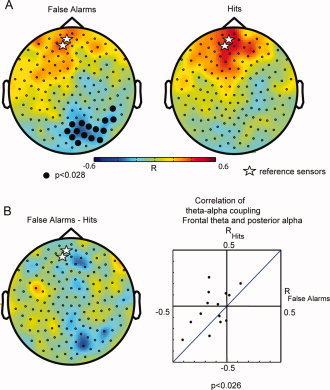
Correlations between the frontal theta increase and the posterior alpha decrease. Two frontal sensors (marked with stars) were used a reference for the correlation analysis. The correlations between theta power in the reference sensors and the alpha power in all the other sensors were calculated on a trial‐by‐trial basis (0–500 ms after response). (A) Left panel: grand average of the theta‐alpha correlation for False Alarms. Note the strong anticorrelation in an isolated region over posterior regions (P < 0.028, one sample t‐test, cluster randomization routine). Right panel: grand average of the theta‐alpha correlations for Hits. There were no significant correlations. (B) The difference in theta‐alpha power correlations between False Alarms and Hits. Right panel, the theta‐alpha power correlation of the 14 subjects for False Alarms (x‐axis) and Hits (y‐axis). They were calculated for the two frontal sensors (marked by stars) and the posterior significant sensors (A, right panel). The correlations over the right posterior sensors were significantly more negative for False Alarm than Hits (P < 0.026, pair‐wise t‐test).
Errors Generated a Response‐Locked ERNm Over Frontal Regions
Planar gradient representations (see Methods) were calculated for the ERFs time‐locked to the button press (Fig. 4A). As baseline we used a 100 ms interval prior to the button press. During the first 0.5 s the ERFs were larger for False Alarms than Hits. This effect was significant in a large left‐lateralized cluster dominated by frontal sensors (P < 0.001; Fig. 4B). Because of the topography and time‐course of the difference in the ERFs between False Alarms and Hits, we consider it to be the magnetic equivalent (ERNm) of the error‐related negativity (ERN) identified using EEG [Coles et al., 2001; Falkenstein et al., 2000]. Consistent with the MEG findings of Stemmer et al. [2004] this activation tended to occur later in MEG than EEG data, possibly indicating that EEG and MEG do not detect identical neural networks involved in error‐related processes. Next we calculated the time frequency representations (TFRs) of the ERFs. The difference in ERFs for False Alarms versus Hits in the 3–7 Hz theta band was significant in a cluster over frontal sensors (P < 0.001; Fig. 4C,D). We did not find any significant difference with respect to alpha and beta bands in the TFRs of the ERFs. Thus, its likely that in our data a major part of the ERNm can be attributed to theta activity phase‐locked to the button press [Luu and Tucker, 2001; Makeig et al., 2004].
Figure 4.
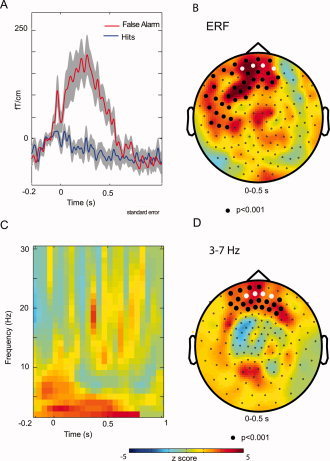
The time‐locked signals in the postresponse interval. (A) The ERFs with respect to False Alarms (red) and Hits (blue) for representative frontal sensors (marked in white). Button press was a t = 0 s. (B) The topography of the ERF difference between False Alarms and Hits (0–0.5 s). Even though the difference was dominated by frontal sensors, the cluster of sensors representing the significant difference (P < 0.001; cluster randomization routine) was large. (C) The difference in TFRs of the ERFs for False Alarms and Hits. (D) The topography of the difference in TFRs of the ERFs. Note the frontal distribution of the significant cluster (P < 0.001; cluster randomization routine).
DISCUSSION
We have investigated oscillatory brain activity in a Go‐noGo task. We found that increases in prestimulus 10–11 Hz alpha and mu activity produced in occipital and sensorimotor regions were predictive of errors. After an error was committed we found that 10–11 Hz alpha activity was reduced in occipital and sensorimotor regions including premotor regions. That was in contrast to frontal theta activity which was stronger for errors than correct trials. The frontal theta activity was phase‐locked to the button press and reflects to a large degree the frequency domain representations of the magnetic ERN (ERNm). Following errors we observed a correlation between the increase in frontal theta activity and the suppression of posterior alpha activity. This functional connectivity suggests a top‐down drive to perceptual areas setting the state of the brain to minimize errors in subsequent trials.
Alpha Activity Reflects a State of Reduced Perception
For subjects to perform the Go‐noGo task several steps are required. First, the visual stimulus has to be perceived. After perceiving the stimulus a decision has to be made on the action. Finally, the decision should be transformed into a motor operation or not. One might expect that errors would be reflected in brain areas directly involved in decision making [Bray and O'Doherty, 2007; Bray et al., 2007; O'Doherty et al., 2007]; we found that ∼10 Hz activity in visual and sensorimotor areas was predictive of errors.
It has been suggested that posterior alpha activity reflects functional inhibition of the visual stream. This is supported by covert attention and working memory tasks demonstrating a stimulus specific alpha decrease of the specific visual stream engaged in a given task [Jokisch and Jensen, 2007; Medendorp et al., 2007; Rihs et al., 2007; Romei et al., 2008a, b; Thut et al., 2003, 2006]. Moreover, alpha activity in the visual stream not required for the task is often increased. In addition, it has been shown that visual discrimination abilities are reduced with an increase in posterior alpha activity [van Dijk et al., 2008; Zhang et al., 2008b]. A recent study by Zhang et al. [2008b] found that prestimulus alpha activity at visual occipital cortical sites was positively correlated with reaction‐times in macaque monkeys performing a visuomotor pattern discrimination task. They interpreted the higher levels of alpha activity to correspond to less efficient visual stimulus processing, hence, longer reaction‐times. In this study, the increase in posterior alpha activity and thus functional inhibition might result in longer times for perceiving the stimuli. The longer processing time makes it more difficult for the subject to suppress the motor response when noGo stimuli are presented.
The stronger 10 Hz mu activity in sensorimotor areas predicting response errors is more difficult to explain. The 10 Hz mu activity has been associated with functional inhibition of sensorimotor areas. There are a number of studies that found a clear depression in the central ∼10 Hz rhythm during motor execution and somatosensory stimulation [Hari and Salmelin, 1997; Salmelin et al., 1995; Salmelin and Hari, 1994]. It could be that when subjects are in the automatic response mode the central ∼10 Hz mu activity is relatively high even though motor responses are executed. The relatively high ∼10 Hz activity makes the motor system less responsive to external inputs such as signals serving to inhibit an automatic motor action. An alternate explanation could be that the central mu reflects an automatic, over‐learned response mode where cortical motor areas are less active while subcortical structures are more engaged. This is consistent with evidence that as a motor sequence is explicitly learned, the contribution of the motor cortex execution of the task is reduced while other brain structures assume more active roles [Pascual‐Leone et al., 1999]. Moreover, Zhuang et al. [1997] have reported mu increases (relative to baseline) after over‐learning in many of their subjects. Further, we investigated if the prestimulus oscillatory power correlated with subsequent reaction‐times on a trial‐by‐trial basis. We found that prestimulus alpha activity had no effect on reaction‐times. Moreover, there was no difference in the amplitude of prestimulus alpha activity when a subset of Hit trials with fast reaction‐times was compared to those of slow reaction times. Thus, we suggest that alpha activity in the occipital and motor regions does not directly correspond to the automization of the motor responses. This leads us to cautiously conjecture that the high prestimulus mu in False Alarm trials is likely to be related to more executive inhibitory processes in which the motor system is less responsive to inputs from other regions such as signals serving to inhibit an automatic motor action.
After Error the Brain State Is Altered to Prevent Subsequent Errors
How do we explain the decrease in occipital and sensorimotor alpha and beta band activity following erroneous button presses? Our interpretation is that the occipital alpha activity is reduced after an error to engage the visual system stronger to prevent subsequent errors. The decrease in occipital alpha is likely to increase the processing accuracy or speed in the visual stream thus allowing for a faster inhibition of a wrongly initiated button press. The decrease of the central mu and beta activity after a wrong key press might reflect that the sensorimotor system is becoming further engaged. This stronger engagement can facilitate the inhibition of the motor system if needed in subsequent trials. Thus, the decrease in occipital and sensorimotor alpha, mu, and beta activity defines a more alert brain state facilitating visual processing and control of the motor system. However, an alternate interpretation could be that the post‐error response changes merely reflect an “oddball effect” related to the processing of the infrequent target [Mazaheri and Picton, 2005]. This interpretation could be tested by directly comparing the brain activity for hits versus correct rejections. This is however not feasible due to the presence of the motor response (only in the hits trials) creating a confound.
Functional Connectivity Can Be Studies by Cross‐Frequency Power Correlations
It has been proposed that communication or functional connectivity between different brain areas can be studied by means of phase‐synchronization between different brain regions [Varela et al., 2001]. This approach is not suitable for our data given that frontal and posterior areas are dominated by power changes in different frequency bands. Thus, we here use the approach of calculating the trial‐by‐trial correlation between different frequency bands. As for the psychophysical interaction (PPI) approach [Friston et al., 1997], we were able to identify significant changes in power correlation with respect to a cognitive modulation (Fig. 3B). It should be mentioned that our results cannot be explained by spurious correlations due to cross‐talk or volume conduction. The correlations were identified between different frequency bands and they were long‐range between frontal and posterior (Fig. 3A). Thus, our simple approach provides a novel but powerful method for investigating functional connectivity in human electrophysiological data.
Frontal Theta and ERNm Provides a Top‐Down Drive Setting the State of the Brain
After erroneous button presses, the frontal theta activity became significantly anti‐correlated with occipital alpha activity. Given that frontal theta increase occurs slightly earlier than the alpha decrease, it might serve to reflect a top‐down modulation by which oscillatory alpha activity in visual areas is suppressed. Although we concede that we have no direct evidence of a causal interaction in our current study, such top‐down modulation would be consistent with previous work supporting the role of frontal regions in executive top‐down processes [Miller and D'Esposito, 2005; Picton et al., 2007; Stuss et al., 2003]. Unfortunately, we had too few repeated errors to access how the top‐down driven changes in brain activity after a mistake directly would serve to prevent subsequent errors.
The stronger evoked frontal theta activity following errors was associated with frontal ERNm [Coles et al., 2001; Falkenstein et al., 2000]. The theta activity was localized to the frontal regions of the cortex such as left superior frontal gyrus, left superior medial gyrus, and right middle frontal gyrus which overlaps with areas found in a EEG‐fMRI study localizing the ERN [Debener et al., 2005]. Interestingly, a recent fMRI study found that activation in the regions corresponding to the default mode brain network predicted the likelihood of an error [Eichele et al., 2008]. There is also evidence that frontal theta is negatively correlated with the default mode network [Scheeringa et al., 2008]. Thus, it might be that the error related theta modulates maladaptive brain activity through the suppression of the default mode network.
CONCLUSION
In summary, by examining the state of the brain before a stimulus we were able to show that it is possible to predict lapses of attention before they actually occur. This supports the case that the state of the brain is important for how incoming stimuli are processed and for how subjects respond. Our findings also have practical applications. A lot of effort is being devoted to develop brain computer interfaces (BCIs) [Lebedev and Nicolelis, 2006]. We suggest that prestimulus activity in the alpha band can be applied online to predict if subjects are in a state where errors are more likely to be committed. However, it must be noted that it remains to be investigated how well we can predict errors based on single trials data. Some of the current pathophysiological models pertaining to attention deficits in clinical groups such as ADHD suggest that the impaired execute control is related to impaired interactions (i.e. functional connectivity) between brain regions [Castellanos et al., 2006; Murias et al., 2007]. It would be of great interest to investigate if the impaired executive control is reflected as a decrease in functional connectivity as assessed by reduced correlations between frontal theta and posterior alpha power.
Supporting information
Additional Supporting Information may be found in the online version of this article.
Supporting Material
REFERENCES
- Ahonen AI,Hamalainen MS,Ilmoniemi RJ,Kajola MJ,Knuutila JE,Simola JT,Vilkman VA ( 1993): Sampling theory for neuromagnetic detector arrays. IEEE Trans Biomed Eng 40: 859–869. [DOI] [PubMed] [Google Scholar]
- Bastiaansen MC,Knosche TR ( 2000): Tangential derivative mapping of axial MEG applied to event‐related desynchronization research. Clin Neurophysiol 111: 1300–1305. [DOI] [PubMed] [Google Scholar]
- Bauer M,Oostenveld R,Peeters M,Fries P ( 2006): Tactile spatial attention enhances gamma‐band activity in somatosensory cortex and reduces low‐frequency activity in parieto‐occipital areas. J Neurosci 26: 490–501. [DOI] [PMC free article] [PubMed] [Google Scholar]
- Bokura H,Yamaguchi S,Kobayashi S ( 2001): Electrophysiological correlates for response inhibition in a Go/NoGo task. Clin Neurophysiol 112: 2224–2232. [DOI] [PubMed] [Google Scholar]
- Bray S,O'Doherty J ( 2007): Neural coding of reward‐prediction error signals during classical conditioning with attractive faces. J Neurophysiol 97: 3036–3045. [DOI] [PubMed] [Google Scholar]
- Bray S,Shimojo S,O'Doherty JP ( 2007): Direct instrumental conditioning of neural activity using functional magnetic resonance imaging‐derived reward feedback. J Neurosci 27: 7498–7507. [DOI] [PMC free article] [PubMed] [Google Scholar]
- Castellanos FX,Sonuga‐Barke EJ,Milham MP,Tannock R ( 2006): Characterizing cognition in ADHD: Beyond executive dysfunction. Trends Cogn Sci 10: 117–123. [DOI] [PubMed] [Google Scholar]
- Coles MG,Scheffers MK,Holroyd CB ( 2001): Why is there an ERN/Ne on correct trials? Response representations, stimulus‐related components, and the theory of error‐processing. Biol Psychol 56: 173–189. [DOI] [PubMed] [Google Scholar]
- Debener S,Ullsperger M,Siegel M,Fiehler K,von Cramon DY,Engel AK ( 2005): Trial‐by‐trial coupling of concurrent electroencephalogram and functional magnetic resonance imaging identifies the dynamics of performance monitoring. J Neurosci 25: 11730–11737. [DOI] [PMC free article] [PubMed] [Google Scholar]
- Eichele T,Debener S,Calhoun VD,Specht K,Engel AK,Hugdahl K,von Cramon DY,Ullsperger M ( 2008): Prediction of human errors by maladaptive changes in event‐related brain networks. Proc Natl Acad Sci USA 105: 6173–6178. [DOI] [PMC free article] [PubMed] [Google Scholar]
- Ergenoglu T,Demiralp T,Bayraktaroglu Z,Ergen M,Beydagi H,Uresin Y ( 2004): Alpha rhythm of the EEG modulates visual detection performance in humans. Brain Res Cogn Brain Res 20: 376–383. [DOI] [PubMed] [Google Scholar]
- Falkenstein M,Hoormann J,Christ S,Hohnsbein J ( 2000): ERP components on reaction errors and their functional significance: A tutorial. Biol Psychol 51: 87–107. [DOI] [PubMed] [Google Scholar]
- Friston KJ,Buechel C,Fink GR,Morris J,Rolls E,Dolan RJ ( 1997): Psychophysiological and modulatory interactions in neuroimaging. Neuroimage 6: 218–229. [DOI] [PubMed] [Google Scholar]
- Gross J,Kujala J,Hämäläinen M,Timmermann L,Schnitzler A,Salmelin R ( 2001): Dynamic imaging of coherent sources: Studying neural interactions in the human brain. Proc Natl Acad Sci USA 98: 694–699. [DOI] [PMC free article] [PubMed] [Google Scholar]
- Hari R,Salmelin R ( 1997): Human cortical oscillations: A neuromagnetic view through the skull. Trends Neurosci 20: 44–49. [DOI] [PubMed] [Google Scholar]
- IFSCN ( 1974): International Federation of Societies for Clinical Neurophysiology, A glossary of terms most commonly used by clinical electroencephalographers. Electroencephalogr Clin Neurophysiol 37: 538–548. [DOI] [PubMed] [Google Scholar]
- Jaffard M,Longcamp M,Velay JL,Anton JL,Roth M,Nazarian B,Boulinguez P ( 2008): Proactive inhibitory control of movement assessed by event‐related fMRI. Neuroimage 42: 1196–1206. [DOI] [PubMed] [Google Scholar]
- Jokisch D,Jensen O ( 2007): Modulation of gamma and alpha activity during a working memory task engaging the dorsal or ventral stream. J Neurosci 27: 3244–3251. [DOI] [PMC free article] [PubMed] [Google Scholar]
- Lebedev MA,Nicolelis MA ( 2006): Brain‐machine interfaces: Past, present and future. Trends Neurosci 29: 536–546. [DOI] [PubMed] [Google Scholar]
- Liljeström M,Kujala J,Jensen O,Salmelin R ( 2005): Neuromagnetic localization of rhythmic activity in the human brain: A comparison of three methods. Neuroimage 25: 734–745. [DOI] [PubMed] [Google Scholar]
- Linkenkaer‐Hansen K,Nikulin VV,Palva S,Ilmoniemi RJ,Palva JM ( 2004): Prestimulus oscillations enhance psychophysical performance in humans. J Neurosci 24: 10186–10190. [DOI] [PMC free article] [PubMed] [Google Scholar]
- Luu P,Tucker DM ( 2001): Regulating action: Alternating activation of midline frontal and motor cortical networks. Clin Neurophysiol 112: 1295–1306. [DOI] [PubMed] [Google Scholar]
- Makeig S,Delorme A,Westerfield M,Jung TP,Townsend J,Courchesne E,Sejnowski TJ ( 2004): Electroencephalographic brain dynamics following manually responded visual targets. PLoS Biol 2: e176. [DOI] [PMC free article] [PubMed] [Google Scholar]
- Manly T,Robertson IH,Galloway M,Hawkins K ( 1999): The absent mind: Further investigations of sustained attention to response. Neuropsychologia 37: 661–670. [DOI] [PubMed] [Google Scholar]
- Maris E,Oostenveld R ( 2007): Nonparametric statistical testing of EEG‐ and MEG‐data. J Neurosci Methods 164: 177–190. [DOI] [PubMed] [Google Scholar]
- Mazaheri A,Picton TW ( 2005): EEG spectral dynamics during discrimination of auditory and visual targets. Brain Res Cogn Brain Res 24: 81–96. [DOI] [PubMed] [Google Scholar]
- Medendorp WP,Kramer GF,Jensen O,Oostenveld R,Schoffelen JM,Fries P ( 2007): Oscillatory activity in human parietal and occipital cortex shows hemispheric lateralization and memory effects in a delayed double‐step saccade task. Cereb Cortex 17: 2364–2374. [DOI] [PubMed] [Google Scholar]
- Miller BT,D'Esposito M ( 2005): Searching for “the top” in top‐down control. Neuron 48: 535–538. [DOI] [PubMed] [Google Scholar]
- Murias M,Swanson JM,Srinivasan R ( 2007): Functional connectivity of frontal cortex in healthy and ADHD children reflected in EEG coherence. Cereb Cortex 17: 1788–1799. [DOI] [PMC free article] [PubMed] [Google Scholar]
- Nieuwenhuis IL,Takashima A,Oostenveld R,Fernandez G,Jensen O ( 2008): Visual areas become less engaged in associative recall following memory stabilization. Neuroimage 40: 1319–1327. [DOI] [PubMed] [Google Scholar]
- Nolte G ( 2003): The magnetic lead field theorem in the quasi‐static approximation and its use for magnetoencephalography forward calculation in realistic volume conductors. Phys Med Biol 48: 3637–3652. [DOI] [PubMed] [Google Scholar]
- O'Doherty JP,Hampton A,Kim H ( 2007): Model‐based fMRI and its application to reward learning and decision making. Ann N Y Acad Sci 1104: 35–53. [DOI] [PubMed] [Google Scholar]
- Osipova D,Takashima A,Oostenveld R,Fernández G,Maris E,Jensen O ( 2006): Theta and gamma oscillations predict encoding and retrieval of declarative memory. J Neurosci 26: 7523–7531. [DOI] [PMC free article] [PubMed] [Google Scholar]
- Pascual‐Leone A,Tarazona F,Keenan J,Tormos JM,Hamilton R,Catala MD ( 1999): Transcranial magnetic stimulation and neuroplasticity. Neuropsychologia 37: 207–217. [DOI] [PubMed] [Google Scholar]
- Percival DB,Walden AT ( 1993): Spectral Analysis for Physical Applications: Multitaper and Conventional Univariate Techniques. Cambridge, UK: Cambridge University Press. [Google Scholar]
- Picton TW,Stuss DT,Alexander MP,Shallice T,Binns MA,Gillingham S ( 2007): Effects of focal frontal lesions on response inhibition. Cereb Cortex 17: 826–838. [DOI] [PubMed] [Google Scholar]
- Rihs TA,Michel CM,Thut G ( 2007): Mechanisms of selective inhibition in visual spatial attention are indexed by alpha‐band EEG synchronization. Eur J Neurosci 25: 603–610. [DOI] [PubMed] [Google Scholar]
- Robertson IH,Manly T,Andrade J,Baddeley BT,Yiend J ( 1997): ‘Oops’: performance correlates of everyday attentional failures in traumatic brain injured and normal subjects. Neuropsychologia 35: 747–758. [DOI] [PubMed] [Google Scholar]
- Romei V,Brodbeck V,Michel C,Amedi A,Pascual‐Leone A,Thut G ( 2008a): Spontaneous fluctuations in posterior {alpha}‐band EEG activity reflect variability in excitability of human visual areas. Cereb Cortex 18: 2010–2018. [DOI] [PMC free article] [PubMed] [Google Scholar]
- Romei V,Rihs T,Brodbeck V,Thut G ( 2008b): Resting electroencephalogram alpha‐power over posterior sites indexes baseline visual cortex excitability. Neuroreport 19: 203–208. [DOI] [PubMed] [Google Scholar]
- Rubia K,Russell T,Overmeyer S,Brammer MJ,Bullmore ET,Sharma T,Simmons A,Williams SC,Giampietro V,Andrew CM,Taylor E ( 2001): Mapping motor inhibition: Conjunctive brain activations across different versions of go/no‐go and stop tasks. Neuroimage 13: 250–261. [DOI] [PubMed] [Google Scholar]
- Salmelin R,Hari R ( 1994): Spatiotemporal characteristics of sensorimotor neuromagnetic rhythms related to thumb movement. Neuroscience 60: 537–550. [DOI] [PubMed] [Google Scholar]
- Salmelin R,Forss N,Knuutila J,Hari R ( 1995): Bilateral activation of the human somatomotor cortex by distal hand movements. Electroencephalogr Clin Neurophysiol 95: 444–452. [DOI] [PubMed] [Google Scholar]
- Scheeringa R,Bastiaansen MC,Petersson KM,Oostenveld R,Norris DG,Hagoort P ( 2008): Frontal theta EEG activity correlates negatively with the default mode network in resting state. Int J Psychophysiol 67: 242–251. [DOI] [PubMed] [Google Scholar]
- Stemmer B,Vihla M,Salmelin R ( 2004): Activation of the human sensorimotor cortex during error‐related processing: A magnetoencephalography study. Neurosci Lett 362: 44–47. [DOI] [PubMed] [Google Scholar]
- Stuss DT,Murphy KJ,Binns MA,Alexander MP ( 2003): Staying on the job: The frontal lobes control individual performance variability. Brain 126(Part 11): 2363–2380. [DOI] [PubMed] [Google Scholar]
- Thut G,Theoret H,Pfennig A,Ives J,Kampmann F,Northoff G,Pascual‐Leone A ( 2003): Differential effects of low‐frequency rTMS at the occipital pole on visual‐induced alpha desynchronization and visual‐evoked potentials. Neuroimage 18: 334–347. [DOI] [PubMed] [Google Scholar]
- Thut G,Nietzel A,Brandt SA,Pascual‐Leone A ( 2006): Alpha‐band electroencephalographic activity over occipital cortex indexes visuospatial attention bias and predicts visual target detection. J Neurosci 26: 9494–9502. [DOI] [PMC free article] [PubMed] [Google Scholar]
- van Dijk H,Schoffelen JM,Oostenveld R,Jensen O ( 2008): Prestimulus oscillatory activity in the alpha band predicts visual discrimination ability. J Neurosci 28: 1816–1823. [DOI] [PMC free article] [PubMed] [Google Scholar]
- Varela F,Lachaux JP,Rodriguez E,Martinerie J ( 2001): The brainweb: Phase synchronization and large‐scale integration. Nat Rev Neurosci 2: 229–239. [DOI] [PubMed] [Google Scholar]
- Weissman DH,Roberts KC,Visscher KM,Woldorff MG ( 2006): The neural bases of momentary lapses in attention. Nat Neurosci 9: 971–978. [DOI] [PubMed] [Google Scholar]
- Yordanova J,Rosso OA,Kolev V ( 2003): A transient dominance of theta event‐related brain potential component characterizes stimulus processing in an auditory oddball task. Clin Neurophysiol 114: 529–540. [DOI] [PubMed] [Google Scholar]
- Zhang Y,Chen Y,Bressler SL,Ding M ( 2008a): Response preparation and inhibition: The role of the cortical sensorimotor beta rhythm. Neuroscience 156: 238–246. [DOI] [PMC free article] [PubMed] [Google Scholar]
- Zhang Y,Wang X,Bressler SL,Chen Y,Ding M ( 2008b): Prestimulus cortical activity is correlated with speed of visuomotor processing. J Cogn Neurosci 20: 1915–1925. [DOI] [PubMed] [Google Scholar]
- Zhuang P,Toro C,Grafman J,Manganotti P,Leocani L,Hallett M ( 1997): Event‐related desynchronization (ERD) in the alpha frequency during development of implicit and explicit learning. Electroencephalogr Clin Neurophysiol 102: 374–381. [DOI] [PubMed] [Google Scholar]
Associated Data
This section collects any data citations, data availability statements, or supplementary materials included in this article.
Supplementary Materials
Additional Supporting Information may be found in the online version of this article.
Supporting Material