

Abstract
Navigated transcranial magnetic stimulation combined with electroencephalography (nTMS‐EEG), allows noninvasive studies of cortical excitability and connectivity in humans. We investigated the reproducibility of nTMS‐EEG in seven healthy subjects by repeating left motor and prefrontal cortical stimulation with a 1‐week interval. TMS was applied at three intensities: 90, 100, and 110% of subjects' motor threshold (MT). The TMS‐compatible neuronavigation system guaranteed precise repositioning of the stimulation coil. The responses were recorded by a 60‐channel whole head TMS‐compatible EEG amplifier. A high overall reproducibility (r > 0.80) was evident in nTMS‐EEG responses over both hemispheres for both motor and prefrontal cortical stimulation. The results suggest that nTMS‐EEG is a reliable tool for studies investigating cortical excitability changes in the test‐retest designs. Hum Brain Mapp, 2009. © 2008 Wiley‐Liss, Inc.
Keywords: electroencephalography, motor cortex, prefrontal cortex, reproducibility, transcranial magnetic stimulation
INTRODUCTION
Noninvasive transcranial magnetic stimulation (TMS) [Barker et al., 1985] has been used to investigate cortical functions in humans and has become an important tool in the evaluation of central motor pathways [Meyer, 2002; Ziemann, 2002]. Cortical‐spinal excitability can be evaluated by recording electromyographic (EMG) responses elicited by TMS pulses from different muscles, and by estimating the pulse strength needed to elicit responses (motor threshold; MT). Both repetitive (rTMS) and single pulse TMS applied to association cortices may disturb [Amassian et al., 1989; Beckers and Homberg, 1991; Grafman et al., 1994; Pascual‐Leone et al., 1991, 2000] or enhance [Evers et al., 2001; Klimesch et al., 2003; Kohler et al., 2004; Luber et al., 2007; Topper et al., 1998] performance during cognitive tasks. In addition, rTMS over the dorsolateral prefrontal cortex may ameliorate depression [Fitzgerald et al., 2006; Gross et al., 2007; Klein et al., 1999; Pascual‐Leone et al., 1996]. The high reproducibility of TMS motor evoked potentials (MEPs) in single and paired‐pulse paradigms is well established [Carroll et al., 2001; Conforto et al., 2004; Corneal et al., 2005; de Carvalho et al., 1999; Humm et al., 2004; Kimiskidis et al., 2004; Maeda et al., 2002; Mills and Nithi, 1997; Wolf et al., 2004].
TMS combined with electroencephalography (EEG) enables the noninvasive evaluation of functional connections between brain areas [Ilmoniemi et al., 1997; Massimini et al., 2005; Paus, 1999; Paus et al., 1997, 1998] and provides a tool in investigating cortical excitability [Bailey et al., 2001; Bender et al., 2005; Bonato et al., 2006; Ilmoniemi et al., 1999; Kähkönen et al., 2001, 2003, 2004, 2005; Komssi et al., 2002, 2004; Nikouline et al., 1999; Nikulin et al., 2003; Paus et al., 2001; Schürmann et al., 2001; Tiitinen et al., 1999; Virtanen et al., 1997, 1999].
In navigated TMS (nTMS), the location of the TMS coil is shown over the individual MRI reconstruction of the subject's brain in real time. The locations of the stimulation sites can be saved for repeated measurements. Consequently, nTMS has been suggested as a precise tool for brain mapping studies, particularly for repeated measurements, as it allows reliable coil re‐placement [Neggers et al., 2004; Schonfeldt‐Lecuona et al., 2005]. nTMS combined with EEG (nTMS‐EEG) allows recordings of neuronal responses elicited by stimulation of cortical sites outside the primary motor cortex, e.g., in the prefrontal cortices [Kähkönen et al., 2001, 2003, 2005]. Applying nTMS in prefrontal cortex minimizes the variations in cortical target selection between the subjects.
Reproducibility of the TMS‐evoked EEG responses is an essential prerequisite for studies with test‐retest design, and it has not yet been reported. We investigated the reproducibility of nTMS‐EEG responses elicited by primary motor and dorsolateral prefrontal cortical (M1 and DLPFC respectively) stimulation in healthy subjects. Reproducibility of MT measurements has been investigated both with the “hot spot method” searching the maximum MEP strength [Conforto et al., 2004; Rossini et al., 1994], and the “fixed point” technique using fixed skull landmarks [Kimiskidis et al., 2004]. We have inspected the MT reproducibility by employing the “hot spot” method in nTMS.
METHODS
Seven healthy subjects (age 23–34 years, 4 men and 3 women, all right handed) participated in the study. The ethical committee of the Helsinki University Central Hospital approved the experimental procedures of the study. A written informed consent was obtained from all subjects.
A Magstim‐200 stimulator, connected to a co‐planar figure‐of‐eight Magstim‐P/N9925 induction coil of 70‐mm wing radius (The Magstim Company Ltd., Whitland, UK) was used to produce the TMS pulses. An eXimia NBS navigation system (Nexstim Ltd., Helsinki, Finland) was used for MRI‐guided neuronavigation. Our target was to minimize the stimulated cortical area and to ensure that the same cortical location was stimulated in repeated experiments (see Fig. 1).
Figure 1.
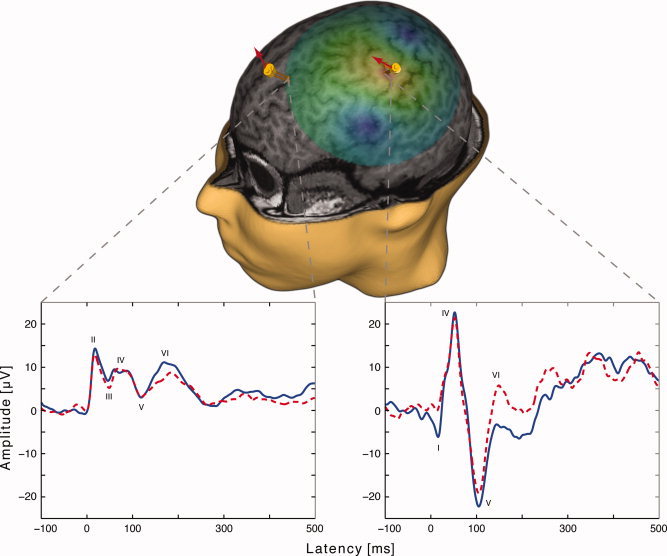
3D reconstruction of the MRIs from one subject. The two yellow markers over primary motor cortex (M1) and dorsolateral prefrontal cortex (DLPFC) represent the stimulation targets. Each marker shows the site of the delivery of the TMS pulse in two measurements with a 1‐week interval. The arrows indicate the coil orientation and induced current direction. The green highlighted area illustrates the estimated induced electric field during M1 stimulation. The two panels display the averaged EEG signals of each measurement from ROI electrodes after M1 and DLPFC nTMS on one subject. The signals were low‐pass filtered with a cut‐off frequency of 45 Hz. Navigation allows the exact re‐positioning of the coil resulting in reproducible TMS‐EEG responses.
The individual MRIs required for the 3D reconstruction and navigation were scanned with 1.5 T or 3 T devices (T1 weighted; 0 mm slice gap; 1 mm thickness; sagittal orientation; acquisition matrix 256 × 256; GE Healthcare, UK; Philips Medical Systems, Eindhoven, The Netherlands; Siemens Medical Solutions, Erlangen, Germany).
Two measurements with a 1‐week interval were conducted for each subject. The subjects were comfortably sitting in a chair with their eyes open and fixated on a point in the experiment room. The left primary motor cortex stimulation targeted the representation of the right abductor pollicis brevis (APB) muscle in the left hemisphere. The starting target point was located by the Ω‐or the reversed ϵ‐shaped structure in precentral gyrus [“motor knob,” Yousry et al., 1997] and then optimized by maximizing the MEPs recorded from the APB with a Keypoint electromyograph (Medtronic, Inc., MN). The MT was determined as a TMS intensity evoking contralateral MEPs of minimum 50 μV in resting APB, in 5 out of 10 given stimuli [Rossini et al., 1999, 1994]. The left middle frontal gyrus was located from a 3D MRI reconstruction, based on anatomical sketches [Yousry et al., 1997]. The average Talairach coordinates for DLPFC stimulation sites were −25 ± 4, 36 ± 8, 42 ± 7 (x, y, z; mean ± SD). Each site was stimulated at intensities of 90, 100, and 110% of the MT. MT is an appropriate measure for determining the stimulus intensity for targets in the prefrontal cortex [Kahkönen et al., 2004, 2005].
A hundred pulses were applied with each intensity. The interstimulus interval was 3.3 s and the inter‐session interval varied between 2 and 5 min. The order of the stimulation sites and stimulus intensities was kept the same for both measurements for each subject, but varied randomly between the subjects. The MR image‐guided navigation guaranteed that the coil orientation eliciting maximal MEPs was defined on the first measurement and kept the same in the M1 stimulation. This allowed the measurement of MT from exactly the same point in the second measurement for all subjects. In addition, in the beginning of the second measurement, a possible shift of the site eliciting maximal MTs was inspected before using the stimulation parameters from the first measurement; no such shifts were observed. The navigation tool also allowed the accurate placement of the coil over the selected stimulation site in the DLPFC; the coil was directed to be perpendicular to the middle frontal gyrus with the handle pointing laterally (see Fig. 1). During all sessions, the coil was mounted on a tripod stand with a flexible extension arm (Manfrotto Ltd., Bassano del Grappa, Italy).
The EEG responses to nTMS were recorded with sixty Ag/AgCl sintered electrodes specially designed for TMS‐EEG measurements to avoid overheating by eddy currents induced by TMS (Nexstim Ltd., Helsinki, Finland). The multichannel EEG array was connected to a TMS‐compatible EEG amplifier (eXimia, Nexstim Ltd., Helsinki, Finland). EEG sampling rate was 1450 Hz, bandwidth was 0.1–350 Hz, and 16‐bit AD conversion resolution was applied. During the magnetic pulse delivery, the EEG amplifier was blocked by a sample‐and‐hold circuitry for 2 ms to remove most of the TMS‐induced artefacts. After this “gating period,” the EEG signals contained mainly the physiological TMS‐evoked responses [Virtanen et al., 1999].
Analysis
Before averaging, the raw EEG was inspected for artifacts caused by eye movements, muscle activity or mechanical disturbances. Epochs with signals exceeding 50 μV were excluded from further analysis. At least 80 epochs per session were eligible for averaging for each subject after removing eye‐blinks and residual electrical contamination by TMS. Signals were averaged and low‐pass filtered with 45 Hz cut‐off frequency. The 600‐ms analysis period included a 95‐ms prestimulus baseline. Offline data processing was performed with Matlab 6.0 software (The Mathworks, Natick, MA).
To analyze general reproducibility of nTMS‐evoked potentials, we selected regions of interest (ROIs) in each hemisphere. Ten electrodes over and around the stimulated left M1 and the corresponding electrodes from contralateral hemisphere were selected for comparison of evoked potentials elicited by nTMS to M1. Similarly, bilateral ROIs of five electrodes were used for evaluating responses to prefrontal cortex nTMS (see Fig. 2). The signals from the selected electrodes were averaged for each hemisphere and each stimulation site.
Figure 2.
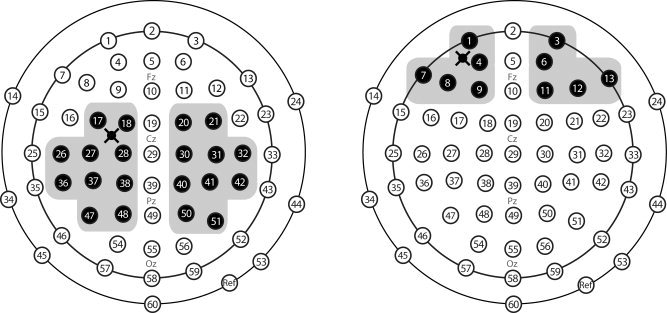
Schematic illustration of electrode positions in EEG cap. Shaded electrodes represent in the two encircled regions the two ROIs selected for primary motor (left panel) and dorsolateral prefrontal cortex (right panel) stimulation. The cross represents the stimulation site.
The area bound by the half‐maximum of the cortically induced electric field produced by figure‐of‐eight coil is usually larger than 5 cm2 [Komssi and Kähkönen, 2006]. Furthermore, in our study stimulation ranged from subthreshold (90% of MT) to suprathreshold (110% of MT) intensities; thus, both depth and size of the stimulated area were different [Heller and van Hulsteyn, 1992; Roth et al., 2002; Ruohonen and Ilmoniemi, 1998; Terao et al., 2000; Zangen et al., 2005]. Consequently, most studies with TMS‐evoked EEG responses report average responses from several electrodes in selected ROIs [Kähkönen and Wilenius, 2007; Kičić et al., 2008; Nikulin et al., 2003]. We used similar approach to add compatibility with the results of previous studies.
The peak amplitudes and latencies were calculated. Comparison of the first and second measurement of each session was done by paired two‐tailed t tests with Bonferroni correction (Table I). In addition, reproducibility was tested by two‐tailed Pearson's correlation coefficients with 0.05 level of significance. To increase power of correlation coefficient calculations, data of all intensities were collapsed (Table II). SPSS 14.0 software was employed for statistical analysis (SPSS, Chicago, IL).
Table I.
Mean Amplitudes (A; μV±SD) and latencies (B; ms±SD) of TMS‐evoked EEG deflections in two repeated measurements
| A | Ipsilateral M1‐amplitudes | Contralateral M1‐amplitudes | ||||||||||||||||
| 90%MT‐1 | 90%MT‐2 | 100%MT‐1 | 100%MT‐2 | 110%MT‐1 | 110%MT‐2 | 90%MT‐1 | 90%MT‐2 | 100%MT‐1 | 100%MT‐2 | 110%MT‐1 | 110%MT‐2 | |||||||
| peak I | −6.4 ± 5.1 | (5) | −6.8 ± 14.1 | −14.9 ± 21.7 | (5) | −16.7 ± 27.8 | −19.6 ± 26.7 | (4) | −32.7 ± 40.8 | −3.6 ± 2.9 | (3) | −3.6 ± 3.8 | −5.0 ± 6.3 | (4) | −4.9 ± 6.9 | −9.8 ± 3.9 | (2) | −12.6 ± 7.7 |
| peak II | 2.0 ± 3.3 | (4) | 3.9 ± 4.0 | 4.2 ± 4.6 | (5) | 5.6 ± 4.2 | 6.1 ± 4.8 | (4) | 6.6 ± 4.5 | 0.2 ± 3.1 | (4) | 1.3±1.1 | 2.0 ± 2.5 | (5) | 3.3 ± 2.6 | 4.4 ± 3.3 | (5) | 7.0 ± 7.6 |
| peak III | −2.3 ± 6.3 | (6) | −1.4 ± 8.2 | −3.4 ± 7.5 | (5) | −2.3 ± 9.1 | −0.7 ± 9.0 | (4) | −0.8 ± 8.0 | −3.5 ± 2.5 | (7) | −1.6±2.3 | −2.8 ± 2.3 | (7) | −2.5 ± 2.9 | −1.2 ± 1.7 | (7) | −0.2 ± 4.7 |
| peak IV | 4.7 ± 5.6 | (7) | 6.9 ± 3.0 | 5.4 ± 8.7 | (7) | 6.9 ± 8.5 | 13.7 ± 9.3 | (6) | 14.2 ± 12.5 | 1.7 ± 1.7 | (7) | 3.9±2.7 | 1.9 ± 2.3 | (7) | 2.1 ± 1.9 | 4.2 ± 3.5 | (7) | 6.7 ± 5.0 |
| peak V | −4.9 ± 4.8 | (7) | −2.6 ± 4.7 | −7.8 ± 8.0 | (7) | −8.1 ± 7.2 | −7.4 ± 8.7 | (7) | −9.8 ± 11.4 | −5.7 ± 3.2 | (7) | −3.5±3.7 | −5.6 ± 3.9 | (7) | −4.9 ± 3.3 | −5.6 ± 5.6 | (7) | −5.9 ± 5.6 |
| peak VI | 8.9 ± 3.5 | (7) | 8.4 ± 5.3 | 8.5 ± 5.0 | (7) | 6.7 ± 6.9 | 6.0 ± 9.0 | (6) | 4.4 ± 15.6 | 8.2 ± 3.0 | (7) | 8.8±4.1 | 9.2 ± 3.6 | (7) | 8.4 ± 4.5 | 9.5 ± 5.8 | (6) | 10.6 ± 5.9 |
| Ipsilateral DLPFC‐amplitudes | Contralateral DLPFC‐amplitudes | |||||||||||||||||
| 90%MT‐1 | 90%MT‐2 | 100%MT‐1 | 100%MT‐2 | 110%MT‐1 | 110%MT‐2 | 90%MT‐1 | 90%MT‐2 | 100%MT‐1 | 100%MT‐2 | 110%MT‐1 | 110%MT‐2 | |||||||
| peak I | — | (—) | — | — | (—) | — | — | (—) | — | 0.1 ± 1.2 | (4) | −0.1 ± 1.3 | −1.5 ± 1.9 | (3) | −2.1 ± 1.2 | −1.2 ± 1.9 | (3) | −2.3 ± 1.8 |
| peak II | 8.4 ± 7.3 | (7) | 7.9 ± 6.9 | 9.9 ± 9.4 | (5) | 9.5 ± 11.1 | 10.6 ± 13 | (5) | 13.2 ± 14.1 | 2 ± 2.1 | (6) | 2.6 ± 2.3 | 1.4 ± 1.8 | (5) | 3.4 ± 3.9 | 2.5 ± 4.5 | (5) | 4.1 ± 5.0 |
| peak III | 2.1 ± 3.6 | (6) | 3.2 ± 2.3 | 1.5 ± 4.1 | (5) | 1.7 ± 3.5 | 1.6 ± 4.6 | (5) | 3.9 ± 3 | −0.9 ± 1.3 | (5) | 0.1 ± 1 | −1.6 ± 1.8 | (6) | −0.8 ± 1.9 | −1.9±3.2 | (6) | −0.2 ± 2.5 |
| peak IV | 4.1 ± 3.8 | (7) | 6.6 ± 3.2* | 4.2 ± 5.1 | (6) | 5.8 ± 6.6 | 7.0 ± 5.6 | (7) | 9.3 ± 6.4 | 1.8 ± 2.4 | (6) | 3.2±3.0* | 1.6 ± 4.4 | (6) | 4.3 ± 5.4 | 4.5 ± 6.0 | (7) | 5.5 ± 5.0 |
| peak V | −0.5 ± 4.4 | (7) | 0.2 ± 4.6 | −1.8 ± 3.8 | (7) | 0.8 ± 5.2 | −0.8 ± 6.1 | (7) | 1.4 ± 5.9 | −1.2 ± 4.5 | (7) | −1.1 ± 4.6 | −2.5 ± 3.8 | (7) | −0.8 ± 4.8 | −1.6 ± 5.9 | (7) | −0.9 ± 1.8 |
| peak VI | 8.9 ± 3.0 | (7) | 9.6 ± 2.3 | 8.0 ± 2.9 | (7) | 10.3 ± 3.3 | 9.4 ± 2.9 | (7) | 9.7 ± 2.3 | 8.3 ± 3.3 | (7) | 9.1 ± 2.9 | 7.5 ± 3.2 | (7) | 10.3 ± 3.6 | 9.5 ± 3.7 | (7) | 8.9 ± 1.5 |
| B | Ipsilateral M1‐latencies | Contralateral M1‐latencies | ||||||||||||||||
| 90%MT‐1 | 90%MT‐2 | 100%MT‐1 | 100%MT‐2 | 110%MT‐1 | 110%MT‐2 | 90%MT‐1 | 90%MT‐2 | 100%MT‐1 | 100%MT‐2 | 110%MT‐1 | 110%MT‐2 | |||||||
| peak I | 12 ± 8 | 9 ± 8 | 14 ± 6 | 13 ± 6 | 16 ± 2 | 15 ± 1 | 13 ± 5 | 10 ± 7 | 12 ± 5 | 12 ± 7 | 15 ± 3 | 14 ± 3 | ||||||
| peak II | 29 ± 7 | 33 ± 5 | 31 ± 5 | 35 ± 9 | 32 ± 6 | 34 ± 7* | 33 ± 8 | 34 ± 15 | 30 ± 3 | 30 ± 3 | 31 ± 5 | 31 ± 7 | ||||||
| peak III | 49 ± 6 | 50 ± 11 | 60 ± 11 | 61 ± 10 | 53 ± 15 | 56 ± 16 | 47 ± 8 | 51 ± 9 | 50 ± 9 | 54 ± 9 | 48 ± 11 | 50 ± 10 | ||||||
| peak IV | 67 ± 15 | 67 ± 18 | 71 ± 15 | 71 ± 15 | 60 ± 11 | 60 ± 10 | 72 ± 12 | 75 ± 11 | 74 ± 13 | 73 ± 14 | 72 ± 14 | 73 ± 15 | ||||||
| peak V | 110 ± 18 | 110 ± 12 | 108 ± 9 | 109 ± 9 | 111 ± 8 | 115 ± 11 | 113 ± 14 | 113 ± 11 | 108 ± 12 | 109 ± 12 | 110 ± 11 | 113 ± 10 | ||||||
| peak VI | 170 ± 19 | 169 ± 24 | 174 ± 37 | 191 ± 44 | 172 ± 26 | 151 ± 69 | 178 ± 16 | 182 ± 19 | 176 ± 19 | 175 ± 25 | 170 ± 20 | 174 ± 22 | ||||||
| Ipsilateral DLPFC‐latencies | Contralateral DLPFC‐latencies | |||||||||||||||||
| 90%MT‐1 | 90%MT‐2 | 100%MT‐1 | 100%MT‐2 | 110%MT‐1 | 110%MT‐2 | 90%MT‐1 | 90%MT‐2 | 100%MT‐1 | 100%MT‐2 | 110%MT‐1 | 110%MT‐2 | |||||||
| peak I | — | — | — | — | — | — | 23 ± 6 | 23 ± 7 | 22 ± 6 | 20 ± 7 | 20 ± 8 | 22 ± 5 | ||||||
| peak II | 27 ± 16 | 26 ± 11 | 24 ± 16 | 29 ± 19 | 22 ± 6 | 22 ± 6 | 32 ± 7 | 34 ± 10 | 31 ± 9 | 31 ± 9 | 32 ± 11 | 33 ± 10 | ||||||
| peak III | 49 ± 10 | 48 ± 9 | 54 ± 15 | 54 ± 16 | 46 ± 11 | 47 ± 11 | 50 ± 9 | 52 ± 6 | 47 ± 10 | 46 ± 9 | 46 ± 11 | 46 ± 11 | ||||||
| peak IV | 60 ± 14 | 60 ± 13 | 71 ± 20 | 69 ± 19 | 62 ± 17 | 62 ± 18 | 63 ± 13 | 62 ± 12 | 66 ± 20 | 66 ± 18 | 63 ± 19 | 61 ± 20 | ||||||
| peak V | 113 ± 19 | 113 ± 17 | 111 ± 20 | 115 ± 16 | 112 ± 19 | 113 ± 16 | 112 ± 19 | 112 ± 18 | 112 ± 20 | 114 ± 16 | 113±20 | 116 ± 18 | ||||||
| peak VI | 174 ± 15 | 172 ± 18 | 174 ± 19 | 169 ± 16 | 171 ± 18 | 164 ± 13 | 175 ± 15 | 173 ± 18 | 180 ± 18 | 177 ± 19 | 175±16 | 168 ± 13 | ||||||
Number of subjects in which particular peak was detected is indicated in brackets.
Significant differnces (P < 0.0166) for the paired t‐tests between repetitions with Bonferroni correction.
Table II.
Amplitude (A) and latency (B) peak correlations
| A | Amplitude peak correlation | |||
| M1 | DLPFC | |||
| IPSI | CONTRA | IPSI | CONTRA | |
| Peak I | 0.918*** | 0.919*** | — | 0.806** |
| Peak II | 0.683** | 0.703** | 0.965*** | 0.918*** |
| Peak III | 0.916*** | 0.349 | 0.88*** | 0.982*** |
| Peak IV | 0.862*** | 0.478* | 0.922*** | 0.883*** |
| Peak V | 0.83*** | 0.677*** | 0.867*** | 0.887*** |
| Peak VI | 0.85*** | 0.816*** | 0.644** | 0.527* |
| B | Latency peak correlation | |||
| M1 | DLPFC | |||
| IPSI | CONTRA | IPSI | CONTRA | |
| Peak I | 0.929*** | 0.754** | — | 0.947*** |
| Peak II | 0.802*** | 0.946*** | 0.900*** | 0.939*** |
| Peak III | 0.940*** | 0.876*** | 0.967*** | 0.974*** |
| Peak IV | 0.975*** | 0.914*** | 0.986*** | 0.982*** |
| Peak V | 0.810*** | 0.903*** | 0.947*** | 0.924*** |
| Peak VI | 0.594** | 0.851*** | 0.841*** | 0.829*** |
P < 0.05,
P < 0.01,
P < 0.001 (2‐tailed).
RESULTS
Motor Threshold
MT in first and second experiments were highly correlated (43.3% ± 2.5% and 43.1% ± 2.3% of the stimulator's output; r = 0.99; P < 0.001).
Primary Motor Cortex nTMS
Six peaks from averaged responses were identified after left M1 nTMS at all intensities in electrodes over both hemispheres in each subject. The grand averaged EEG response consisted of six deflections as well (see Fig. 3). The response peak latencies were 13 ± 6 ms, 32 ± 6 ms, 54 ± 11 ms, 66 ± 14 ms, 111 ± 11 ms, and 172 ± 39 ms for the left ROI ipsilateral to the stimulation, and 12 ± 5 ms, 31 ± 7 ms, 50 ± 9 ms, 73 ± 12 ms, 111 ± 11, ms and 176 ± 19 ms for the right ROI. The response peak amplitudes increased with increased TMS intensity (Table I).
Figure 3.
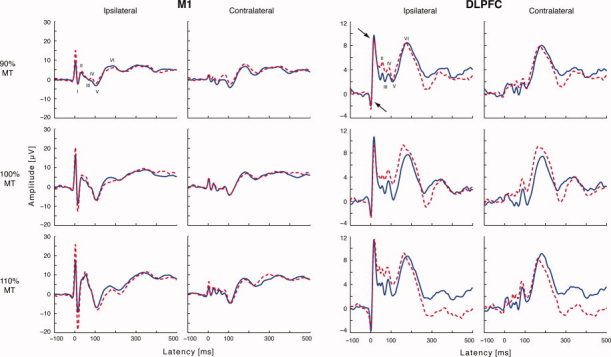
Grand average waveforms of the two measurements from ROI electrodes after primary motor (M1) and dorsolateral prefrontal cortex (DLPFC) stimulation. Dashed line illustrates the first and the solid line the second recording. The arrows indicate the residual TMS artefact. The signals were low‐pass filtered with a cut‐off frequency of 45 Hz. Note different amplitude scales for M1 and DLPFC responses. Variability of response peaks is larger than the baseline noise. [Color figure can be viewed in the online issue, which is available at www.interscience.wiley.com.]
The Pearson's correlation coefficients for amplitudes ranged from 0.68 to 0.92 for the left ROI, and from 0.35 to 0.92 for the right ROI. The correlation coefficients for latencies ranged from 0.59 to 0.98 for the left ROI and from 0.75 to 0.95 for the right ROIs (Table II).
Prefrontal Cortex nTMS
Prefrontal nTMS‐evoked EEG responses consisted of six peaks. The peak latencies were 25 ± 12 ms, 49 ± 11 ms, 64 ± 16 ms, 113 ± 17 ms, and 170 ± 16 ms for responses in the left ROI (the first peak was masked by TMS artefact) and 21 ± 6 ms, 32 ± 9 ms, 48 ± 9 ms, 63 ± 16 ms, 113 ± 17 ms, and 174 ± 16 ms for the responses in the right ROI (for grand averages, see Fig. 3; for mean amplitudes and latencies see Table I). The correlation coefficients for peak amplitudes ranged from 0.64 to 0.97 for the responses in the left ROI and from 0.53 to 0.98 for the right ROI. The correlation values for peak latencies ranged from 0.84 to 0.99 for the responses in the left ROI and contralateral between from 0.83 to 0.98 for the right ROI (Table II).
DISCUSSION
Our results display a high reproducibility of nTMS‐evoked EEG responses over M1 and DLPFC. This result was achieved by using exactly the same stimulation parameters for each subject in both measurements. Additionally, in line with previous studies [Conforto et al., 2004; Kimiskidis et al., 2004; Mills and Nithi, 1997], we observed no changes of MT.
Reproducibility of EEG Deflections
The test–retest correlation of all peak amplitudes ipsilateral to nTMS for both M1 and DLPFC stimulation generally exceeded 0.83, and was highly significant. The correlation for the peak amplitudes (Table II) in contralateral hemisphere was lower for the M1 stimulation. This might be caused by signal fluctuations originating from callosal transfer of the activity to the opposite hemisphere. Peak amplitude correlation for prefrontal nTMS in the ROI contralateral to the stimulation was generally stronger than for M1 (peak VI excluded); this suggests more robust interhemispheric connections in the prefrontal than primary motor regions in line with anatomic evidence [Boussaoud et al., 2005; Innocenti et al., 1995; Rouiller et al., 1994; Zarei et al., 2006]. Regardless, a smaller electrode number in ROIs of DLPFC than of M1 may decrease the variation in the average responses as well.
The amplitudes of peak II elicited by M1 nTMS and peak VI elicited by prefrontal nTMS were clearly less replicable than the other deflections. The sources of peak II (positivity at around 30 ms) are not clearly defined in dipole modelling of the TMS‐evoked responses [Paus et al., 2001] indicating a complex source structure; this may render it more vulnerable to changes e.g. in alertness. The generators of prefrontal peak VI (positivity at about 170 ms) have not been studied by source modeling.
Test–retest correlations of response peak latencies were generally high and similar (r > 0.8) for motor and prefrontal ROIs (Table II). The only exceptions were peak III for contralateral ROI and peak VI in ipsilateral ROI to primary motor cortex nTMS. Peak I (negativity at 15 ms) is considered to reflect excitatory events [Komssi et al., 2004] because of its sharp waveform and its high dependence on nTMS intensity; however, contribution of the remaining stimulus artefact may be considerable at this early stage of responses.
Paired two‐tailed t test differences for amplitude and latency between the two measurements were not significant. Only exceptions were the latency of ipsilateral peak II after M1 stimulation at 110% MT (P < 0.0166) and the amplitudes of ipsilateral and contralateral peak IV after DLPFC stimulation at 90% MT (P < 0.0166; shown with asterisks in Table I). The absence of significant differences for the vast majority of the peaks (135 out of 138) supports high test‐retest reproducibility of nTMS‐evoked EEG responses.
The origins of deflections N15 (peak I), P35 (peak II), N45 (peak III), P55 (peak IV) and P180 (peak VI) are not yet well understood [Bonato et al., 2006; Komssi et al., 2002, 2004; Paus et al., 2001]. A dipolar source in the M1 was found for N45 whereas no such dipoles were found for P30 (peak II) and N100 (peak V), suggesting different generator mechanisms of the latter deflections [Paus et al., 2001]. Later studies suggest that N45 depends on circuits intrinsic to M1 [Van Der Werf and Paus, 2006]. Ipsilateral peak II was more reproducible in responses to the prefrontal nTMS than for the primary motor nTMS, whereas ipsilateral peak III is reproduced better in nTMS to the primary motor cortex (Table II), also supporting different generator mechanisms of the two deflections. The replicability of peak V was good. N100, which is the dominant peak in TMS‐evoked EEG, is very sensitive to small changes in cortical excitability. It may represent cortical inhibition elicited by TMS [Bender et al., 2005; Kähkönen and Wilenius, 2007; Kičić et al., 2008; Nikulin et al., 2003]. The N100‐P180 complex may contain an auditory response to the TMS coil click; part of this response is due to bone‐conducted sound [Nikouline et al., 1999]. However, peak V is evoked primarily by TMS [Komssi et al., 2004; Nikulin et al., 2003; Paus et al., 2001]. High reproducibility of peak V (Table II) enhances its value as a marker of cortical processing for basic and clinical research studies.
Prefrontal TMS‐evoked responses in ipsilateral ROI contained five peaks, in line with previous results [Kähkönen et al., 2003, 2004, 2005]. However, in the contralateral ROI, an early additional (sixth) deflection was detected. The responses had the same latencies as those elicited by the primary motor cortex TMS [Kähkönen et al., 2005]. However, the response amplitudes were smaller for prefrontal than primary motor cortex nTMS, indicating different reactivity of the two regions [Kähkönen et al., 2003, 2004]. Our study presents the first evidence that nTMS produces reproducible EEG responses with 1‐week interval after stimulation of cortical sites where no behavioral or motor responses can be measured.
Reproducibility of MT
The “fixed‐point” stimulation is adequate for accurate determination of MT [Kimiskidis et al., 2004]. However, the accuracy can be enhanced by applying the “hot spot” method [Conforto et al., 2004]. Our results indicate that utilization of nTMS and “hot spot” approach of MT measurements provides accurate results. In addition, we found that when MT is measured with a 1‐week interval, the “hot spot” remains stable and provides a highly replicable MT.
CONCLUSION
Reproducible TMS‐evoked EEG responses are a valuable tool for investigating changes of cortical excitability in healthy subjects and in patients with cortical pathologies. In nTMS, stimuli can be delivered over the same site repeatedly. Thus, response changes elicited by e.g., rTMS over the dorsolateral prefrontal gyrus in healthy subjects or patients with depression, as well as changes elicited by M1 TMS in patients with movement and degenerative disorders, can be tracked precisely to get information about the pathophysiological mechanisms in test re–test designs. In addition, reproducibility of the EEG responses contralateral to the stimulated site may provide a supplementary tool in clinical paradigms requiring high‐intensity TMS, which may produce stimulus and muscle artifacts and contaminate EEG responses from the ipsilateral hemisphere.
Acknowledgements
The authors would like also to thank Dr. Vadim Nikulin for fruitful and helpful discussions, Dr. Jussi Numminen for his assistance in Talairach head coordinates and Ms. Anne‐Mari Vitikainen for valuable comments on the manuscript.
REFERENCES
- Amassian VE,Gracco RQ,Maccabee PJ,Gracco JB,Rudell A,Eberle L ( 1989): Suppression of visual perception by magnetic coil stimulation of human occipital cortex. Electroencephalogr Clin Neurophysiol 74: 458–462. [DOI] [PubMed] [Google Scholar]
- Bailey CJ,Karhu J,Ilmoniemi RJ ( 2001): Transcranial magnetic stimulation as a tool for cognitive studies. Scand J Psychol 42: 297–306. [DOI] [PubMed] [Google Scholar]
- Barker AT,Jalinous R,Freeston IL ( 1985): Non‐invasive magnetic stimulation of human motor cortex. Lancet 1: 1106–1107. [DOI] [PubMed] [Google Scholar]
- Beckers G,Homberg V ( 1991): Impairment of visual perception and short‐term memory scanning by transcranial magnetic stimulation of occipital cortex. Exp Brain Res 87: 421–432. [DOI] [PubMed] [Google Scholar]
- Bender S,Basseler K,Sebastian I,Resch F,Kammer T,Oelkers‐Ax R,Weisbrod M ( 2005): Electroencephalographic response to transcranial magnetic stimulation in children: Evidence for giant inhibitory potentials. Ann Neurol 58: 58–67. [DOI] [PubMed] [Google Scholar]
- Bonato C,Miniussi C,Rossini PM ( 2006): Transcranial magnetic stimulation and cortical evoked potentials: A TMS/EEG co‐registration study. Clin Neurophysiol 117: 699–1707. [DOI] [PubMed] [Google Scholar]
- Boussaoud D,Tanné‐Gariépy J,Wannier T,Rouiller EM ( 2005): Callosal connections of dorsal versus ventral premotor areas in macaque monkey: A multiple retrograde tracing study. BMC Neuroscience 67: 1–18. [DOI] [PMC free article] [PubMed] [Google Scholar]
- Carroll TJ,Riek S,Carson RG ( 2001): Reliability of the input‐output properties of the cortico‐spinal pathway obtained from transcranial magnetic and electrical stimulation. J Neurosci Methods 112: 193–202. [DOI] [PubMed] [Google Scholar]
- Conforto AB,Z'Graggen WJ,Kohl AS,Rösler KM,Kaelin‐Lang A ( 2004): Impact of coil position and electrophysiological monitoring on determination of motor thresholds to transcranial magnetic stimulation. Clin Neurophysiol 115: 812–819. [DOI] [PubMed] [Google Scholar]
- Corneal SF,Butler AJ,Wolf SL ( 2005): Intra‐ and intersubject reliability of abductor pollicis brevis muscle motor map characteristics with transcranial magnetic stimulation. Arch Phys Med Rehabil 86: 1670–1675. [DOI] [PMC free article] [PubMed] [Google Scholar]
- de Carvalho M,Miranda PC,Jardim L,Gabriel F,Falcao F ( 1999): Reproductivity of corticomotor threshold: some observations. Muscle Nerve 22: 538–539. [DOI] [PubMed] [Google Scholar]
- Evers S,Bockermann I,Nyhuis PW ( 2001): The impact of transcranial magnetic stimulation on cognitive processing: An event‐related potential study. Neuroreport 12: 2915–2918. [DOI] [PubMed] [Google Scholar]
- Fitzgerald PB,Oxley TJ,Laird AR,Kulkarni J,Egan GF,Daskalakis ZJ ( 2006): An analysis of functional neuroimaging studies of dorsolateral prefrontal cortical activity in depression. Psychiatry Res 148: 33–45. [DOI] [PubMed] [Google Scholar]
- Grafman J,Pascual‐Leone A,Always D,Nichelli P,Gomez‐Tortoza E,Hallett M ( 1994): Induction of a recall deficit by rapid‐rate magnetic stimulation. Neuroreport 5: 1157–1160. [DOI] [PubMed] [Google Scholar]
- Gross M,Nakamura L,Pascual‐Leone A,Fregni F ( 2007): Has repetitive transcranial magnetic stimulation (rTMS) treatment for depression improved? A systematic review and meta‐analysis comparing the recent vs. the earlier rTMS studies Acta Psychiatr Scand 116: 165–173. [DOI] [PubMed] [Google Scholar]
- Heller L,van Hulsteyn DB ( 1992): Brain stimulation using electromagnetic sources: Theoretical aspects. Biophys J 63: 129–138. [DOI] [PMC free article] [PubMed] [Google Scholar]
- Humm AM,Z'Graggen WJ,von Hornstein NE,Magistris MR,Rosler KM ( 2004): Assessment of central motor conduction to intrinsic hand muscles using the triple stimulation technique: Normal values and repeatability. Clin Neurophysiol 115: 2558–2566. [DOI] [PubMed] [Google Scholar]
- Ilmoniemi RJ,Virtanen J,Ruohonen J,Karhu J,Aronen HJ,Näätänen R,Katila T ( 1997): Neuronal responses to magnetic stimulation reveal cortical reactivity and connectivity. Neuroreport 8: 3537–3540. [DOI] [PubMed] [Google Scholar]
- Ilmoniemi RJ,Ruohonen J,Karhu J ( 1999): Transcranial magnetic stimulation‐a new tool for functional imaging of the brain. Crit Rev Biomed Eng 27: 241–284. [PubMed] [Google Scholar]
- Innocenti GM,Aggoun‐Zouaoui D,Lehmann P ( 1995): Cellular aspects of callosal connections and their development. Neuropsychologia 33: 961–987. [DOI] [PubMed] [Google Scholar]
- Kähkönen S,Wilenius J ( 2007): Effects of alcohol on TMS‐evoked N100 responses. J Neurosci Methods 166: 104–108. [DOI] [PubMed] [Google Scholar]
- Kähkönen S,Kesäniemi M,Nikouline VV,Karhu J,Ollikainen M,Holi M,Ilmoniemi RJ ( 2001): Ethanol modulates cortical activity: Direct evidence with combined TMS and EEG. Neuroimage 14: 322–328. [DOI] [PubMed] [Google Scholar]
- Kähkönen S,Wilenius J,Nikulin VV,Ollikainen M,Ilmoniemi RJ ( 2003): Alcohol reduces prefrontal cortical excitability in humans: A combined TMS and EEG study. Neuropsychopharmacology 28: 747–754. [DOI] [PubMed] [Google Scholar]
- Kähkönen S,Wilenius J,Komssi S,Ilmoniemi RJ ( 2004): Distinct differences in cortical reactivity of motor and prefrontal cortices to magnetic stimulation. Clin Neurophysiol 115: 583–588. [DOI] [PubMed] [Google Scholar]
- Kähkönen S,Komssi S,Wilenius J,Ilmoniemi RJ ( 2005): Prefrontal TMS produces smaller EEG responses than motor‐cortex TMS: Implications for rTMS treatment in depression. Psychopharmacology 181: 16–20. [DOI] [PubMed] [Google Scholar]
- Kičić D,Lioumis P,Ilmoniemi RJ,Nikulin VV ( 2008): Bilateral changes in excitability of sensorimotor cortices during unilateral movement: Combined electroencephalographic and transcranial magnetic stimulation study. Neuroscience 152: 1119–1129. [DOI] [PubMed] [Google Scholar]
- Kimiskidis VK,Papagiannopoulos S,Sotirakoglou K,Kazis DA,Dimopoulos G,Kazis A,Mills KR ( 2004): The repeatability of corticomotor threshold measurements. Neurophysiol Clin 34: 259–266. [DOI] [PubMed] [Google Scholar]
- Klein E,Kreinin I,Chistyakov A,Koren D,Mecz L,Marmur S,Ben‐Shachar D,Feinsod M ( 1999): Therapeutic efficacy of right prefrontal slow repetitive transcranial magnetic stimulation in major depression: A double‐blind controlled study. Arch Gen Psychiatry 56: 315–320. [DOI] [PubMed] [Google Scholar]
- Klimesch W,Sauseng P,Gerloff C ( 2003): Enhancing cognitive performance with repetitive transcranial magnetic stimulation at human individual α frequency. Eur J Neurosci 17: 1129–1133. [DOI] [PubMed] [Google Scholar]
- Kohler S,Paus T,Buckner RL,Milner B ( 2004): Effects of left inferior prefrontal stimulation on episodic memory formation: A two‐stage fMRI‐rTMS study. J Cogn Neurosci 16: 178–188. [DOI] [PubMed] [Google Scholar]
- Komssi S,Kähkönen S ( 2006): The novelty value of the combined use of electroencephalography and transcranial magnetic stimulation. Brain Res Rev 52: 183–192. [DOI] [PubMed] [Google Scholar]
- Komssi S,Aronen HJ,Huttunen J,Kesäniemi M,Soinne L,Nikouline VV,Ollikainen M,Roine RO,Karhu J,Savolainen S,Ilmoniemi RJ ( 2002): Ipsi‐ and contralateral EEG reactions to transcranial magnetic stimulation. Clin Neurophysiol 113: 175–184. [DOI] [PubMed] [Google Scholar]
- Komssi S,Kähkönen S,Ilmoniemi RJ ( 2004): The effect of stimulus intensity on brain responses evoked by transcranial magnetic stimulation. Hum Brain Mapp 21: 154–164. [DOI] [PMC free article] [PubMed] [Google Scholar]
- Luber B,Kinnunen LH,Rakitin BC,Ellasser R,Stern Y,Lisanby SH ( 2007): Facilitation of performance in a working memory task with rtms of the precuneus: Frequency‐ and time‐dependent effects. Brain Res 1128: 120–129. [DOI] [PubMed] [Google Scholar]
- Maeda F,Gangitano M,Thall M,Pascual‐Leone A ( 2002): Inter‐ and intra‐individual variability of paired‐pulse curves with transcranial magnetic stimulation (TMS). Clin Neurophysiol 113: 376–382. [DOI] [PubMed] [Google Scholar]
- Massimini M,Ferrarelli F,Huber R,Esser SK,Singh H,Tononi G ( 2005): Breakdown of cortical effective connectivity during sleep. Science 309: 2228–2232. [DOI] [PubMed] [Google Scholar]
- Meyer BU ( 2002): Introduction to diagnostic strategies of magnetic stimulation In: Pascual‐Leone A,Davey NJ, Rothwell JC, Wassermann EM, Puri BK, editors. Handbook of Transcranial Magnetic Stimulation. London: Arnold Publishers; pp 177–184. [Google Scholar]
- Mills KR,Nithi KA ( 1997): Corticomotor threshold to magnetic stimulation: Normal values and repeatability. Muscle Nerve 20: 570–576. [DOI] [PubMed] [Google Scholar]
- Neggers SF,Langerak TR,Schutter DJ,Mandl RC,Ramsey NF,Lemmens PJ,Postma A ( 2004): A stereotactic method for image‐guided transcranial magnetic stimulation validated with fMRI and motor‐evoked potentials. Neuroimage 21: 1805–1817. [DOI] [PubMed] [Google Scholar]
- Nikouline V,Ruohonen J,Ilmoniemi RJ ( 1999): The role of the coil click in TMS assessed with simultaneous EEG. Clin Neurophysiol 110: 1325–1328. [DOI] [PubMed] [Google Scholar]
- Nikulin VV,Kičić D,Kähkönen S,Ilmoniemi RJ ( 2003): Modulation of electroencephalographic responses to transcranial magnetic stimulation: Evidence for changes in cortical excitability related to movement. Eur J Neurosci 18: 1206–1212. [DOI] [PubMed] [Google Scholar]
- Pascual‐Leone A,Gates JR,Dhuna A ( 1991): Induction of speech arrest and counting errors with rapid‐rate transcranial magnetic stimulation. Neurology 41: 697–702. [DOI] [PubMed] [Google Scholar]
- Pascual‐Leone A,Rubio B,Pallardo F,Catala MD ( 1996): Rapid‐rate transcranial magnetic stimulation of left dorsolateral prefrontal cortex in drug‐resistant depression. Lancet 348: 233–237. [DOI] [PubMed] [Google Scholar]
- Pascual‐Leone A,Walsh V,Rothwell J ( 2000): Transcranial magnetic stimulation in cognitive neuroscience‐virtual lesion, chronometry, and functional connectivity. Curr Opin Neurobiol 10: 232–237. [DOI] [PubMed] [Google Scholar]
- Paus T ( 1999): Imaging the brain before, during, and after transcranial magnetic stimulation. Neuropsychologia 37: 219–224. [DOI] [PubMed] [Google Scholar]
- Paus T,Jech R,Thompson CJ,Comeau R,Peters T,Evans AC ( 1997): Transcranial magnetic stimulation during positron emission tomography: A new method for studying connectivity of the human cerebral cortex. J Neurosci 17: 3178–3184. [DOI] [PMC free article] [PubMed] [Google Scholar]
- Paus T,Jech R,Thompson CJ,Comeau R,Peters T,Evans AC ( 1998): Dose‐dependent reduction of cerebral blood flow during rapid‐rate transcranial magnetic stimulation of the sensorimotor cortex. J Neurophysiol 79: 1102–1107. [DOI] [PubMed] [Google Scholar]
- Paus T,Sipilä PK,Strafella AP ( 2001): Synchronization of neuronal activity in the human primary motor cortex by transcranial magnetic stimulation: An EEG study. J Neurophysiol 86: 1983–1990. [DOI] [PubMed] [Google Scholar]
- Rossini PM,Barker AT,Berardelli A,Caramia MD,Caruso G,Cracco RQ,Dimitrijević MR,Hallett M,Katayama Y,Lücking CH,Maertens de Noordhout AL,Marsden CD,Murray NMF,Rothwell JC,Swash M,Tomberg C ( 1994): Non‐invasive electrical and magnetic stimulation of the brain, spinal cord and roots: Basic principles and procedures for routine clinical application. Report of an IFCN committee. Electroencephalogr Clin Neurophysiol 91: 79–92. [DOI] [PubMed] [Google Scholar]
- Rossini PM,Berardelli A,Deuschl G,Hallett M,Maertens de Noordhout AM,Paulus W,Pauri F ( 1999): Applications of magnetic cortical stimulation. The International Federation of Clinical Neurophysiology. Suppl Electroencephalogr Clin Neurophysiol 52: 171–185. [PubMed] [Google Scholar]
- Roth Y,Zangen A,Hallett M ( 2002): A coil design for transcranial magnetic stimulation of deep brain regions. J Clin Neurophysiol 19: 361–370. [DOI] [PubMed] [Google Scholar]
- Rouiller EM,Babalian A,Kazennikov O,Moret V,Yu XH,Wiesendanger M ( 1994): Transcallosal connections of the distal forelimb representations of the primary and supplementary motor cortical areas in macaque monkeys. Exp Brain Res 102: 227–243. [DOI] [PubMed] [Google Scholar]
- Ruohonen J,Ilmoniemi RJ ( 1998): Focusing and targeting of magnetic brain stimulation using multiple coils. Med Biol Eng Comput 36: 297–301. [DOI] [PubMed] [Google Scholar]
- Schonfeldt‐Lecuona C,Thielscher A,Freudenmann RW,Kron M,Spitzer M,Herwig U ( 2005): Accuracy of stereotaxic positioning of transcranial magnetic stimulation. Brain Topogr 17: 253–259. [DOI] [PubMed] [Google Scholar]
- Schürmann M,Nikouline VV,Soljanlahti S,Ollikainen M,Ba̧sar E,Ilmoniemi RJ ( 2001): EEG responses to combined somatosensory and transcranial magnetic stimulation. Clin Neurophysiol 112: 19–24. [DOI] [PubMed] [Google Scholar]
- Terao Y,Ugawa Y,Hanajima R,Machii K,Furubayashi T,Mochizuki H,Enomoto H,shiio Y,Uesugi H,Iwata NK,Kanazawa I ( 2000): Predominant activation of I1‐waves from the leg motor area by transcranial magnetic stimulation. Brain Res 859: 137–146. [DOI] [PubMed] [Google Scholar]
- Tiitinen H,Virtanen J,Ilmoniemi RJ,Kamppuri J,Ollikainen M,Ruohonen J,Näätänen R ( 1999): Separation of contamination caused by coil clicks from responses elicited by transcranial magnetic stimulation. Clin Neurophysiol 110: 982–985. [DOI] [PubMed] [Google Scholar]
- Topper R,Mottaghy FM,Brugmann M,Noth J,Huber W ( 1998): Facilitation of picture naming by focal transcranial magnetic stimulation of Wernicke's area. Exp Brain Res 121: 371–378. [DOI] [PubMed] [Google Scholar]
- Van Der Werf YD,Paus T ( 2006): The neural response to transcranial magnetic stimulation of the human motor cortex. I. Intracortical and cortico‐cortical contributions Exp Brain Res 175: 231–245. [DOI] [PubMed] [Google Scholar]
- Virtanen J,Parkkonen L,Ilmoniemi RJ,Pekkonen E,Näätänen R ( 1997): Biopotential amplifier for simultaneous operation with biomagnetic instruments. Med Biol Eng Comput 35: 402–408. [DOI] [PubMed] [Google Scholar]
- Virtanen J,Ruohonen J,Näätänen R,Ilmoniemi RJ ( 1999): Instrumentation for the measurement of electric brain responses to transcranial magnetic stimulation. Med Biol Eng Comput 37: 322–326. [DOI] [PubMed] [Google Scholar]
- Wolf SL,Butler AJ,Campana GI,Parris TA,Struys DM,Weinstein SR,Weiss P ( 2004): Intra‐subject reliability of parameters contributing to maps generated by transcranial magnetic stimulation in able‐bodied adults. Clin Neurophysiol 115: 1740–1747. [DOI] [PubMed] [Google Scholar]
- Yousry TA,Schmid UD,Alkadhi H,Schmidt D,Peraud A,Buettner A,Winkler P ( 1997): Localization of the motor hand area to a knob on the precentral gyrus. A new landmark. Brain 120: 141–157. [DOI] [PubMed] [Google Scholar]
- Zangen A,Roth Y,Voller B,Hallett M ( 2005): Transcranial magnetic stimulation of deep brain regions: Evidence for efficacy of the H‐coil. Clin Neurophysiol 116: 775–779. [DOI] [PubMed] [Google Scholar]
- Zarei M,Johansen‐Berg H,Smith S,Ciccarelli O,Thompson AJ,Matthews PM ( 2006): Functional anatomy of interhemispheric cortical connections in the human brain. J Anat 209: 311–320. [DOI] [PMC free article] [PubMed] [Google Scholar]
- Ziemann U ( 2002): Paired pulse techniques In: Pascual‐Leone A,Davey NJ, Rothwell JC, Wassermann EM, Puri BK, editors. Handbook of Transcranial Magnetic Stimulation. London: Arnold Publishers; pp 141–162. [Google Scholar]