Abstract
The main purpose of this study was to investigate the sensory cortical activation of the anterior neck region and the relationship between the neck and face representation areas. Functional MRI by blood oxygenation level dependent measurements was performed while tactile stimulation was applied to the face or neck area. Nonpainful tactile stimuli were manually delivered by an experimenter at a frequency of ∼1 Hz. Block (epoch) design was adopted with a block duration of 30 s and a whole run duration of 6 min. For each location, two runs were performed. After the image data were preprocessed, both parameteric and nonparametric methods were performed to test the group results. The results showed that (1) unilateral face or neck stimulation could elicit bilateral cortical activation, (2) mainly the face representation and face‐hand junction areas, but not the conventional neck representation area, were activated by face or neck stimulation, and (3) the activation areas were larger when right face or neck was stimulated. In conclusion, the sensory cortical representation area of the anterior neck region was mainly at the junction of hand and face representation area and the activated area was larger when the right face or neck was stimulated. Hum Brain Mapp, 2010. © 2010 Wiley‐Liss, Inc.
Keywords: neck, face, somatic sensation, functional MRI
INTRODUCTION
Many studies, using different techniques [Nakamura et al., 1998; Penfield and Rasmussen, 1957], support an orderly arranged topographical representation of both somatic motor and sensory functions on the cerebral cortex. Though the localization for the more heavily represented areas, such as face and hands [Hoshiyama et al., 1995; Yang et al., 1993], were convincingly established, the localization of less represented areas was less frequently documented due to technical difficulties and restricted interests [Itomi et al., 2001].
The cortical representation areas for both motor and sensory functions of the neck region have been less convincingly localized, partly because the representation area was relatively small. Two most frequently mentioned representation areas are the junction of the trunk and upper extremity high in the lateral convex (TU) and the junction of finger and face representation areas near the Sylvian fissure (FF) (Fig. 1a). For the motor part, earlier studies [Penfield and Rasmussen, 1957] indicated that the corticomotor projection to the muscles responsible for the head flexion‐extension was located at the junction of the thumb and scalp, i.e. the FF area, and was primarily bilateral. However, a recent study [Thompson et al., 1997], using transcranial magnetic stimulation in 15 normal subjects, indicated that the projection originated from the bilateral TU areas. In the same study, the results indicated that the origin of motor projection to the platysma muscle was closer to the FF area. For the somatic sensory representation, most of the studies followed the long‐held view and believed that it was located in the TU area [Penfield and Rasmussen, 1957]. The representation area of upper part of the posterior scalp was reported to be very close to that of the forehead, i.e. the FF area [Hoshiyama et al., 1995]. Again, a recent study [Itomi et al., 2001], using somatosensory evoked magnetic field in 16 normal subjects, showed that there was interindividual difference in the representation area of lower posterior scalp region. It was closer to the TU area in one group (n = 5) and to the FF area in the other group (n = 11). There is even less data on the interhemispheric difference of neck representation.
Figure 1.
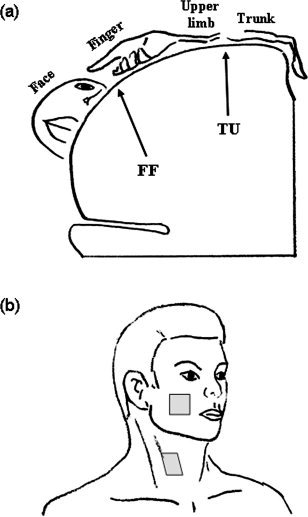
(a) A schematic drawing of stimulation sites on face and neck and (b) a simplified drawing of the somatosensory representation areas in coronal plan. The targets of this study, FF and TU areas, are indicated.
The main purposes of this study were to investigate (1) the sensory cortical representation area of the anterior neck region that was approximately spanned between the two heads of the sternocleidomastoid muscle and (2) the relationship between the neck and face representation areas. Our interest in this region originated from the clinical demands for quantitative evaluation of sensory recovery and changes of cortical representation area after major oro‐pharyngo‐laryngeal operations and flap reconstruction.
MATERIALS AND METHODS
Experimental Setup
Thirteen subjects, including eight young males and five young females aged 26.9 ± 5.2 years old, were recruited in this study. Simple questions such as the hand used for writing and holding chopsticks were utilized to determine the handedness. All the subjects were right handed. Before the experiment, the whole experimental procedure and the potential hazards were explained clearly to the subject and a written document was signed. All MR acquisitions were performed in the Department of Radiology on a MR scanner (Signa MR/i, 1.5T, General Electronics, Milwaukee, WI) regularly maintained for routine clinical examinations. The study protocol was approved by the human experiment and ethics committee of National Cheng Kung University Hospital.
Before the acquisition of the functional data, high‐resolution 3D anatomical T1‐weighted images of the whole brain were obtained by using a fast spoiled gradient echo sequence: inversion time = 400 ms, TR = 8.9 ms, TE = 1.9 ms, flip angle (FA) = 15°, slice thickness = 2 mm, imaging matrix = 256 × 256 × 128 and field of view (FOV) = 26 cm. Functional images were then acquired with a gradient echo echoplanar pulse sequence (TE = 50 ms, TR = 3000 ms, FA = 90°, slice thickness = 5 mm and FOV = 30 cm, with a volume matrix of 64 × 64 × 30). First four dummy scans in each run were discarded to avoid magnetic field unsteadiness. Block (epoch) design was adopted with a block duration of 30 seconds and a whole run duration of 6 min. In one run, blood oxygenation level dependent (BOLD) measurements occurred in frames of 120 consecutive T2* weighted fMRI multislice scans, during which subjects were subjected to alternating blocks of tactile stimulation and null (no stimulation). In other words, there were six stimulation and six null blocks in a run and 10 volumes in a block.
Experimental Procedures
During the experiment, the subject was asked to remain relaxed and motionless but as lucid as possible. A forehead‐holder and foam padding were used to avoid head motion during data acquisition. Nonpainful tactile stimuli were manually delivered by an experimenter standing in the scanner room at the subject's side at a frequency of ∼1 Hz. In order to roughly maintain the identical pressure, a Semmes‐Weinstein monofilament (300 g, Touch‐Test sensory Evaluator, North Coast Medical, Inc.) was used as the stimulation tool. The stimuli were applied randomly over an area of approximately 3 × 3 cm2. The targets were the area below the zygomatic bone for the face and the area medial to the sternocleidomastoid muscle at the level of thyroid cartilage for the neck (Fig. 1b). The tactile stimulation was applied in the order of right face and neck (RF and RN), left face and neck (LF and LN), LF, LN, RF, and RN, one location for one run. Thus, a total of eight runs (i.e., two runs for each region) were performed and 960 volumes in total were collected from one subject. There was sufficient time (5–10 min) for rest between consecutive runs in order to prevent interaction among runs. Seven subjects (four males and three females) started the stimulation sequence from the right side and the others from the left side, i.e., LF, LN, RF, RN, RF, RN, LF, and LN.
Functional Image Processing
Functional images were pre‐processed by using SPM2 (Wellcome Department of Imaging Neuroscience, London, UK; http://www.fil.ion.ucl.ac.uk/spm) and Matlab (MathWorks, Natick, MA) software on a personal computer. The image volumes were realigned to the first volume for correcting head movements, coregistered to the subject's T1‐weighted 3D anatomical images and normalized to the standard EPI template of SPM2. The normalized images were spatially smoothed with an isotropic Gaussian kernel of 15 mm full width at half‐maximum (FWHM). In order to test the statistical significance of inter‐subject difference, we followed the computationally efficient summary statistic approach outlined by Friston et al. [2002]. In brief, the approach consisted of three steps, (1) fitting a general linear model (GLMs) for each subject, (2) defining the effect of interest for each subject with a contrast to produce a contrast image, and (3) feeding the contrast images into a GLM that implements a one‐sample test [Frackowiak et al., 2004]. In short, individual analyses (steps 1 and 2) were performed first, and group analyses (step 3) were achieved by the summary results of individual analyses. In the first step, preprocessed images were analyzed by using a general linear model, where experimental blocks were modeled as box‐car functions, convolved with a canonical hemodynamic response function with its temporal derivative. A high‐pass filter (cut‐off period of 128 s) was used to remove low‐frequency drifts and fluctuations, and proportional scaling was applied to remove the global changes in the signal. In the second step, main effects for the active condition were specified as the contrast for one‐sided t‐test. These voxel‐wise t‐values constituted a statistical parametric map. We restricted our attention to only the primary somatosensory areas in the inter‐subject analyses. The mask for the region of interest, the somatosensory area, was generated by the free software MARINA (Bender Institute of Neuroimaging, Justus‐Liebig Universitat Giessen, Germany), by choosing the bilateral postcentral gyri of the central region. Three methods were utilized for the third step (Table I). The rationale behind adopting three approaches was to compare the results from different approaches and to test the robustness of our inferences. The t‐contrast images generated in the first‐level intrasubject analyses were multiplied with the mask, respectively. The data of subjects without activation in the somatosensory areas were discarded. For each stimulation location, data of nine subjects (male/female: 5/4) were visually selected for the second‐level (intersubject) statistical analyses. One way ANOVA (P = 0.05) with correction of FWE of the four groups was tested first. In the first method, one sample t‐test (P = 0.05) with correction of FWE for each group was performed. The threshold of activated cluster size was set at 10 voxels, except 1 voxel for LF stimulation.
Table 1.
Methods used in this study for defining activated areas
| I | II | III | |
|---|---|---|---|
| Level 1 | SPM (GLM) | SPM (GLM) | SPM (GLM) |
| Level 2 | Parametric (t test) | Nonparametric (permutation) | Parametric (z test) |
GLM, general linear model.
In the second method, because the number of subjects was small, nonparametric permutation tests using SnPM3 toolbox (Wellcome Department of Imaging Neuroscience, London, UK) were also calculated and compared with the above parametric results. The same set of data used in the first method was analyzed. We adopted one sample t‐test on multi‐subjects as the study model for the following nonparametric permutation calculation and the variance smoothing was set at isotropic 15 mm FWHM. All 512 permutations were used without approximate test. No global normalization or threshold masking was applied. On results of positive effects, pseudo t‐statistic (P = 0.02) with correction of FWE was performed. Smaller P value was adopted because non‐parametric analyses tended to show larger activated areas. The threshold of activated cluster size was set at 10 voxels, except 1 voxel for LF stimulation.
In the third method, the t‐contrast images generated in the first‐level intrasubject analyses were tested using an empirical method developed by ourselves for the second‐level intersubject analyses [Huang, 2007]. Conceptually, the method is a combination of spatial extent and false discovery rate procedure. In brief, a threshold (half of the maximal t value in this study) was chosen to define activated voxels for each subject. The number of subjects with the corresponding voxel activated was counted for the voxel (N). The number of voxels (M) in the 26 vexels that formed a 3 × 3 cube surrounding the target vovel and had a N greater than zero was counted. The value for the target voxel was calculated as
 . All voxels were taken as the population and z score for each voxel was computed. Voxels whose absolute z‐scores were greater than 2.5 were considered active. The threshold of activated cluster size was set at 10 voxels, except 1 voxel for LF stimulation.
RESULTS
Results of the First‐Level Analyses
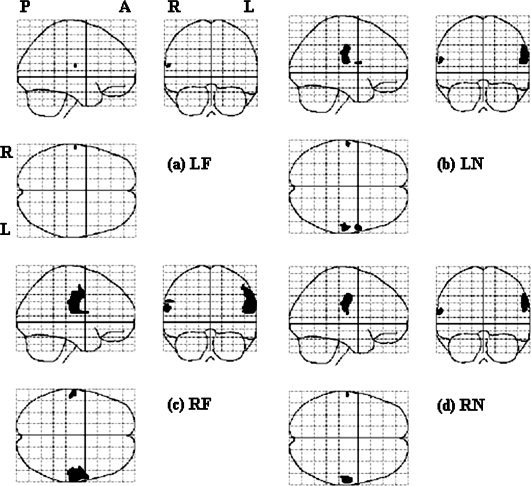
Figure 2 illustrates the general trend in the first‐level analyses. The statistical results are shown in maximum intensity projection (MIP) format and the space coordinate conforms to the Talairach system [Talairach and Tournoux, 1988]. Stimulating neck or face provoked activation in both the traditional face and FF areas, but less often in the TU area. Both face and FF areas were activated in five subjects with LF stimulation, in three subjects with LN stimulation, six subjects with RF stimulation, and seven subjects with RN stimulation. Mostly, the activation was bilateral, though the size of activated area was larger on the contralateral side The activation was bilateral in seven subjects when LF area was stimulated, in six subjects for LN area, nine subjects for RF area and nine subjects for RN area. From visual inspection, the activation area was usually larger when right face or neck was stimulated and the activation was relatively less asymmetric when the left face or neck area was stimulated. In addition to the primary somatosensory areas in the postcentral gyrus, many other areas were inconsistently activated, such as pre‐central motor area, cingulate gyrus, cerebellum, and thalamus.
Figure 2.
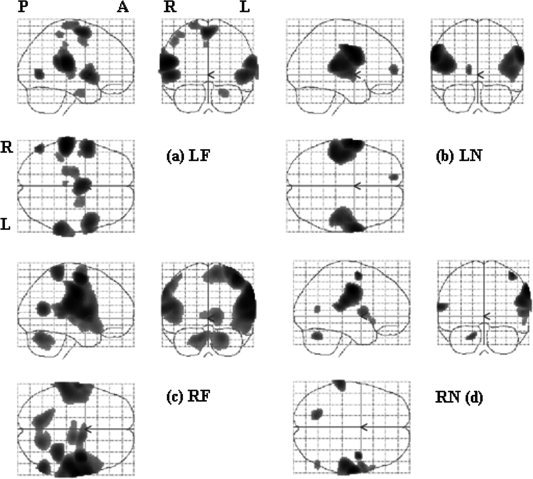
Examples of first‐level analyses of a subject, shown in maximum intensity projection (MIP) format. The statistical map was the results of t contrast for each stimulation location, with a threshold of P < 0.05 and FWE corrected. P: posterior, A: anterior, R: right hemisphere, L: left hemisphere. Stimulation site, LF: left face, LN: left neck, RF: right face, RN: right neck.
Results of the Second‐Level Analyses
For the second‐level analysis, we looked at the difference among four conditions first (see Fig. 3), and then in each stimulation site separately (Fig. 4, 5, 6, 4, 5, 6). One‐way ANOVA test of all four stimulation locations (LF, LN, RF, and RN) showed that the regions of significant difference were in bilateral face and FF areas and were larger on the left hemisphere (see Fig. 3). The results of stimulating each location analyzed by all three methods are summarized in Table II. The results of one sample t‐test of each stimulation location were shown in Figure 4. No cortical area was activated by LF stimulation (Fig. 4a). In LN stimulation (Fig. 4b), there were two activated clusters. The larger one centered at [52 −6 42] and the smaller one was at [60 4 16], corresponding to the right FF and face areas in the left hemisphere, respectively. RF stimulation activated one cluster centered at [56 −6 40], corresponding to the right face‐FF area (Fig. 4c). RN stimulation activated one cluster centered at [58 −10 44], corresponding to the right FF area (Fig. 4d). It is noted that the activated areas were all distributed on the FF and face areas of the left hemisphere and none showed activation in the traditional neck area (TU).
Figure 3.
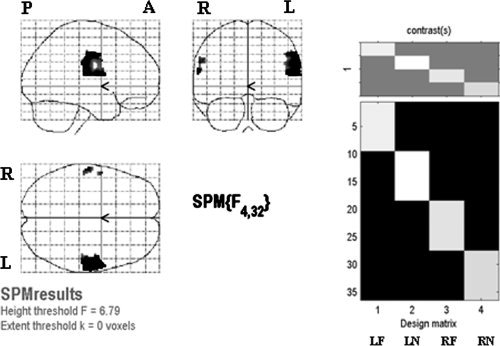
Left: results of one‐way ANOVA for effects‐of‐interest F contrast of four stimulation locations, with thresholded P < 0.05 and FWE corrected. Right: design matrix. Each column in the design matrix represents one stimulation location and contains data of nine subjects. One‐way ANOVA was performed to test the difference among the four columns.
Figure 4.
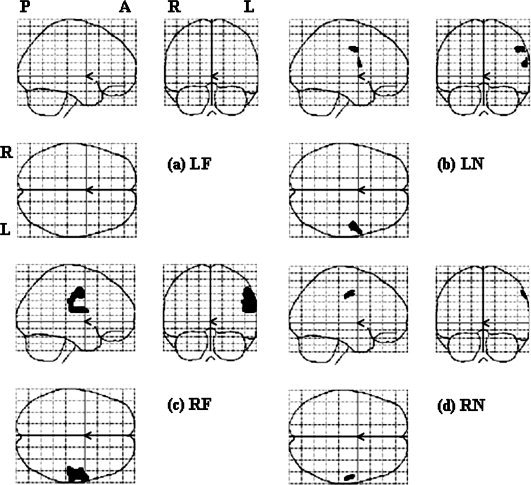
Results of the second‐level parametric analyses (t test) in each stimulation location, with a threshold of P < 0.05 and FWE corrected.
Figure 5.
Results of the second‐level nonparametric analyses (permutation test) in each stimulation location, with a threshold of P < 0.02 and FWE corrected.
Figure 6.
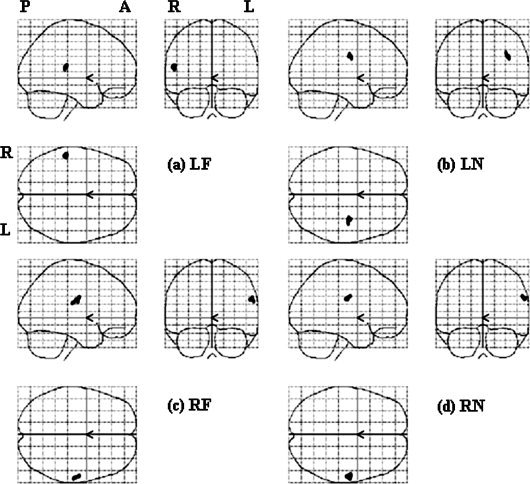
Results of the second‐level parametric analyses (z test) in each stimulation location, with a threshold of z > 2.5.
Table II.
Cluster size of activated areas in four stimulation conditions
| Stimulation site | Activated area | I | II | III |
|---|---|---|---|---|
| LF | (5.17)a | (4.60) | (2.50) | |
| L_Face | 5 [−62 −16 16] | 23 [−53 −38 17] | ||
| L_FF | ||||
| R_Face | ||||
| R_FF | ||||
| LN | (4.53) | (4.16) | (2.50) | |
| L_Face | 16 [−62 −16 16] | |||
| L_FF | ||||
| R_Face | 32b [60 4 16]c | 14 [60 4 14] | ||
| R_FF | 64 [52 −6 42] | 147 [60 −22 22] | ||
| RF | (5.01) | (4.61) | (2.50) | |
| L_Face | 29 [−60 −16 20] | |||
| L_FF | 16 [−60 −20 30] | |||
| R_Face | 605 [56 −6 40] | 725 [60 −18 24] | ||
| R_FF | 31 [55 −29 25] | |||
| RN | (5.67) | (4.52) | (2.50) | |
| L_Face | 14 [−62 −16 16] | |||
| L_FF | ||||
| R_Face | ||||
| R_FF | 30 [58 −10 44] | 183 [60 −16 36] | 20 [57 −31 27] |
Numbers in the parentheses are height thresholds for statistical significance. For methods I–III, it is t threshold, pseudo‐t threshold and converted t threshold, respectively.
The dimension of a voxel is 2 × 2 × 2 mm3.
Numbers in the square bracket are the space coordinates of the cluster centers.
The results of nonparametric analyses are presented in Figure 5. LF stimulation activated one area centered at [−62−16 16], corresponding to the left face representation area in the right hemisphere (Fig. 5a). LN stimulation activated three areas, i.e., [−62 −16 16], [60 4 14], and [60 −22 22], respectively (Fig. 5b), corresponding to left face and right face and FF areas, respectively (Fig. 5c). RF stimulation activated three areas, [−60 −16 20], [−60 −20 30], and [60 −18 24], corresponding to left face and FF and right face‐FF areas, respectively (Fig. 5c). RN stimulation activated two clusters centered at [‐62 −16 16] and [60 −16 36], corresponding to left face and right FF areas, respectively (Fig. 5d).
In general, though a smaller P value was used (P = 0.02 for nonparametric analyses vs. P = 0.05 for parametric analyses), the activated areas were larger in non‐parametric analyses (Table II). Another main difference between the results of parametric and nonparametric analyses was that non‐parametric analyses indicated bilateral activation, while parametric analyses showed unilateral activation regardless of the side of stimulation. There was good correspondence between the activated areas in the left hemisphere by parametric and nonparametric analyses.
Figure 6 shows the results of z test. LF stimulation activated one area centered at [‐53 −38 17], corresponding to the left FF area in the right hemisphere (Fig. 6a). LN stimulation activated a subcortical area but no cortical area (Fig. 6b). RF stimulation activated one area centered at [55 −29 25], corresponding to the right FF area (Fig. 6c). RN stimulation activated one cluster centered at [57 −31 27], corresponding to the right FF area (Fig. 6d). In general, there was good correspondence between the results of stimulating right face and neck by parametric analyses and z test of t‐contrast images. However, the results of stimulating left face and neck were different.
DISCUSSION
The main results of this study were that (1) unilateral face or neck stimulation could elicit bilateral cortical activation, (2) mainly the face representation and FF areas, but not the TU area, were activated by face or neck stimulation, and (3) the activation areas were larger when right face or neck was stimulated.
There have been only a few studies investigating the cortical representation area of neck sensation and these studies all focused on the posterior neck area. The results indicated that there might be interindividual difference, such that TU area was activated in some subjects while FF area was activated in others [Itomi et al., 2001]. As far as the authors know, there was no relevant data on the anterior neck region. The group results of this study indicated that mainly the FF and face areas were activated. The results were not compatible with the conventional notion of the neck (TU) area in the sensory homunculus [Penfield and Rasmussen, 1957]. Yet, the neck area of the motor homunculus is at the junction of face and thumb [Penfield and Rasmussen, 1957] and there is evidence [Servos et al., 1999] that, as in the case of monkey [Kass et al., 1979], the sensory representation map of face is upside down. In this view, the neck area can be the superior extension of lower face area. One possible explanation for the simultaneous activation of face area during neck stimulation might be the activation of the underlying deep neck structures, whose cortical representation areas are inferior to the face area. The other explanation was that the tactile pressure that we adopted in this study was relatively large (300 g) and might provoke a large response that spilled over to the adjacent areas. Our group results did not exclude the possibility that the TU area could be activated in some subjects, as revealed by the first‐level individual analyses. It is also possible that the TU area was small and did not aligned to the same location during the normalization process to the standard brain.
Both the direct stimulation [Penfield and Rasmussen, 1957] and lesion [Taylor and Jones, 1997] studies have indicated that the cortical representation of facial sensation was bilateral. Results about lateralization of cortical activation are varied and may depend on types and locations of stimulation. For hand movements, bilateral activation is more pronounced during unilateral movements of the nondominant hand than the dominant hand, especially in right‐handed subjects [Kim et al., 1993; Singh et al., 1998; Volkmann et al., 1998]. Symmetric chin movements (rhythmic contraction of masticatory muscles) were lateralized to the dominant hemisphere [Foki et al., 2007]. One study [Li et al., 1996], investigating activation of the ipsilateral cerebral hemisphere during tactile sensory and motor tasks involving the right and left hands, showed no lateralization for the right‐hand and left‐hand sensory tasks. Projection of gustatory sensation was lateralized to the dominant hemisphere [Cerf et al., 1998]. Less is known about the ipsilateral activation and lateralization of the cortical representation of neck sensation. Our results showed that there might also be lateralization in somatic sensation. All our subjects were right‐handed, and the activation was more prominent on the left hemisphere for both right and left stimulation and the asymmetry was greater when right (dominant) face and neck was stimulated.
The activated area was smallest for LF stimulation. We found this phenomenon before we started the second‐level analyses. It was not due to the order of stimulation or gender. In fact, we did experiments with stimulation only on left face and neck in two subjects for validation and the results (not included) still showed very small or no activation. It is not known whether it was related to the handedness, because, in this study, we only recruited right‐handed subjects. In contrast to motor lateralization (handedness), there have been only a few studies investigating the cerebral lateralization of somatosensory perceptions. The available results indicated that, in right‐handed subjects, cerebral lateralization was generally more prominent [Meador et al., 1998], sensory threshold hold was lower when stimulating the left extremities [Friedli et al., 1987; Meador et al., 1998] and stimulation of either side produced a larger activation area in the right hemisphere [Coghill et al., 2001]. The results were in contradictory to our results. However, these studies were focused on the sensation of extremities. As far as the authors know, there was no data about the cerebral lateralization of facial and cervical sensation. Currently, we have no explanation for the discrepancy.
In general, nonparametric analyses was more sensitive than the corresponding parametric analyses, which were thought to be due to the conservativeness of random field method under low degrees of freedom [Nichols and Holmes, 2002]. z‐Test produced smaller activation areas than the other two analyses. As a whole, the activation of the left hemisphere was similar in all three types of analyses, while the activation of the right hemisphere was less consistent. There is no golden standard to validate which analysis is more accurate and that was the reason we adopted three methods. Yet, we tended to believe that the results of nonparametric analysis were closer to the true situation for the following two reasons: (1) since the number of image sets was only nine for each condition, it was uncertain whether the group distribution conformed to the requirement of normal distribution, and (2) as shown by the first‐level analyses, more than half of the subjects showed bilateral activation.
We started this study as the foundation for investigating the redistribution of sensory cortical representation areas for face and neck regions after major oropharyngolaryngeal operations and flap reconstructions. From the results of this study that the activated cortical areas mostly overlapped with each other for face and neck stimulation, it will be difficult to use the present study protocol to differentiate the original and remapped cortical areas of face and neck in group study. Different study protocols need to be investigated.
CONCLUSION
The cortical representation area of the cutaneous sensation in the anterior neck is more at the junction of hand and face, instead of the junction between upper extremity and trunk.
REFERENCES
- Cerf B, Lebihan D, Van de Moortele PF, Mac Leod P, Faurion A ( 1998): Functional lateralization of human gustatory cortex related to handedness disclosed by fMRI study. Ann NY Acad Sci 855: 575–578. [DOI] [PubMed] [Google Scholar]
- Coghill RC, Gilron I, Iadarola MJ ( 2001): Hemispheric lateralization of somatosensory processing. J Neurophysiol 85: 2602–2612. [DOI] [PubMed] [Google Scholar]
- Foki T, Geissler A, Gartus A, Pahs G, Deecke L, Beisteiner R ( 2007): Cortical lateralization of bilateral symmetric chin movements and clinical relevance in tumor patients—A high field BOLD‐FMRI study. Neuroimage 37: 26–39. [DOI] [PubMed] [Google Scholar]
- Frackowiak RSJ, Friston KJ, Frith CD, Dolan RJ, Price CJ, Zeki S, Ashburner J, Penny W ( 2004): Human Brain Function. Amsterdam: Elsevier. [Google Scholar]
- Friedli WG, Fuhr P, Wiget W ( 1987): Detection threshold for percutaneous electrical stimuli: Asymmetry with respect to handedness. J Neurol Neurosurg Psychiatry 50: 870–876. [DOI] [PMC free article] [PubMed] [Google Scholar]
- Friston KJ, Glaser DE, Henson RN, Kiebel S, Phillips C, Ashburner J ( 2002): Classical and Bayesian inference in neuroimaging: Applications. Neuroimage 16: 484–512. [DOI] [PubMed] [Google Scholar]
- Hoshiyama M, Kakigi R, Koyama S, Kitamura Y, Shimoio M, Watanabe S ( 1995): Somatosensory evoked magnetic fields after mechanical stimulation of the scalp in humans. Neurosci Lett 195: 29–32. [DOI] [PubMed] [Google Scholar]
- Huang YP ( 2007): Image Analysis System of fMRI Based on Spatial Independent Component. Tainan: National Cheng Kung University. [Google Scholar]
- Itomi K, Kakigi R, Hoshiyama M, Watanabe K ( 2001): A unique area of the homonculus: The topography of the primary somatosensory cortex in humans following posterior scalp and shoulder stimulation. Brain Topogr 14: 15–23. [DOI] [PubMed] [Google Scholar]
- Kass JH, Nelson RJ, Sur M, Lin CS, Merzenich MM ( 1979): Multiple representations of the body within the primary somatosensory cortex of primates Science 204: 521–523. [DOI] [PubMed] [Google Scholar]
- Kim SG, Ashe J, Hendrich K, Ellermann JM, Merkle H, Ugurbil K, Georgopoulos AP ( 1993): Functional magnetic resonance imaging of motor cortex: Hemispheric asymmetry and handedness. Science 261: 615–617. [DOI] [PubMed] [Google Scholar]
- Li A, Yetkin FZ, Cox R, Haughton VM ( 1996):. Ipsilateral hemisphere activation during motor and sensory tasks. AJNR Am J Neuroradiol 17: 651–655. [PMC free article] [PubMed] [Google Scholar]
- Meador KJ, Ray PG, Day L, Ghelani H, Loring DW ( 1998): Physiology of somatosensory perception: Cerebral lateralization and extinction. Neurology 51: 721–727. [DOI] [PubMed] [Google Scholar]
- Nakamura A, Yamada T, Goto A, Kato T, Ito K, Abe Y, Kachi T, Kakigi R ( 1998): Somatosensory homunculus as drawn by MEG. Neuroimage 7: 377–386. [DOI] [PubMed] [Google Scholar]
- Nichols TE, Holmes AP ( 2002): Nonparametric permutation tests for functional neuroimaging: A primer with examples. Hum Brain Mapp 15: 1–25. [DOI] [PMC free article] [PubMed] [Google Scholar]
- Penfield W, Rasmussen T ( 1957): Cerebral Cortex of Man: A Clinical Study of Localization of Function. New York: MacMillan Company. [Google Scholar]
- Servos P, Engel SA, Gati J, Menon R ( 1999): fMRI evidence for an inverted face representation in human somatosensory cortex. Neuroreport 10: 1393–1395. [DOI] [PubMed] [Google Scholar]
- Singh LN, Higano S, Takahashi S, Kurihara N, Furuta S, Tamura H, Shimanuki Y, Mugikura S, Fujii T, Yamadori A, Sakamoto M, Yamada S ( 1998): Comparison of ipsilateral activation between right and left handers: A functional MR imaging study. NeuroReport 9: 1861–1866. [DOI] [PubMed] [Google Scholar]
- Talairach J, Tournoux P ( 1988): Co‐planar Steriotaxic Atlas of the Human Brain. New York: Thieme Medical Publishers, Inc. [Google Scholar]
- Taylor L, Jones L ( 1997): Effects of lesions invading the postcentral gyrus on somatosensory thresholds on the face. Neuropsychologia 35: 953–961. [DOI] [PubMed] [Google Scholar]
- Thompson ML, Thickbroom GW, Mastaglia FL ( 1997): Corticomotor representation of the sternocleidomastoid muscle. Brain 120: 245–255. [DOI] [PubMed] [Google Scholar]
- Volkmann J, Schnitzler A, Witte OW, Freund H ( 1998): Handedness and asymmetry of hand representation in human motor cortex. J Neurophysiol 79: 2149–2154. [DOI] [PubMed] [Google Scholar]
- Yang TT, Gallen CC, Schwartz BJ, Bloom FE ( 1993): Noninvasive somatosensory homunculus mapping in humans by using a large‐array biomagnetometer. Proc Natl Acad Sci USA 90: 3098–3102. [DOI] [PMC free article] [PubMed] [Google Scholar]


