

Abstract
The midcingulate cortex, as part of the more anteriorly located cingulate regions, is thought to play a major role in cognitive processes like conflict monitoring or response selection. Regarding midcingulate fissurization, the occurrence of a second or paracingulate sulcus is more common in the left than in the right hemisphere and has been shown to be associated with an advantageous performance on tests of executive functions. However, the cognitive mechanisms underlying such behavioral differences are completely unknown. The current study addressed this issue by comparing subjects with a low and a high degree of left hemispheric midcingulate fissurization while collecting behavioral as well as electrophysiological correlates of Stroop interference. A high degree of fissurization was associated with decreased behavioral Stroop interference accompanied by a stronger and prolonged frontal negative potential to incongruent trials starting around 320 ms. This increased frontal negativity is assumed to reflect an enhanced activity of a conflict monitoring system located in the midcingulate cortex. In contrast and starting around 400 ms, subjects with low fissurization revealed an increased positivity over parieto‐occipital regions suggesting a compensatory need for enhanced effortful cognitive control in this group. These results contribute to the understanding of the neuronal implementation of individual differences regarding attentional mechanisms. Hum Brain Mapp 2009. © 2008 Wiley‐Liss, Inc.
Keywords: dACC, stroop, paracingulate, conflict monitoring, cognitive control, fissurization
INTRODUCTION
As the most prominent structure of the human medial wall, the cingulate cortex has been subject to remarkable investigation regarding its contribution to cognitive processes. As it turned out, especially dorsal anterior portions of the cingulate cortex seem to be related to processes such as cognitive control [Fan et al.,2003], conflict monitoring [Botvinick et al.,2004b], response selection [van Veen and Carter,2005], error processing [Mathalon et al.,2003] or reward based decision making [Bush et al.,2002]. Particularly, the conflict monitoring view and its computational implementation by Cohen and colleagues [see Bogacz et al.,2006; Cohen et al.,2004] offer a powerful tool to the understanding of anterior cingulate functioning.
Although the cingulate cortex seems to be a unitary structure at first sight, recent research shows a high degree of functional as well as structural variability [Devinsky et al.,1995; Huster et al.,2007; Paus et al.,1996a; Vogt et al.,1992,1995,2003; Yucel et al.,2001]. With respect to the anteriorly located cingulate regions, a functional distinction between an affective and a cognitive subdivision has been put forward [e.g. Bush et al.,2000] with the latter being strongly associated with those processes described above. This specific area anatomically likely corresponds to the midcingulate cortex (MCC; see Fig. 1a for a depiction) as described by the four‐region model of Vogt et al. [2003] and is also often referred to as the dorsal anterior cingulate cortex (or dACC). In Vogt's model, the MCC is differentiated from the anterior cingulate cortex (ACC, formerly also denominated perigenual ACC or pACC). This division of the cingulate cortex, on the contrary, seems to match the affective subregion or ventral ACC (vACC).
Figure 1.
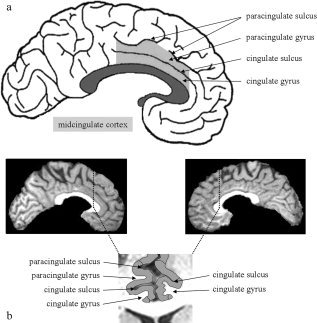
Midcingulate cortex and its surface topography. (a) This figure schematically depicts the surface morphology of the human medial wall. Accentuated in light gray is the midcingulate cortex (MCC), situated right above the corpus callosum (dark gray). (b) These sagittal and coronal views of a subject show a gyral doubling in the left‐ (occurrence of cingulate and paracingulate gyri) and a single cingulate gyrus only in the right‐hemispheric midcingulate region.
One very apparent pattern regarding regional morphological variability is the doubling of gyri and sulci frequently found in the MCC and the (perigenual) ACC. In these cases, the superior gyrus/sulcus is usually termed the paracingulate gyrus/sulcus (PCG/PCS), whereas the inferior elements are referred to as cingulate gyrus/sulcus (CG/CS). Please refer to Figure 1 (panels a and b) for an illustration. The first quantitative evaluation regarding variations in anterior cingulate folding was done by Paus et al. [1996a]. By manually tracing the PCS in the midcingulate region, the degree of regional fissurization was operationalized. In a large sample of 247 subjects, they found hemispheric differences in PCS occurrence and extension, as the PCS was more often present and more extended in the left as compared to the right hemisphere. In a study of Yucel et al. [2001], a leftward hemispheric asymmetry was further corroborated by computing individual asymmetry metrics showing a higher degree of asymmetry in right‐handed males as compared to right‐handed female subjects. This gender difference in right‐handed subjects has recently been confirmed [Huster et al.,2007], but a reversal was found in left handers, thereby indicating an interaction of gender and handedness. However, the leftward asymmetric pattern in MCC folding was dominating in all groups. Separate analyses per hemisphere additionally indicated that these variations in asymmetry are likely driven by the left rather than the right hemisphere.
Theoretical accounts suggest that the degree of regional fissurization may be associated with variations in local cytoarchitecture and neural connectivity [see Toro and Burnod,2005 for a thorough discussion]. In accordance with this notion, interindividual differences in midcingulate fissurization were shown to be correlated with varieties concerning other neuroanatomical attributes of this region. For example, the presence of a PCS seems to be indicative of a relative expansion of cytoarchitectural area 32′ [Vogt et al.,1995]. Similarly, Paus et al. [1996b] found a negative association of the intrasulcal gray matter volumes of the PCS and the CS. In more recent studies, Fornito et al. found the occurrence of a PCS to affect the overall volume and those of cingulate subregions (2004;2008). Moreover, subjects with a leftward PCS asymmetry seem to exhibit a distinct profile of bilateral changes in cortical thickness [Fornito et al., 2007].
Turning back to the functional characteristics of the MCC, most of the data obtained in neuroimaging and event‐related potential (ERP) studies seem to be explainable by viewing this region as a conflict monitoring system [see, for example, van Veen and Carter,2002a]. It is broadly accepted that the MCC is specifically responsive to the occurrence of conflict in relevant processing pathways. This region then signals the need for an increase in attentional control, likely exerted by prefrontal cortical areas. It is not surprising, therefore, that the so called interference tasks consistently lead to activations in the MCC. A well‐known example for this kind of task is given by the Stroop paradigm [e.g. Pardo et al.,1990]. In a meta‐analytic evaluation of Stroop fMRI data [Laird et al.,2005], two differing methodological approaches yielded similar patterns of activation predominantly in the inferior frontal gyrus and the MCC associated with the processing of interference. Notably, these data indicate the focus of midcingulate activations to be in the paracingulate region.
Taken together, differences in behavioral performance on tasks tapping executive control or conflict monitoring processes are to be expected with subjects exhibiting differences with respect to asymmetries of midcingulate fissurization. This assumption is based on the association of morphological differences in MCC fissurization with underlying neuroanatomical characteristics on one hand and the cited findings from the functional neuroimaging literature on the other hand. There already is some indication for the appropriateness of this assumption. Fornito et al. [2004, 2007] contrasted groups with varying degrees of PCS asymmetry in solely behavioral tasks engaging executive cognitive processes and control conditions. Here, subjects showing a leftward asymmetric pattern of MCC folding did better in verbal as well as nonverbal executive tasks when compared to subjects with rightward asymmetric or symmetric midcingulate fissurization. However, the cognitive mechanisms driving such behavioral differences need further investigation.
One aim of the present study was to gather further evidence for an association of regional midcingulate fissurization and behavioral performance in an interference task. A version of the Stroop paradigm [MacLeod,2005] was chosen for this purpose as the introduced interference effect appears to be highly robust. Specifically, when subjects are asked to indicate the color of a word, a relative increase in reaction times to incongruent stimuli (word meaning and font‐color do not match) as compared to congruent ones (both stimulus dimensions give analog information) can reliably be seen. Secondly, to elucidate the temporal dynamics and interactions of cognitive processes tapped by the task at hand that might underlie such expected behavioural differences between fissurizational groups, ERPs were recorded for later spatio‐temporal analysis. Prior ERP studies reliably found two Stroop‐related effects in the stimulus‐locked brain activity indicating differences in the processing of congruent and incongruent trials [Liotti et al.,2000; Markela‐Lerenc et al.,2004; van Veen and Carter,2002b; West,2003]. First, more negative going waves can be seen at fronto‐central electrodes between 300 and 500 ms for incongruent stimuli. This relative negative deflection has been shown to have a main neuronal generator situated in the MCC [Liotti et al.,2000; Markela‐Lerenc et al.,2004; West,2003] and is thought to reflect the detection of conflict. Later on in time, a higher positivity in the incongruent as compared to the congruent condition develops over posterior areas. In spite of some agreement that this late relative positivity stems from an increase in cognitive control reflecting the adaptation to task demands, the exact sites and sources for this effect are still a matter of debate. Based on these findings and in addition to the behavioral expectations, we assumed differences in the processing of conflict between subjects showing a high degree as opposed to those with a lower degree of MCC fissurization to occur predominantly between 300 and 500 ms regarding measured ERPs.
MATERIALS AND METHODS
Subjects
A total of 16 subjects (8 females) participated in the study as outlined below. These subjects were recruited according to their MCC morphology after screening of 90 individual anatomical T1‐weighted MRI scans (1 × 1 × 1 mm) from the institutes subject pool (Institute for Biomagnetism and Biosignalanalysis, University of Münster, Germany). Only right handers were included and the Edinburgh Handedness Inventory [Oldfield,1971] was used to psychometrically validate nominal hand preference. None of the subjects reported a history of psychiatric or neurological disorders. Due to strongly deviating signal to noise ratio in the ERP data, one female subject had to be excluded from further analysis. Thus, the final sample consisted of 15 subjects with a high (HF; male = 4, female = 3) and a low (LF; male = 4, female = 4) degree of fissurization of the MCC. The participants' age ranged from 22 to 39 (mean = 26.67 years) and HF/LF groups were matched for age and education. All subjects had completed high school education with a minimum of 10 years of schooling. Participants were tested for normal visual acuity as well as color vision. Written informed consent was obtained prior to study participation.
MCC Classification Protocol
In accordance with previous studies [Huster et al.,2007; Paus et al.,1996a; Yucel et al.,2001] the degree of individual MCC fissurization was quantified by measuring the occurrence and extension of the PCS. The approach taken here is based on a prior study and proofed to achieve high coefficients with respect to both inter‐ and intra‐rater reliability [for a detailed description see Huster et al.,2007].
The MCC was specified for each of the 90 individuals within the subject pool on the relevant anatomical T1‐weighted image. Whereas the rostral border was defined by a line at the most anterior extension of the callosal genu, the posterior delineation was given by a line running 10 mm caudally to the anterior commissure; both lines were projected perpendicular onto the AC‐PC plane. The PCS was defined as a fissure running dorsal and parallel to the CS. It had to be visible on the midsagittal plane and on at least three more lateral slices. If present, the extension of the PCS was traced voxelwise to yield a resolution in millimeters. Interruptions or gaps in the sulcal course were disregarded. These continuous measurements were transformed to a categorical variable for each hemisphere by grouping them in steps of 15 mm. According to this procedure, individual scores per hemisphere regarding the PCS occurrence are represented in five categories ranging from 0 (absent; no evidence for a gyral doubling or a supposed PCS shows a length of less than 15 mm) to 4 (prominent; more than 60 mm length of an estimated PCS). In this study, subjects from the LF group did not show a PCS in either hemisphere (category 0). To be included in the HF group the participants' PCS had to be prominent (category 4) in the left but completely absent (category 0) in the right hemisphere. By arranging these groups, subjects with an extreme form of the most common leftward asymmetric pattern of MCC fissurization [Huster et al.,2007; Yucel et al.,2001] were compared to the less common case of symmetry without a PCS in either hemisphere. Although planned, a rightward asymmetric group matched to the HF group regarding the degree of folding explicitness could not be derived from the subject pool.
Stimuli and Procedure
A randomly mixed‐trial version of the Stroop task was used. Subjects were instructed to indicate the font‐color in which the color‐words red, blue, green or yellow were presented by manually responding with the left or right index finger. The font‐colors blue and green were assigned to one, whereas red and yellow were matched to the other index finger. The specific font‐color to finger mapping was balanced across gender and fissurizational groups. With stimuli of the congruent condition, font‐color and color‐word were identical (e.g. “blue” written in blue). In case of the incongruent condition stimuli were not only semantically at conflict but the color of font and word also pointed to different response fingers (e.g. “blue” printed in red). The incongruent condition employed in our study was based on the differentiation of semantic and response conflict as described by van Veen and Carter [2005]. According to their observations, a higher difficulty, and therefore a maximal effect, can be achieved by combining conflict at both the semantic and the response level.
The experimental task began with an acquisition phase to familiarize the subjects with the relevant response assignments. Hence, subjects were presented with 16 trials during which colored boxes were shown and the correct response had to be made. Feedback, whether the response was accurate, was given immediately after the button press. Then, another block of 16 training trials encompassing the genuine Stroop stimuli was presented, again with feedback after each separate trial. This time, feedback was also given when the response was too slow (reaction time >1,350 ms). The actual experimental phase consisted of six blocks with 64 trials each (50% congruent and 50% incongruent). The participants were instructed not to emphasize speed over accuracy or vice versa. A blockwise feedback was shown on the screen. Subjects were encouraged to proceed as in the preceding block as long as their average reaction time was faster than 700 ms and the error rate was below 10%. Otherwise, subjects were instructed to speed up responding and/or to react more accurately, respectively.
At the beginning of a trial a fixation cross was shown with a randomized duration of 800–1200 ms, followed by a target presentation of 500 ms. A trial terminated after another 950–1,350 ms, meanwhile displaying a fixation cross. Trials were separated by a variable intertrial interval of 800–1,200 ms during which a blank screen was presented.
Stimuli were projected onto a screen in a dimly lit room via a beamer system while the exact physical target onset was measured by a photo diode. The Presentation software package (Presentation 9.90, Neurobehavioral Systems, Albany; USA) was used to operate the experimental procedure and to record behavioral responses. Stimuli were displayed against a black background in the center of the screen with a distance of 60 cm and an average visual angle of 2.8°.
ERP Acquisition and Parameterization
Electrophysiological as well as neuromagnetic responses were recorded in a magnetically shielded room, using a CTF Omega system for concurrent measurements of EEG and MEG (VSM MedTech, Coquitlam, Canada). As the integration of information from both the EEG and the MEG modality for individual neural source analyses is still in progress, the remainder of this article will exclusively focus on ERP data. Electrophysiological indices of brain activity were recorded from 63 sintered Ag/AgCl electrodes mounted on a flexible lycra‐electrocap (easycap, Falk Minow Services, Munich, Germany) according to the 10‐10 system for electrode placement [Chatrian et al.,1985]. The vertical and horizontal electrooculograms (EOG) were recorded from four electrodes placed on the outer canthi of both eyes and from the infra‐ and supra‐orbital ridges of the right eye. EEG and EOG recordings were taken continuously from DC up to 200 Hz, at a sampling rate of 600 Hz. Impedances were kept below 5 kΩ and matched for homologous sites with a maximum deviation of 500 Ω. Cz was used as online reference and a ground electrode was placed on the forehead. Offline, all electrodes were rereferenced against the common average reference and filtered from 0.1 to 15 Hz to increase the signal‐to‐noise ratio. Ocular (blinks and eye movements), muscular, as well as technical, artefacts were rejected offline by visual inspection. The continuous EEG was then segmented into epochs from 200 ms prestimulus to 800 ms poststimulus and baseline corrected to the mean of the prestimulus interval. Averages were computed separately for both the congruent and incongruent conditions excluding trials with erroneous responding as well as posterror trials.
Offline processing of the EEG data was done using the Brain Electrical Source Analysis program (BESA, Version 5.1.7, Megis Software, Heidelberg, Germany) and the ElectroMagnetic EncaphaloGraphy Software (EMEGS, Version 2.1).
Statistical Analyses
A repeated‐measure Analysis of Variance (ANOVA) with group (LF/HF) and condition (Congruent/Incongruent) was computed to assess the behavioral effects regarding mean reaction times on trials with correct responding, also excluding post‐error trials.
Regarding the accuracy data, Mann–Whitney U tests were calculated for both conditions to assess differences between HF and LF subjects. In addition, a separate Wilcoxon‐test for each group was used to test for differential accuracy between conditions.
The so called posterror slowing, an increase in reaction times to stimuli following an error trial, which is believed to reflect an adaptation in cognitive control, was evaluated, too. To this end, an ANOVA was computed with group as between factor and comparing reaction times from correct responses not preceded by an error and responses following trials with erroneous performance. The actual trials entering the analysis were congruent only as to avoid confounding with group‐specific differences in the processing of conflict.
After visual inspection of the ERPs and in accordance with prior findings from the literature, arithmetic means of the voltage amplitudes from the following time intervals were computed: 320–400 ms, 400–600 ms and 600–800 ms.
ERP data for these effects were analyzed by two separate repeated‐measures ANOVAs for each time window. The first analysis included the topographic factor midline with Fz, Cz and Pz as electrode locations. This approach reflects the standard way of analyzing the effects of interest as the condition‐specific differentiations in the Stroop paradigm seem to be most pronounced over the hemispheric midline. Nevertheless, given the exploratory nature of this analysis, a second ANOVA was conducted to more thoroughly assess topographic effects. Hemisphere (left/right), region (anterior/central/posterior) and eccentricity (inner/outer radius; F3–F4, C3–C4, P3–P4 vs. F7–F8, T7–T8, P7–P8) were used to describe ERP scalp amplitude distributions more specifically. Both ANOVAs included group (LF/HF) and condition (Congruent/Incongruent) as further factors of interest.
Lower‐order effects are reported only if the nature of higher‐order interactions allow for their interpretation. Greenhouse–Geisser epsilon corrections were computed when appropriate. The software package SPSS (SPSS, Chicago, USA) was used for statistical evaluations. Fisher LSD tests were calculated for post‐hoc assessments of relevant statistics but will explicitly be mentioned only when of special interest for the interpretation.
In addition to statistical significance testing, effect size estimates were computed using the procedures described in Rosenthal [1994] and Kline [2004]. Here, r 2 and ω2 were computed for nonparametric and parametric statistical comparisons, respectively. These measures are an estimate for the explained variance and range from zero to one. For variance‐analytic procedures, ω2 is comparable to R 2 with both measures indicating the proportion of the variance that is attributable to the effect. However, R 2 [also called estimated η2; see Kline,2004] describes the amount of variance accounted for in the sample, whereas ω2 is an estimate of the amount of variance accounted for in the population—therefore, ω2 tends to be lower than R 2. This approach was chosen due to the exploratory nature of this study. Furthermore, the sample size was constrained due to the limited availability of suited subjects, which may lessen the power of the statistical analyses. Because of the high number of statistical tests, effect size estimates or the degree of systematic variance will be reported only in addition to relevant test statistics or when otherwise of importance for the interpretation of observations.
RESULTS
Behavioral Data
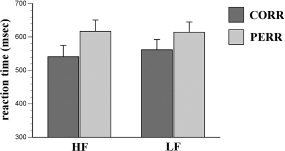
The analysis on reaction times approved the existence of behavioral Stroop interference. A significant main effect of condition revealed substantially decelerated responses to incongruent as opposed to congruent trials (F (1,13) = 44.43, P < 0.001, ω2 = 0.59). Affirming our expectations, LF subjects showed a more pronounced Stroop interference when compared to the HF group as revealed by an interaction of group and condition (F (1,13) = 4.73, P < 0.05, ω2 = 0.11; mean interference effects: LF = 61.54 ms, ω2 = 0.63; HF = 44.57 ms, ω2 = 0.57). Post hoc tests indicated the source for this interaction to stem from differences between groups in the incongruent but not the congruent condition (with ω2s' ≈ 0.09 and <0.01, respectively). Means and standard deviations of these effects are depicted in Figure 2a.
Figure 2.

Behavioral Stroop interference and accuracy scores per group and condition. (a) Mean reaction times and standard errors (brackets) of the high (HF) and low fissured (LF) groups to congruent (CO) and incongruent (IC) stimuli. Note the attenuated degree of behavioral Stroop interference in HF as compared to LF subjects. (b) Mean accuracy scores and standard errors (brackets) of HF and LF subjects in the CO and IC conditions.
With respect to accuracy scores, nonparametric tests suggested an overall lower percentage of errors in the congruent as compared to the incongruent condition (Z = −2.67, P < 0.01, r 2 = 0.16). Assessing these differences between conditions separately for both groups, the comparison reached significance for HF subjects only (HF: Z = −2.21, P < 0.03, r 2 = 0.27; LF: Z = −1.26, P < 0.21, r 2 = 0.14), thereby indicating a more pronounced effect in these subjects. However, when testing for varieties between groups for each condition separately, no statistically significant effects were found (r 2 < 0.02 and <0.01 for the congruent and incongruent condition, respectively). A depiction of mean accuracy scores can be found in Figure 2b.
The analysis of posterror reaction times revealed a substantial slowing when compared to correct responses not preceded by an error (F (1,12) = 5.1, P < 0.05, ω2 = 0.13; mean posterror slowing: 64.64 ms, SD = 77.89). Groups did not differ significantly in their degree of posterror adjustment (see Fig. 3).
Figure 3.
Posterror slowing. Shown are mean reaction times and standard errors (error bars) of subjects exhibiting a high (HF) and a low (LF) degree of midcingulate fissurization. Decelerated responses on correct posterror trials (PERR) as compared to correct trials not preceded by an error (CORR) define the so called posterror slowing.
ERP Data
Interval 320–400 ms
Both ANOVAs indicated significantly more negative going potentials to incongruent than to congruent trials. As was expected based on prior findings, this differentiation was most pronounced over the fronto‐central region (F (2,12) = 4.51, P < 0.05, ω2 = 0.07; interaction of factors condition and midline) and at inner electrodes (F (2,26) = 5.04, P < 0.03, ω2 = 0.04; three‐way interaction of condition, region and eccentricity). See Figure 4 for a depiction of Stroop interference in fronto‐central ERPs between 320 and 600 ms.
Figure 4.
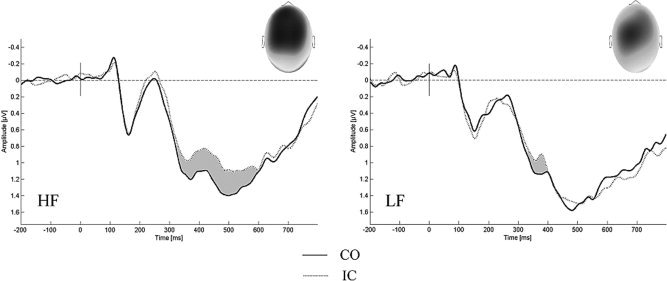
Fronto‐central interference effect between 320 and 600 ms. ERPs to congruent (CO) and incongruent (IC) stimuli aggregated over fronto‐central electrodes (Cz, C1, C2, FCz, FC1, FC2). Note the more pronounced or prolonged differentiation seen in high fissured (HF) as compared to low fissured (LF) subjects. The topography of the difference wave for the relevant time windows (gray) can be seen in the upper right corner; dark colors indicate negativity whereas bright colors indicate positive amplitudes. Observable as well is a global offset between groups, with more positive going waves for LF as compared to HF subjects, starting to develop at about 400 ms (refer to Fig. 5 for the topography of the difference wave).
Interval 400–600 ms
The statistical analyses revealed group‐specific differences in the progression of the ERPs. Only the HF group showed an ongoing differentiation between congruent and incongruent trials, again with a higher relative negativity in the incongruent condition (condition by group interaction; F (2,26) = 7.52, P < 0.02, ω2 = 0.18) and at Fz and Cz (condition by midline interaction; F (2,26) = 4.02, P < 0.05, ω2 = 0.06; posthoc tests regarding the differentiation of conditions reached significance for the HF group only). The more detailed topographic analysis again showed evidence for the symmetry of this group‐specific effect at inner electrodes (three‐way interaction of condition, group and eccentricity; F (2,26) = 5.32, P < 0.04, ω2 = 0.07) and in the fronto‐central region (condition by region by eccentricity interaction; F (2,26) = 7.52, P < 0.02, ω2 = 0.07; statistically relevant in HF subjects only as indicated by post hoc comparisons). A visualization can again be found in Figure 4.
Beyond this, a main effect of group in the analysis of the hemispheric midline indicated a global offset between HF and LF subjects with more positive going waves in the LF group (F (1,13) = 5.59, P < 0.04, ω2 = 0.23). Inspecting the topography of the difference wave from HF and LF subjects, the synopsis strongly suggests a parieto‐occipital origin of this effect (see Figs. 4 and 5).
Figure 5.
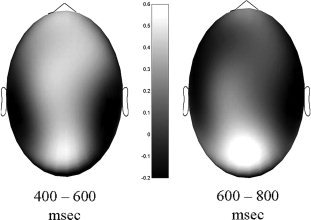
Topography of the positive offset with LF as compared to HF subjects. The figure depicts the topography of difference waves for the time windows from 400 to 600 and 600 to 800 ms indicating a higher positivity in low (LF) as compared to high fissured (HF) subjects.
Interval 600–800 ms
For this late time window, a condition by midline interaction approached significance due to a differentiation of ERPs between the incongruent and the congruent condition (F (2,26) = 17.45, P < 0.001, ω2 = 0.27). Here, brain waves evoked by incongruent trials reached more positive amplitudes with a maximum of this effect seen at Pz and an inversion at Fz. The topographic factors suggest the effect to be slightly more pronounced at lateral electrodes over the left hemisphere (three‐way interaction of condition, eccentricity and hemisphere; F (1,13) = 11.68, P < 0.01, ω2 = 0.08) and in the parietal region (F (2,26) = 6.15, P < 0.01, ω2 = 0.05; three‐way interaction of condition, region and hemisphere). A depiction of this effect is given in Figure 6.
Figure 6.
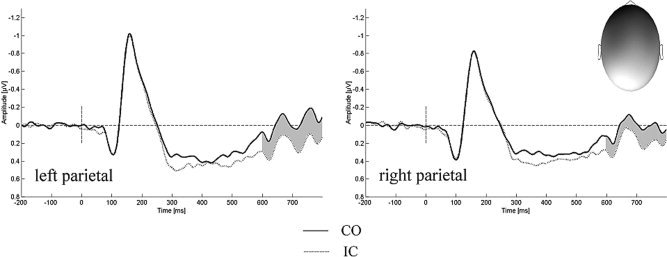
Interference effect over posterior brain regions. ERPs to congruent (CO) and incongruent (IC) stimuli aggregated over left‐ and right‐hemispheric electrodes (P3, P5, P7, PO3, PO7 vs. P4, P6, P8, PO4, PO8). The topography of the difference wave for the relevant time window (gray) can be seen in the upper right corner; dark colors indicate negativity whereas bright colors indicate positive amplitudes.
Again, a global offset between groups was indicated by a main effect in both analyses with more positive going waves for LF subjects (midline: F (1,13) = 5.66, P < 0.04, ω2 = 0.23; topographic: F (1,13) = 6.3, P < 0.03, ω2 = 0.26). The scalp topography of the difference wave can again be seen in Figure 5.
DISCUSSION
The obtained results foster the notion that differences in the degree of midcingulate fissurization are of importance regarding neurocognitive functioning as captured in tasks tapping executive processes. Subjects with a pronounced regional doubling of gyri in the left midcingulate area reveal a faster processing of interference‐laden stimuli as compared to subjects exhibiting a low degree of MCC fissurization. Electrophysiological data suggest these group differences in Stroop interference to reflect different predispositions regarding the reliance on fast and relatively automatic versus more effortful and controlled attentional processes.
Specifically, the behavioral data indicate a marked difference between both fissurization groups in the degree that incompatible information interferes with appropriate responding according to task demands. Participants with a pronounced PCS/PCG coped better with incongruent trials as manifested in faster responding, although they did not show a similar trend towards a relevant gain in the congruent condition. These results underscore the specificity of this effect regarding the processing of conflict within this paradigm. An augmented ability for the processing of conflicts in the high fissured group would also be in accordance with the study of Fornito et al. [2004, 2007] who found a leftward asymmetric folding of the MCC to be associated with better performance across both verbal and nonverbal executive tasks, whereas no effect was found in paradigms depending to a lower degree on executive functions. In the study at hand, accuracy data as well pointed to slight differences between HF and LF subjects with a higher accuracy differentiation between congruency conditions in the HF group. However, assessing varieties between groups for each condition separately, effect size estimates did not support the relevance of this phenomenon. Whereas the effect size for the comparison of HF and LF subjects in reaction times to the incongruent condition was quite large (ω2 > 0.09), similar contrasts for errors in the congruent and incongruent conditions explain less than 2% of variance. It can therefore be concluded that the attenuated reaction time to incongruent stimuli with HF subjects does not originate from an extensive shift towards less accurate responding (arguing against differential speed‐accuracy trade‐offs between groups). Furthermore, behavioral adaptation to conflict or errors, as measured via the degree of post‐error slowing seemed to be rather similar in both MCC fissurization groups.
With respect to ERPs associated with the processing of conflict, both groups demonstrated a dissociation of conditions with a higher relative negativity to incongruent trials between 320 and 400 ms at fronto‐central electrodes. Noteworthy, HF subjects exhibited a prolongation of this effect that lasted until 600 ms after stimulus presentation. Thus, ERPs revealed the expected difference between HF and LF subjects in a time window from 400 to 600 ms. The fronto‐central relative negativation to incongruent trials, often also referred to as N400 or N450, has now reliably been found in several studies from different groups [e.g., Liotti et al.,2000; Markela‐Lerenc et al.,2004; West,2003]. The cited surveys, applying source reconstruction techniques using equivalent current dipoles, confirmed the MCC as one major neuronal generator underlying this effect. In accordance with this notion and given our experimental manipulation, it is reasonable to assume that the observed pattern of ERPs stems from varying degrees of midcingulate activation. One might argue that differences in the orientation of underlying generators might cause the observed differences in ERP amplitudes as well. If this was a tenable explanation topographic differences between groups concerning the fronto‐central negativity are also to be expected. Importantly, topographic analyses did not indicate varieties between HF and LF participants regarding the scalp distributions of this relative negative potential, underscoring the assumption that neural generators did not vary substantially between time windows and groups. However, a study combining both fMRI and EEG measurements meant to directly address this issue is already on its way. According to the conflict monitoring hypothesis [Botvinick et al.,2004a,b], the MCC responds to the occurrence of conflict during information processing, thereby signaling the need for adjustments in cognitive control to prevent an overall drop in task performance. It is hypothesized that this cognitive process may specifically be situated in cytoarchitectural area 32′ as this region has reliably been shown to be activated during conflict laden trials [e.g. Laird et al.,2005]. There is some evidence indicating a stronger expansion of this area with persons exhibiting a pronounced paracingulate gyrus as compared to subjects showing a cingulate gyrus only [Vogt et al.,1995]. In accordance with such a notion is the observation of Crosson et al. [1999], who found activations during a word generation paradigm to be restricted to the cingulate gyrus and sulcus in cases without a proper paracingulate gyrus. With subjects exhibiting a paracingulate gyrus the activations rarely extended into the cingulate but were merely found in the paracingulate region. Nevertheless, the exact neuroanatomical underpinnings of behavioral and electrophysiological effects in the context of fissurizational differences need further research. Despite these open issues, it seems reasonable to conclude that the more pronounced dissociation of ERPs to congruent and incongruent trials found between 320 and 600 ms in HF subjects indicates a differential and likely higher ability in conflict monitoring.
Later in time, both groups exhibited more positive going waves for incongruent as compared to congruent trials. This finding, most pronounced over left posterior electrodes, again fits well with effects observed in prior ERP studies on the Stroop paradigm. Nevertheless, the exact neural generators as well as the cognitive processes reflected in this differentiation have not unequivocally been clarified yet. West and Alain [2000] suggested this difference in positive slow waves to be due to an amplified processing of perceptual level color information triggered by stimuli belonging to the incongruent condition. On the other hand, Liotti et al. [2000] interpreted this effect as stemming from a varying degree of semantic processing, likely reflecting a suppression of conceptual information on incongruent trials. At least there seems to be an agreement that this late differentiation mainly reflects an increase in cognitive control triggered by conflict‐laden stimuli. This interpretational ambiguity might be augmented by the obstacles associated with the interpretation of EEG scalp topographies. Inspecting the topography of the difference wave for this effect, contributions from parietal as well as generators in the occipital cortex are to be assumed. However, an involvement of frontal regions can not be ruled out. Indeed, when contrasting incongruent and congruent conditions in interference tasks, functional imaging studies commonly show activations in brain regions likely acting as sources (e.g. dorsolateral prefrontal cortex, DLPFC) and as sites (visual processing stream including extrastriate‐occipital regions) of attentional control [e.g., Liu et al.,2004]. In a Stroop study using face stimuli while recording hemodynamic responses, Egner and Hirsch [2005] could show that mechanisms of cognitive control are associated with an amplified processing of task‐relevant stimulus dimensions rather than the suppression of irrelevant features. This amplified cortical activation to stimulus features, observed in regions of the visual cortex, was accompanied by an augmented functional interaction with the DLPFC. In accordance with these studies, it can be concluded that the observed differentiation with more positive going waves to incongruent trials presumably reflects the activation of a broad network exerting cognitive control. The amplified processing of task‐relevant stimulus dimensions seems to be the functional equivalent to this phenomenon. Given the delayed onset of this effect when compared to stimulus presentation and mean reaction times, it seems adequate to assume that this late positivity to incongruent trials mainly reflects an adaptive process across trials, leading to enhanced target processing on the following trial [Gratton et al.,1992].
Statistical comparisons also indicated the occurrence of a distinct positive ERP offset in LF as compared to HF subjects starting at about 400 ms after stimulus presentation. Again, the topography of this effect denotes the involvement of a rather broad network, with emphasis over the occipital region becoming even more evident for the late time range. The similarities in appearance to the phenomenon described in the previous paragraph are obvious. In accordance with the preceding interpretation, this result likely reflects an increased need for a sustained and intensified evaluation of stimulus characteristics. The observed pattern of results suggest, that LF subjects can rely to a lesser extent on the conflict monitoring process, which is believed to take place in a relative automatic way. Therefore, in these subjects, the signalling of interference at hand, associated with the occurrence of incongruent stimuli, seems to operate less effective as compared to the HF group. To prevent either an intense increase of reaction times and/or significant loss of accuracy, the processing of stimuli principally has to be biased towards the task‐relevant stimulus dimension, here font‐color. This augmented degree of attentional control in LF subjects is than reflected as a more pronounced positive wave originating at about 400 ms over posterior brain regions. The onset of this effect likely reflects the enhanced processing of the task feature of the given target.
With respect to the adaptation of cognitive control after situations of conflict, no electrophysiological or behavioral evidence for strong varieties between groups was found: late positive slow waves elicited from both conditions did not interact with the factor group and both groups showed a similar degree of posterror slowing. These findings foster the assumption that both groups use quite differing global strategies to resolve this kind of interference task, although their adaptations in cognitive control to the occurrence of incongruent stimuli on a trial by trial basis seem to be rather alike.
We suggest that the observed pattern of behavioral and electrophysiological data reflect differences in the weighting of two major attentional processes between HF and LF subjects. Because of an increased ability in conflict monitoring as reflected in more pronounced midcingulate responding to incongruent trials, subjects with a high degree of MCC fissurization seem to resolve conflicts in information processing faster for a trial at hand. Recent research suggests that phasic release of norepinephrine from the locus coeruleus, eventually directly triggered by MCC signals, may be the mediating factor [Aston‐Jones and Cohen,2005]. LF subjects on the other hand, due to their relatively poor conflict monitoring abilities, need to more strongly rely on rather effortful processes of cognitive or attentional control. This interpretation is based on a global offset of positive slow waves (starting at about 400 ms) over posterior brain regions in these subjects. In accordance with functional imaging studies, this effect is presumably caused by the activity of brain regions associated with the augmented processing of stimulus features, such as color [Egner and Hirsch,2005].
This is one of the few attempts addressing the important and often disregarded issue of neuroanatomical structure‐function associations. Although the observations made are very promising and suggest relevance by itself, further research is needed to clarify some concerns tapped by this study. For example, one might argue that the lowered degree of behavioral interference, as reflected in mean reaction times with HF as compared to LF subjects, comes at the cost of higher error rates especially with incongruent trials. The obtained results thus could merely reflect differences between groups concerning a speed‐accuracy trade‐off. In this context, several points are worth considering. First, even when accepting such an interpretation one still has to wonder why these groups should spontaneously differ in this respect although a feedback was implemented to confine such effects. Beyond this, the term “speed‐accuracy trade‐off” already reflects that this concept is purely behaviorally defined and does not tell us much regarding underlying cognitive processes and therefore does not hamper our interpretations. Second, as is already laid out in the Discussion section, effect size estimates for behavioral group differences per condition reach a relevant degree in reaction times for the incongruent condition only. In addition, when correlating the difference scores between conditions for both reaction times and accuracy data, one would expect a speed‐accuracy trade‐off to be reflected in a relevant positive correlation of these indices. However, the computed correlation did not foster the existence of a shift in processing strategies (r = −0.089).
Summarizing, our results provide evidence for an association of MCC fissurization on one and the neurocognitive organization with respect to processes of executive control on the other side. Subjects displaying a well developed PCS/PCG did show a decreased Stroop interference effect when compared to a group exhibiting a low degree of regional folding. Electrophysiological recordings suggest that subjects with a high left hemispheric MCC fissurization can better rely on fast or automatic attentional processes while subjects without a paracingulate gyrus need to compensate for their weaker attentional filter contrast by more controlled and effortful attentional mechanisms. This study does not only carry implications for the understanding of interindividual differences in cognitive abilities such as conflict monitoring and cognitive control, but also sheds some light on the cerebral implementations of these processes.
REFERENCES
- Aston‐Jones G,Cohen JD ( 2005): Adaptive gain and the role of the locus coeruleus‐norepinephrine system in optimal performance. J Comp Neurol 493: 99–110. [DOI] [PubMed] [Google Scholar]
- Bogacz R,Brown E,Moehlis J,Holmes P,Cohen JD ( 2006): The physics of optimal decision making: a formal analysis of models of performance in two‐alternative forced‐choice tasks. Psychol Rev 113: 700–765. [DOI] [PubMed] [Google Scholar]
- Botvinick M,Braver TS,Yeung N,Ullsperger M,Carter CS,Cohen JD ( 2004a): Conflict monitoring: Computational and empirical studies In: Posner MI,editor. Cognitive Neuroscience of Attention. New York: The Guilford Press; pp 91–104. [Google Scholar]
- Botvinick MM,Cohen JD,Carter CS ( 2004b): Conflict monitoring and anterior cingulate cortex: An update. Trends Cogn Sci 8: 539–546. [DOI] [PubMed] [Google Scholar]
- Bush G,Luu P,Posner MI ( 2000): Cognitive and emotional influences in anterior cingulate cortex. Trends Cogn Sci 4: 215–222. [DOI] [PubMed] [Google Scholar]
- Bush G,Vogt BA,Holmes J,Dale AM,Greve D,Jenike MA,Rosen BR ( 2002): Dorsal anterior cingulate cortex: A role in reward‐based decision making. Proc Natl Acad Sci USA 99: 523–528. [DOI] [PMC free article] [PubMed] [Google Scholar]
- Chatrian GE,Lettich E,Nelson PL ( 1985): Ten percent electrode system for topographic studies of spontaneous and evoked EEG activity. Am J EEG Technol 25: 83–92. [Google Scholar]
- Cohen JD,Aston‐Jones G,Gilzenrat MS ( 2004): A systems‐level perspective on attention and cognitive control: Guided activation, adaptive gating, conflict monitoring, and exploitation versus exploration In: Posner MI, editor. Cognitive Neuroscience of Attention. London: Guilford Press; pp 71–90. [Google Scholar]
- Crosson B,Sadek JR,Bobholz JA,Gökçay D,Mohr CM,Leonard CM,Maron L,Auerbach EJ,Browd SR,Freeman AJ,Briggs RW ( 1999): Activity in the paracingulate and cingulate sulci during word generation: an fMRI study of functional anatomy. Cereb Cortex 9: 307–316. [DOI] [PubMed] [Google Scholar]
- Devinsky O,Morrell MJ,Vogt BA ( 1995): Contributions of anterior cingulate cortex to behaviour. Brain 118(Part 1): 279–306. [DOI] [PubMed] [Google Scholar]
- Egner T,Hirsch J ( 2005): Cognitive control mechanisms resolve conflict through cortical amplification of task‐relevant information. Nat Neurosci 8: 1784–1790. [DOI] [PubMed] [Google Scholar]
- Fan J,Flombaum JI,McCandliss BD,Thomas KM,Posner MI ( 2003): Cognitive and brain consequences of conflict. Neuroimage 18: 42–57. [DOI] [PubMed] [Google Scholar]
- Fornito A,Yucel M,Wood S,Stuart GW,Buchanan JA,Proffitt T,Anderson V,Velakoulis D,Pantelis C ( 2004): Individual differences in anterior cingulate/paracingulate morphology are related to executive functions in healthy males. Cereb Cortex 14: 424–431. [DOI] [PubMed] [Google Scholar]
- Fornito A,Wood SJ,Whittle S,Fuller J,Adamson C,Saling MM,Velakoulis D,Pantelis C,Yücel M ( 2008): Variability of the paracingulate sulcus and morphometry of the medial frontal cortex: Associations with cortical thickness, surface area, volume, and sulcal depth. Hum Brain Mapp 29: 222–236. [DOI] [PMC free article] [PubMed] [Google Scholar]
- Gratton G,Coles MG,Donchin E ( 1992): Optimizing the use of information: Strategic control of activation of responses. J Exp Psychol Gen 121: 480–506. [DOI] [PubMed] [Google Scholar]
- Huster RJ,Westerhausen R,Kreuder F,Schweiger E,Wittling W ( 2007): Morphologic asymmetry of the human anterior cingulate cortex. Neuroimage 34: 888–895. [DOI] [PubMed] [Google Scholar]
- Kline RB ( 2004): Beyond Significance Testing. Washington: American Psychological Association. [Google Scholar]
- Laird AR,McMillan KM,Lancaster JL,Kochunov P,Turkeltaub PE,Pardo JV,Fox PT ( 2005): A comparison of label‐based review and ALE meta‐analysis in the Stroop task. Hum Brain Mapp 25: 6–21. [DOI] [PMC free article] [PubMed] [Google Scholar]
- Liotti M,Woldorff MG,Perez R,Mayberg HS ( 2000): An ERP study of the temporal course of the Stroop color‐word interference effect. Neuropsychologia 38: 701–711. [DOI] [PubMed] [Google Scholar]
- Liu X,Banich MT,Jacobson BL,Tanabe JL ( 2004): Common and distinct neural substrates of attentional control in an integrated Simon and spatial Stroop task as assessed by event‐related fMRI. Neuroimage 22: 1097–1106. [DOI] [PubMed] [Google Scholar]
- MacLeod CM ( 2005): The Stroop task in cognitive research In: Wenzel A,Rubin DC, editors. Cognitive Methods and Their Application to Clinical Research. Washington, DC: American Psychological Association; pp 17–40. [Google Scholar]
- Markela‐Lerenc J,Ille N,Kaiser S,Fiedler P,Mundt C,Weisbrod M ( 2004) Prefrontal‐cingulate activation during executive control: Which comes first? Brain Res Cogn Brain Res 18: 278–287. [DOI] [PubMed] [Google Scholar]
- Mathalon DH,Whitfield SL,Ford JM ( 2003): Anatomy of an error: ERP and fMRI. Biol Psychol 64: 119–141. [DOI] [PubMed] [Google Scholar]
- Oldfield RC ( 1971): The assessment and analysis of handedness: The Edinburgh Handedness Inventory. Neuropsychologia 9: 97–113. [DOI] [PubMed] [Google Scholar]
- Pardo JV,Pardo PJ,Janer KW,Raichle ME ( 1990): The anterior cingulate cortex mediates processing selection in the Stroop attentional conflict paradigm. Proc Natl Acad Sci USA 87: 256–259. [DOI] [PMC free article] [PubMed] [Google Scholar]
- Paus T,Tomaiuolo F,Otaky N,MacDonald D,Petrides M,Atlas J,Morris R,Evans AC ( 1996a): Human cingulate and paracingulate sulci: pattern, variability, asymmetry, and probabilistic map. Cereb Cortex 6: 207–214. [DOI] [PubMed] [Google Scholar]
- Paus T,Otaky N,Caramanos Z,MacDonald D,Zijdenbos A,D'Avirro D,Gutmans D,Holmes C,Tomaiuolo F,Evans AC ( 1996b): In vivo morphometry of the intrasulcal gray matter in the human cingulate, paracingulate, and superior‐rostral sulci: Hemispheric asymmetries, gender differences and probability maps. J Comp Neurol 376: 664–673. [DOI] [PubMed] [Google Scholar]
- Rosenthal R ( 1994): Parametric measures of effect size In: Cooper H,Hedges LV, editors. The Handbook of Research Synthesis. New York: Russel Sage Foundation; pp 231–244. [Google Scholar]
- Toro R,Burnod Y ( 2005): A morphogenetic model for the development of cortical convolutions. Cereb Cortex 15: 1900–1913. [DOI] [PubMed] [Google Scholar]
- van Veen V,Carter CS ( 2002a): The anterior cingulate as a conflict monitor: fMRI and ERP studies. Physiol Behav 77: 477–482. [DOI] [PubMed] [Google Scholar]
- van Veen V,Carter CS ( 2002b): The timing of action‐monitoring processes in the anterior cingulate cortex. J Cogn Neurosci 14: 593–602. [DOI] [PubMed] [Google Scholar]
- van Veen V,Carter CS ( 2005): Separating semantic conflict and response conflict in the Stroop task: a functional MRI study. Neuroimage 27: 497–504. [DOI] [PubMed] [Google Scholar]
- Vogt BA,Berger GR,Derbyshire SW ( 2003): Structural and functional dichotomy of human midcingulate cortex. Eur J Neurosci 18: 3134–3144. [DOI] [PMC free article] [PubMed] [Google Scholar]
- Vogt BA,Finch DM,Olson CR ( 1992): Functional heterogeneity in cingulate cortex: The anterior executive and posterior evaluative regions. Cereb Cortex 2: 435–443. [DOI] [PubMed] [Google Scholar]
- Vogt BA,Nimchinsky EA,Vogt LJ,Hof PR ( 1995): Human cingulate cortex: Surface features, flat maps, and cytoarchitecture. J Comp Neurol 359: 490–506. [DOI] [PubMed] [Google Scholar]
- West R ( 2003): Neural correlates of cognitive control and conflict detection in the Stroop and digit‐location tasks. Neuropsychologia 41: 1122–1135. [DOI] [PubMed] [Google Scholar]
- West R,Alain C ( 2000): Effects of task context and fluctuations of attention on neural activity supporting performance of the stroop task. Brain Res 873: 102–111. [DOI] [PubMed] [Google Scholar]
- Yucel M,Stuart GW,Maruff P,Velakoulis D,Crowe SF,Savage G,Pantelis C ( 2001): Hemispheric and gender‐related differences in the gross morphology of the anterior cingulate/paracingulate cortex in normal volunteers: An MRI morphometric study. Cereb Cortex 11: 17–25. [DOI] [PubMed] [Google Scholar]