

Abstract
Early visual deprivation may lead to both abnormal and plastic changes in the visual and other systems of the brain. Such secondary changes in the gray matter of the early blind have been well studied, but not so well in the cerebral white matter whose subtle changes may be revealed by diffusion tensor imaging. The first purpose of this study is to explore the possible changed white matter regions of the early blind in whole brain manners, using voxel‐based analysis (VBA) and tract‐based spatial statistics (TBSS) methods. The second purpose is to investigate the changes of diffusion eigenvalues in the abnormal white matter fiber tracts using tractography based group mapping analysis. From VBA of fractional anisotropy (FA) images, the significant changed white matter regions were the geniculocalcarine tract (GCT) and its adjacent regions. This finding was validated by TBSS method. Then we studied the changes of mean diffusivity (MD), FA, primary (λ1) and transverse diffusivities (λ23) in the GCT using tractography based group mapping analysis. We found the early blind had significantly lower FA (P < 0.0001), higher MD (P = 0.001) and λ23 (P < 0.0001) in the GCT. This pattern of diffusion changes is similar to findings seen in immaturity or axonal degeneration. Thus, we suggest that transneuronal degeneration and/or immaturity may account for the abnormal diffusion changes in the GCT of the early blind. Hum Brain Mapp 2009. © 2007 Wiley‐Liss, Inc.
Keywords: early blind, diffusion tensor imaging, tractography, visual system
INTRODUCTION
Early‐onset blindness can lead to structural and functional changes in brain regions, which are related to the visual system. Many functional imaging studies reported that the visual cortex of the early blind was activated during performing different tasks, such as language processing [Amedi et al.,2003; Burton and McLaren,2006; Buchel et al.,1998; Burton et al.,2002], tactile discrimination [Burton et al.,2006; Sadato et al.,1996,1998], and auditory stimuli [Kujala et al.,2005; Poirier et al.,2006]. These studies suggest that the visual cortex is functionally reorganized due to early visual deprivation.
The structural changes of the brain induced by early blindness have not been studied extensively. Postmortem studies suggested transneuronal degeneration in the human visual system after sight loss [Beatty et al.,1982]. By the use of voxel‐based morphometry (VBM) method, decreased gray and white matter volumes in the visual system and increased white matter volumes in the sensory‐motor system were reported [Noppeney et al.,2006]. Abnormalities of the geniculocalcarine tract (GCT) have been revealed by a study based on diffusion tensor tractography in five early blind subjects [Shimoney et al.,2006]. However, no diffusion tensor imaging (DTI) study has been performed to investigate the white matter integrity of the early blind in a whole brain manner.
DTI has the potential to noninvasively evaluate the white matter integrity and fiber connectivity in vivo. Mean diffusivity (MD) and fractional anisotropy (FA) are two diffusion measures most commonly used in assessing many brain diseases, such as schizophrenia [Kanaan et al.,2005], Alzheimer disease [Medina et al.,2006], and neuromyelitis optica [Yu et al.,2006]. The MD reflects the amplitude of water diffusion whilst the FA reflects the directionality of water diffusion. With the use of the DTI technique, the white matter integrity can be analyzed in a whole brain manner or a local manner. In the case of an exploratory study, voxel‐based analysis (VBA) [Foong et al.,2002; Medina et al.,2006; Rose et al.,2006] and tract‐based spatial statistics (TBSS) [Smith et al.,2006] of diffusion data are two main methods used to localize white matter changes in a whole brain manner. Once the abnormal white matter is localized or pre‐specified, regions of interest (ROI) or tractography‐based analysis could be performed to investigate the changes of diffusion indices inside these abnormal brain regions [Alexander et al.,2007; Lin et al.,2006].
For early blindness, no previous DTI study to date has explored the white matter changes in a whole brain manner. Thus we first used VBA and TBSS method to localize white matter changes in the early blind. After we found the abnormal white matter fiber tract, tractography based group mapping analysis was employed to compare the diffusion indices in the abnormal white matter fiber tracts between groups. Moreover, diffusion tensor eigenvalues were also included in the analysis since they may provide complementary information for the underlying pathologic changes [Hasan,2006].
MATERIALS AND METHODS
Subjects
Seventeen early blind subjects (10 males, 7 females; mean age 22 years, range 16–29 years) and 17 normally sighted controls (10 males, 7 females; mean age 23 years, range 19–28 years) participated in this study. All blind subjects were recruited from Special Education College of Beijing Union University. Blindness onset was within 1 year for all blind subjects. The demographic data of the early blind are shown in Table I. All participants were right‐handedness according to the Edinburgh handedness inventory [Oldfield,1971]. Each participant provided a written informed consent before MRI examinations and this study was approved by the Medical Research Ethics Committee of Xuanwu Hospital of Capital Medical University.
Table I.
Demographic data of the early blind subjects
| Casenumber | Sex | Age, years | Age onset, years | Causes of blindness |
|---|---|---|---|---|
| 1 | Female | 22.8 | 0 | Retinitis pigmentosa |
| 2 | Male | 20.9 | 0 | Retinitis pigmentosa |
| 3 | Male | 24.6 | 0 | Optic nerve atrophy |
| 4 | Male | 19.1 | 0 | Retinitis pigmentosa |
| 5 | Male | 24.6 | 0 | Retinitis pigmentosa |
| 6 | Male | 22.4 | <1 | Congenital glaucoma |
| 7 | Male | 29.3 | 0 | Optic nerve hypoplasia |
| 8 | Male | 23.4 | <1 | Congenital glaucoma |
| 9 | Female | 15.6 | 0 | Optic nerve atrophy |
| 10 | Female | 18.4 | 0 | Retinitis pigmentosa |
| 11 | Female | 21.7 | 0 | Congenital glaucoma |
| 12 | Male | 20.8 | <1 | Congenital glaucoma |
| 13 | Male | 18.7 | 0 | Optic nerve hypoplasia |
| 14 | Male | 19.0 | 0 | Retrolental fibroplasia |
| 15 | Female | 27.7 | 0 | Optic nerve atrophy |
| 16 | Female | 22.7 | 0 | Congenital cataract |
| 17 | Female | 24.9 | 0 | Optic nerve hypoplasia |
Data Acquisition
DTI was performed with a 3.0 T Siemens Trio MR system using a standard head coil. Head motion was minimized with restraining foam pads provided by the manufacturer. Diffusion weighted images were acquired employing a single‐shot echo planar imaging (EPI) sequence in alignment with the anterior–posterior commissural plane. Integral parallel acquisition technique (iPAT) was used with an accelerate factor of 2. Acquisition time and image distortion from susceptibility artifacts can be reduced by the iPAT method. The diffusion sensitizing gradients were applied along 12 nonlinear directions (b = 1,000 s/mm2), together with an acquisition without diffusion weighting (b = 0 s/mm2). The imaging parameters were 45 continuous axial slices with a slice thickness of 3 mm and no gap, field of view = 256 × 256 mm2, repetition time/echo time = 6,000/87 ms, acquisition matrix = 128 × 128. The reconstruction matrix was 256 × 256, resulting in an in‐plane resolution of 1 × 1 mm2. Finally, the voxels were interpolated to isotropic size of 1 mm.
Data Preprocessing
Eddy current distortions and motion artifacts in the DTI dataset were corrected by applying affine alignment of each diffusion‐weighted image to the b = 0 image, using FMRIB's diffusion toolbox (FSL, version 3.3; http://www.fmrib.ox.ac.uk/fsl). After this process, the diffusion tensor elements were estimated by solving the Stejskal and Tanner equation [Basser et al.,1994], and then the reconstructed tensor matrix was diagonalized to obtain eigenvalues (λ1, λ2, λ3) and eigenvectors. The FA, MD, primary diffusivity (λ1) and transverse diffusivity (λ23) of each voxel were calculated according to the following formulas:
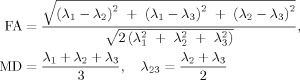 |
Voxel‐Based Analysis of FA Images
For each subject, the diffusion unweighted image (b = 0) was first normalized to the standard montreal neurological institute (MNI) space using EPI template with SPM2 (Wellcome Department of Cognitive Neurology, London, UK). The normalization consists of a 12 degree‐of‐freedom linear transformation and a non‐linear transformation with 7 × 8 × 7 basis functions. Parameters from this transformation were then applied to the FA image to normalize the FA image to the standard EPI template, resampling the volume into a voxel size of 2 × 2 × 2 mm3. Further, each FA image was spatially smoothed by an 8‐mm full‐width at half maximum Guassian kernel to reduce the effect of misregistration in spatial normalization [Ashburner and Friston,2000; Jones et al.,2005].
A two‐sample t‐test was used to compare the FA values between early blind group and normal group in a voxel‐based manner. Significance was determined with a P < 0.05 (false discovery rate corrected) [Genovese et al.,2002] and cluster size > 30 voxels. To demonstrate the locations of the clusters showing significantly different FA between groups, group‐average post‐aligned FA images for the two groups were created (see Fig. 1) and the results were superimposed onto the average image of post‐aligned FA images of all subjects (see Fig. 2).
Figure 1.
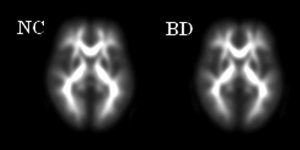
Group‐average post‐aligned FA images for the two groups (left: normal group; right: blind group).
Figure 2.
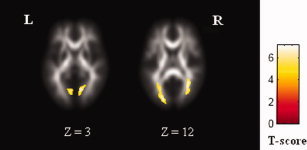
Clusters with reduced FA in the early blind superimposed onto the average image of post‐aligned FA images of all subjects. [Color figure can be viewed in the online issue, which is available at www.interscience.wiley.com.]
Tract‐Based Spatial Statistics of Diffusion Measures
First, TBSS of FA images was carried out using TBSS in the FMRIB software library (FSL 3.3; http://www.fmrib.ox.ac.uk/fsl; for detailed description of methods, see Smith et al.,2006]. Steps of TBSS analysis in our study as follows:
-
1
Align the FA images of all subjects to a preidentified target FA image by nonlinear registrations.
-
2
Transform all the aligned FA images into 1 × 1 × 1 mm3 MNI152 space by affine registrations.
-
3
Create the mean FA image and its skeleton from control + blind dataset in MNI152 space (see Fig. 3).
-
4
Project individual subjects' FA onto the skeleton.
-
5
Voxelwise statistics across subjects for each point on the common skeleton.
Figure 3.
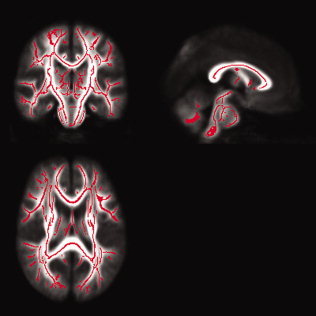
Mean FA tract skeleton (in red) overlaied on the mean FA map derived from all subjects. [Color figure can be viewed in the online issue, which is available at www.interscience.wiley.com.]
A control‐blind unpaired t‐test was applied to carry out voxelwise statistics. Inference was carried out using cluster‐size thresholding, which clusters initially defined by t > 3. The null distribution of cluster‐size statistic was built up over 5,000 permutations of group membership, with the maximum size (across space) recorded at each permutation. The significance was determined with a P < 0.05 (corrected for multiple comparisons at the cluster level).
Similarly, TBSS analyses of MD, λ1 and λ23 images were performed, respectively.
Reduced FA and increased λ23 in the GCT of the early blind was found (see Fig. 4). No significant changes of MD and λ1 were found. As an important part of the visual pathway of normally sighted people, the GCT contains fiber projections from the lateral geniculate nucleus (LGN) of the thalamus to the primary visual cortex. In the next step, we would use diffusion tensor tractography to compare the diffusion indices (FA, MD, λ1 and λ23) in the GCT between groups.
Figure 4.
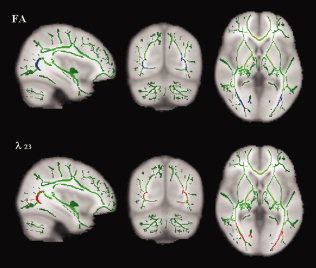
Clusters with reduced FA (top: in blue) and increased λ23 (bottom: in red) in the early blind overlaid on the mean FA skeleton map (in green). [Color figure can be viewed in the online issue, which is available at www.interscience.wiley.com.]
Tractography Based Group Mapping
Diffusion tensor tractography in this study was implemented with DTIstudio, Version 2.40 software (H. Jiang, S. Mori; Johns Hopkins University). The GCT was reconstructed for each normal control by using the “fiber assignment by continuous tracking” method [Mori et al.,1999]. All tracts in the dataset were computed by seeding each voxel with a FA greater than 0.3. The FA threshold was selected according to Mori et al. [2002], who recommended the FA threshold of 0.25–0.35 for fiber tracking. Tractography was terminated if it turned an angle greater than 70° or reached a voxel with a FA less than 0.3. On the basis of anatomical knowledge of fiber projections, two coronal ROIs determined on the FA‐weighted, directionally encoded color maps were placed to select the fiber bundles of the GCT. The first ROI was placed on the LGN and the second one was placed around the calcarine sulcus in the primary visual cortex (see Fig. 5). The fibers bundles passing through both ROIs were reserved as the GCT (see Fig. 6).
Figure 5.
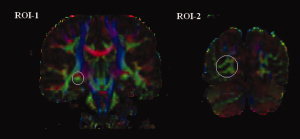
ROI determined on the FA‐weighted, directionally encoded color maps. The first ROI (ROI‐1) was placed on the LGN and the second one (ROI‐2) was placed around the calcarine sulcus in the primary visual cortex. [Color figure can be viewed in the online issue, which is available at www.interscience.wiley.com.]
Figure 6.
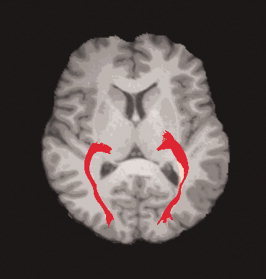
Representative of reconstructed GCT of a normal subject.
For early blind, the GCT was less reliably identified [Shimoney et al.,2006]. Therefore, the GCT probability map was created from the tractography results of normal controls, and then this map was applied to early blind subjects to calculate the diffusion indices inside the GCT. [Color figure can be viewed in the online issue, which is available at www.interscience.wiley.com.]
The GCT probability map was created as follows: First, the b = 0 images were normalized to the standard MNI space with SPM2. Parameters from this transformation were then applied to the coordinates of curves forming the fiber bundles. The resampled voxel size was 1 × 1 × 1 mm3 for normalization. A 3D GCT mask was created by counting the voxels through which the GCT passed in the MNI space. Finally, all these masks from normal controls were averaged to obtain a GCT probability map. The value of each voxel in the map could be regarded as the probability that the voxel was part of the GCT.
After the GCT probability map was created (see Fig. 7), the following procedure was performed to calculate the diffusion indices inside the GCT. First, the b = 0 image for each subject was normalized to the MNI space. Second, the transformation parameters were applied to normalize the corresponding diffusion indices images (FA, MD, λ1 and λ23), resampling the volume into a voxel size of 1 × 1 × 1 mm3. Then the weighted mean of the diffusion indices inside the GCT were calculated by superimposing the probability map on the normalized diffusion indices images.
Figure 7.
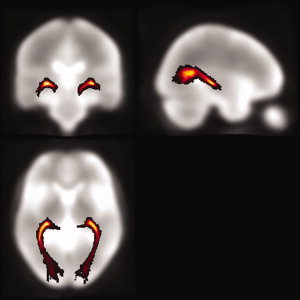
The GCT probability map.
The diffusion indices (FA, MD, λ1 and λ23) inside the GCT were calculated for each subject. Two‐sample t‐tests were performed to compare these indices between groups. The tests were considered significant when P values were less than 0.01 (two‐tailed). [Color figure can be viewed in the online issue, which is available at www.interscience.wiley.com.]
RESULTS
VBA Analysis
Voxel‐based comparison of FA images had revealed several white matter regions with significantly lower FA in early blind than normal controls. Talairach locations of these regions correspond to bilateral lingual gyri and temporal‐occipital regions, including middle occipital gyrus, cuneus and sub‐gyral of temporal lobe. No region with higher FA in the early blind was found. The Talairach coordinates of brain regions with significantly different FA were given in Table II.
Table II.
Talairach locations of white matter regions with reduced FA in the early blind
| Corresponding anatomical locations | Clustersize | Z score | Centroid voxel | ||
|---|---|---|---|---|---|
| x | y | z | |||
| Left lingual gyrus | 149 | 5.21 | −10 | −70 | 2 |
| Right lingual gyrus | 168 | 5.18 | 14 | −68 | 3 |
| Left temporal‐occipital regions | 322 | 5.41 | −26 | −67 | 14 |
| Right temporal‐occipital regions | 250 | 5.5 | 32 | −60 | 12 |
TBSS Analysis
An excellent mean FA tract skeleton was first created. Compared with normally sighted people, early blind had reduced FA and increased λ23 in bilateral GCT. No significant differences of the diffusion measures between two groups were found in other brain regions.
Tractography Based Analysis
A typical GCT could be well reconstructed for each normal control, but for early blind the tractography results of the GCT were not consistent. Compared with normal controls, early blind subjects had significantly higher MD (P = 0.001), λ23 (P < 0.0001) and lower FA (P < 0.0001) in the GCT, and no difference in λ1 (P = 0.26) (Table III).
Table III.
Group comparisons of the diffusion indices in the GCT
| Normal controls | Blind subjects | P‐value | |
|---|---|---|---|
| FA | 0.43 ± 0.02 | 0.38 ± 0.02 | <0.0001* |
| MD (10−3 mm2/s) | 0.84 ± 0.02 | 0.87 ± 0.03 | 0.001* |
| λ1 (10−3 mm2/s) | 1.25 ± 0.04 | 1.24 ± 0.03 | 0.26 |
| λ23 (10−3 mm2/s) | 0.63 ± 0.02 | 0.68 ± 0.03 | <0.0001* |
A P‐value of less than 0.01 was considered statistically significant.
DISCUSSION
In this study, we first explored the possible changed brain regions of the early blind in a whole brain manner using VBA of FA images and found that the significant changed white matter regions in the early blind were restricted to the GCT and its adjacent regions. Then we validated the findings by TBSS method. Finally, we studied the changes of diffusion eigenvalues in the GCT using tractography based group mapping analysis and found that the early blind had significantly lower FA, higher MD and λ23 in the GCT.
Limitations of Analysis Methods for DTI
As a useful exploratory method, VBA is widely employed in anisotropy analysis to detect the white matter changes in many brain diseases [Foong et al.,2002; Vangberg et al.,2006]. All steps of this method were automatically performed with a higher reproducibility than ROI and tractography based methods. However, the normalization algorithm available in SPM was not designed to work with the highly heterogeneous FA images derived from DTI data, with the consequent risk of false‐positive results. Therefore, one should be cautious in interpreting the results of VBA. In this study, the clusters with Z = 12 were within the main local tract regions, however, part of the voxels in the clusters with Z = 3 were located in the gray matter, which may be caused by the misregistration in spatial normalization [Ashburner et al.,2000]. Another limitation of the VBA method is the arbitrary choice of smoothing kernels, which has been discussed in detail in previous studies [Jones et al.,2005]. In this study, the cut‐off for P value and cluster size was strictly chosen, experimentally in the present studies. We also tested the results with different smoothing filters (4, 8, and 12 mm FWHM), and the similar group difference was found at all three smoothing filters, though with different precision about the exact localization and cluster size of group differences. However, compared with previous VBM study of the early blind [Noppeney et al.,2006], we found limited white matter regions with diffusion changes, and no region with increased FA was found. This may be caused by the different image modalities used in different studies as well as the limitations of VBA method. Using diffusion tensor tractography, plasticity of the corticospinal tract in early blindness has been revealed [Yu et al.,2007]. It suggests that VBA method with correction for multiple comparisons is less sensitive in detecting local changes of the white matter than ROI or tractography based methods.
Compared with VBA method, TBSS is preferred, because it overcomes the drawbacks in VBA method, such as alignment issue and smoothing issue [Smith et al.,2006]. In this study, the mean FA tract skeleton derived from control and blind dataset was carefully created. We also checked the projected FA skeleton of each subject to ensure it matched well with its aligned FA image. Then TBSS of several diffusion measures were performed to localize the white matter changes in the early blind. The result revealed the same region with abnormal diffusion as VBA method, and it gave more precise location of the abnormality in the GCT.
Besides analysis of DTI data in a whole brain manner, ROI and tractography based analysis are also popular methods utilized in DTI studies. The measures could be calculated from ROIs or tracked fibers defined on the basis of prior anatomical knowledge. However, the placement of ROIs on a 2D slice is subjective and the validity is affected by the experience of the operators. As an alternative to manual ROI analysis, the use of tractography to depict a 3D ROI could reduce intra‐rater and inter‐rater variability and improve reproducibility. There still exists the problem of defining the corresponding part of the tract for measurement over a population. Here we calculated the diffusion indices for each subject within a common GCT probability map in the MNI space. This tractography based group mapping method creates the group map of the white matter tracts to compensate for inter‐subject variability, which is important for investigating how white matter is affected by pathological conditions of the brain. In this study the common GCT probability map was created from the normal group and then was applied to the blind group because the GCT of the early blind could not be well reconstructed by a rather simplistic fiber tracking algorithm. This approach may cause the tractography‐based analysis to suffer from the same (alignment‐related) danger of a VBA/VBM‐style analysis. Therefore, in a future study, high quality DTI images with more diffusion encoding directions should be acquired and then the probabilistic tractography could be implemented in all individuals to produce more reliable results.
Although each analysis method for DTI has its advantages and limitations, the combination of these methods could give a more complete view of the results. In this study, we have shown good consistency between VBA and TBSS method for white matter abnormalities of reduced FA in the whole brain of the early blind. Then tractography based group mapping analysis was employed to further investigate how the diffusion indices changed in the abnormal white matter tracts, which gave more information on the microstructure changes due to early visual deprivation.
Diffusion Changes in the Visual System
The analysis of the changes of diffusion tensor eigenvalues may provide more information about pathology [Hasan,2006]. λ1, representing the diffusivity parallel to the principle axis of the fiber, reflects the changes of restricted barriers along the direction of the fiber tract and the changes of extracellular space. λ23, representing the diffusivity perpendicular to the principle axis of the fiber, reflects the changes of axonal membrane, myelin sheath and extracellular space [Le Bihan,2003; Pierpaoli and Basser,1996]. In this study, we found that early blind had significantly higher MD, λ23 and lower FA in the GCT. No group difference was found in λ1. The results are consistent with the study of Shimoney et al. [2006], who have reported the abnormal MD and anisotropy values in the GCT based on diffusion tensor tractography in five early blind subjects. Such characteristic changes of diffusion indices are similar to findings seen in immaturity [Huppi et al.,1998a,b; Mukherjee et al.,2002] and axonal degeneration [Pierpaoli et al.,2001]. Thus, we speculate that two possible mechanisms may account for the abnormal changes in the GCT of the early blind. One is transneuronal degeneration secondary to the lesions in the optic nerve and retina, the other is immaturity of the visual system due to early visual deprivation.
Lesions in the optic nerve and retina are an important reason for early blindness. These lesions may lead to transneuronal degeneration in the GCT. Supporting evidence include: (1) Postmortem study has suggested transneuronal degeneration in the LGN is a common consequence of visual deprivation in humans [Beatty et al.,1982]. (2) Recent structural MRI study demonstrated early blind had decreased gray matter volume in early visual areas accompanied by atrophy of the optic chiasm and the optic radiation [Noppeney et al.,2006]. (3) A DTI study found that patients affected by optic neuritis showed pathologic abnormalities in the GCT secondary to the optic nerve damage [Ciccarelli et al.,2005]. Therefore, for early blind in this study, transneuronal degeneration secondary to the pathology in the retina or optic nerve may be an important mechanism for the abnormal diffusion in the GCT.
Considering all the blind people in this study lost their sight before 1 year of age or congenitally, immaturity of the visual system due to altered visual experience during critical periods of neurodevelopment is also a possible reason for the abnormalities in the GCT. Sensory experience can alter the structural organization in both gray and white matter during early critical periods of neurodevelopment [Crair et al.,1998; Sengpiel and Kind,2002; Sur and Leamey,2001]. The development of human visual system contains two stages: experience‐independent processes and experience‐dependent processes. It starts from the embryonic period before eye‐opening and lasts for several years after eye‐opening. Although the initial formation of the retina, LGN and primary visual cortex begins in the experience‐independent stage, the maturation and refinement of crude initial connectivity are determined by patterned activity in the experience‐dependent stage [Sengpiel and Kind,2002]. For early blind, lack of afferent input from the retina to the LGN at an early stage may lead to immaturity of the LGN and the GCT, which are important structures for the transmission of the visual stimuli and are greatly dependent on the visual experience during development. Therefore, we suggest that immaturity of the visual system due to lack of early visual input is also an important reason for the abnormal diffusion in the GCT of the early blind. This speculation is also supported by Schoth et al. [2006], who did not find abnormal diffusion in the GCT in acquired blindness.
CONCLUSIONS
In this study, we employed three analysis methods to investigate the white matter integrity of the early blind. Good consistency for the statistical results of abnormalities in the GCT was obtained among different methods, which gave a complete view of the diffusion changes in the early blind. We also found the characteristic changes of diffusion indices (decreased FA, increased MD and λ23) in the GCT, which resembled the changes in immaturity or axonal degeneration. In conclusion, we suggest that transneuronal degeneration and/or immaturity may account for the abnormal diffusion changes in the GCT of the early blind.
Contributor Information
Chunshui Yu, Email: csyu@nlpr.ia.ac.cn.
Tianzi Jiang, Email: jiangtz@nlpr.ia.ac.cn.
REFERENCES
- Alexander AL,Lee JE,Lazar M,Boudos R,DuBray MB,Oakes TR,Miller JN,Lu J,Jeong EK,McMahon WM,Bigler ED,Lainhart JE( 2007): Diffusion tensor imaging of the corpus callosum in Autism. Neuroimage 34: 61–73. [DOI] [PubMed] [Google Scholar]
- Amedi A,Raz N,Pianka P,Malach R,Zohary E( 2003): Early “visual” cortex activation correlates with superior verbal memory performance in the blind. Nat Neurosci 6: 758–766. [DOI] [PubMed] [Google Scholar]
- Ashburner J,Friston KJ( 2000): Voxel‐based morphometry—The methods. Neuroimage 11(Part 1): 805–821. Review. [DOI] [PubMed] [Google Scholar]
- Basser PJ,Mattiello J,LeBihan D( 1994): Estimation of the effective self‐diffusion tensor from the NMR spin echo. J Magn Reson B 103: 247–254. [DOI] [PubMed] [Google Scholar]
- Beatty RM,Sadun AA,Smith L,Vonsattel JP,Richardson EP Jr( 1982): Direct demonstration of transsynaptic degeneration in the human visual system: A comparison of retrograde and anterograde changes. J Neurol Neurosurg Psychiatry 45: 143–146. [DOI] [PMC free article] [PubMed] [Google Scholar]
- Buchel C,Price C,Frackowiak RS,Friston K( 1998): Different activation patterns in the visual cortex of late and congenitally blind subjects. Brain 121(Part 3): 409–419. [DOI] [PubMed] [Google Scholar]
- Burton H,McLaren DG( 2006): Visual cortex activation in late‐onset, Braille naive blind individuals: An fMRI study during semantic and phonological tasks with heard words. Neurosci Lett 392: 38–42. [DOI] [PMC free article] [PubMed] [Google Scholar]
- Burton H,Snyder AZ,Conturo TE,Akbudak E,Ollinger JM,Raichle ME( 2002): Adaptive changes in early and late blind: A fMRI study of Braille reading. J Neurophysiol 87: 589–607. [DOI] [PMC free article] [PubMed] [Google Scholar]
- Burton H,McLaren DG,Sinclair RJ( 2006): Reading embossed capital letters: A fMRI study in blind and sighted individuals. Hum Brain Mapp 27: 325–339. [DOI] [PMC free article] [PubMed] [Google Scholar]
- Ciccarelli O,Toosy AT,Hickman SJ,Parker GJ,Wheeler‐Kingshott CA,Miller DH,Thompson AJ( 2005): Optic radiation changes after optic neuritis detected by tractography‐based group mapping. Hum Brain Mapp 25: 308–316. [DOI] [PMC free article] [PubMed] [Google Scholar]
- Crair MC,Gillespie DC,Stryker MP( 1998): The role of visual experience in the development of columns in cat visual cortex. Science 279: 566–570. [DOI] [PMC free article] [PubMed] [Google Scholar]
- Foong J,Symms MR,Barker GJ,Maier M,Miller DH,Ron MA( 2002): Investigating regional white matter in schizophrenia using diffusion tensor imaging. Neuroreport 13: 333–336. [DOI] [PubMed] [Google Scholar]
- Genovese CR,Lazar NA,Nichols TE( 2002): Thresholding of statistical maps in functional neuroimaging using the false discovery rate. NeuroImage 15: 870–878. [DOI] [PubMed] [Google Scholar]
- Hasan KM( 2006): Diffusion tensor eigenvalues or both mean diffusivity and fractional anisotropy are required in quantitative clinical diffusion tensor MR reports: Fractional anisotropy alone is not sufficient. Radiology 239: 611–612. [DOI] [PubMed] [Google Scholar]
- Huppi PS,Warfield S,Kikinis R,Barnes PD,Zientara GP,Jolesz FA,Tsuji MK,Volpe JJ( 1998a): Quantitative magnetic resonance imaging of brain development in premature and mature newborns. Ann Neurol 43: 224–235. [DOI] [PubMed] [Google Scholar]
- Huppi PS,Maier SE,Peled S,Zientara GP,Barnes PD,Jolesz FA,Volpe JJ( 1998b): Microstructural development of human newborn cerebral white matter assessed in vivo by diffusion tensor magnetic resonance imaging. Pediatr Res 44: 584–590. [DOI] [PubMed] [Google Scholar]
- Jones DK,Symms MR,Cercignani M,Howard RJ( 2005): The effect of filter size on VBM analyses of DT‐MRI data. Neuroimage 26: 546–554. [DOI] [PubMed] [Google Scholar]
- Kanaan RA,Kim JS,Kaufmann WE,Pearlson GD,Barker GJ,McGuire PK( 2005): Diffusion tensor imaging in schizophrenia. Biol Psychiatry 58: 921–929. Review. [DOI] [PubMed] [Google Scholar]
- Kujala T,Palva MJ,Salonen O,Alku P,Huotilainen M,Jarvinen A,Naatanen R( 2005): The role of blind humans' visual cortex in auditory change detection. Neurosci Lett 379: 127–131. [DOI] [PubMed] [Google Scholar]
- Le Bihan D( 2003): Looking into the functional architecture of the brain with diffusion MRI. Nat Rev Neurosci 4: 469–480. Review. [DOI] [PubMed] [Google Scholar]
- Lin F,Yu C,Jiang T,Li K,Li X,Qin W,Sun H,Chan P( 2006): Quantitative analysis along the pyramidal tract by length‐normalized parameterization based on diffusion tensor tractography: Application to patients with relapsing neuromyelitis optica. Neuroimage 33: 154–160. [DOI] [PubMed] [Google Scholar]
- Medina D,DeToledo‐Morrell L,Urresta F,Gabrieli JD,Moseley M,Fleischman D,Bennett DA,Leurgans S,Turner DA,Stebbins GT( 2006): White matter changes in mild cognitive impairment and AD: A diffusion tensor imaging study. Neurobiol Aging 27: 663–672. [DOI] [PubMed] [Google Scholar]
- Mori S,Crain BJ,Chacko VP,van Zijl PC( 1999): Three‐dimensional tracking of axonal projections in the brain by magnetic resonance imaging. Ann Neurol 45: 265–269. [DOI] [PubMed] [Google Scholar]
- Mori S,Kaufmann WE,Davatzikos C,Stieltjes B,Amodei L,Fredericksen K,Pearlson GD,Melhem ER,Solaiyappan M,Raymond GV,Moser HW,van Zijl PC( 2002): Imaging cortical association tracts in the human brain using diffusion‐tensor‐based axonal tracking. Magn Reson Med 47: 215–223. [DOI] [PubMed] [Google Scholar]
- Mukherjee P,Miller JH,Shimony JS,Philip JV,Nehra D,Snyder AZ,Conturo TE,Neil JJ,McKinstry RC( 2002): Diffusion‐tensor MR imaging of gray and white matter development during normal human brain maturation. AJNR Am J Neuroradiol 23: 1445–1456. [PMC free article] [PubMed] [Google Scholar]
- Noppeney U,Friston KJ,Ashburner J,Frackowiak R,Price CJ( 2006): Early visual deprivation induces structural plasticity in gray and white matter. Curr Biol 15: R488–R490. [DOI] [PubMed] [Google Scholar]
- Oldfield RC( 1971): The assessment and analysis of handedness: The Edinburgh inventory. Neuropsychologia 9: 97–113. [DOI] [PubMed] [Google Scholar]
- Pierpaoli C,Basser PJ( 1996): Toward a quantitative assessment of diffusion anisotropy. Magn Reson Med 36: 893–906. [DOI] [PubMed] [Google Scholar]
- Pierpaoli C,Barnett A,Pajevic S,Chen R,Penix LR,Virta A,Basser P( 2001): Water diffusion changes in Wallerian degeneration and their dependence on white matter architecture. Neuroimage 13: 1174–1185. [DOI] [PubMed] [Google Scholar]
- Poirier C,Collignon O,Scheiber C,Renier L,Vanlierde A,Tranduy D,Veraart C,De Volder AG( 2006): Auditory motion perception activates visual motion areas in early blind subjects. Neuroimage 31: 279–285. [DOI] [PubMed] [Google Scholar]
- Rose SE,Chalk JB,Janke AL,Strudwick MW,Windus LC,Hannah DE,McGrath JJ,Pantelis C,Wood SJ,Mowry BJ( 2006): Evidence of altered prefrontal‐thalamic circuitry in schizophrenia: An optimized diffusion MRI study. Neuroimage 32: 16–22. [DOI] [PubMed] [Google Scholar]
- Sadato N,Pascual‐Leone A,Grafman J,Ibanez V,Deiber MP,Dold G,Hallett M( 1996): Activation of the primary visual cortex by Braille reading in blind subjects. Nature 380: 526–528. [DOI] [PubMed] [Google Scholar]
- Sadato N,Pascual‐Leone A,Grafman J,Deiber MP,Ibanez V,Hallett M( 1998): Neural networks for Braille reading by the blind. Brain 121(Part 7): 1213–1229. [DOI] [PubMed] [Google Scholar]
- Schoth F,Burgel U,Dorsch R,Reinges MH,Krings T( 2006): Diffusion tensor imaging in acquired blind humans. Neurosci Lett 398: 178–182. [DOI] [PubMed] [Google Scholar]
- Sengpiel F,Kind PC( 2002): The role of activity in development of the visual system. Curr Biol 12: 818–826. Review. [DOI] [PubMed] [Google Scholar]
- Shimony JS,Burton H,Epstein AA,McLaren DG,Sun SW,Snyder AZ( 2006): Diffusion tensor imaging reveals white matter reorganization in early blind humans. Cereb Cortex 16: 1653–1661. [DOI] [PMC free article] [PubMed] [Google Scholar]
- Smith SM,Jenkinson M,Johansen‐Berg H,Rueckert D,Nichols TE,Mackay CE,Watkins KE,Ciccarelli O,Cader MZ,Matthews PM,Behrens TE( 2006): Tract‐based spatial statistics: Voxelwise analysis of multi‐subject diffusion data. Neuroimage 31: 1487–1505. [DOI] [PubMed] [Google Scholar]
- Sur M,Leamey CA( 2001): Development and plasticity of cortical areas and networks. Nat Rev Neurosci 2: 251–262. Review. [DOI] [PubMed] [Google Scholar]
- Vangberg TR,Skranes J,Dale AM,Martinussen M,Brubakk AM,Haraldseth O( 2006): Changes in white matter diffusion anisotropy in adolescents born prematurely. Neuroimage 32: 1538–1548. [DOI] [PubMed] [Google Scholar]
- Yu C,Shu N,Li J,Qin W,Jiang T,Li K( 2007): Plasticity of the corticospinal tract in early blindness revealed by quantitative analysis of fractional anisotropy based on diffusion tensor tractography. Neuroimage 36: 411–417. [DOI] [PubMed] [Google Scholar]
- Yu CS,Lin FC,Li KC,Jiang TZ,Zhu CZ,Qin W,Sun H,Chan P( 2006): Diffusion tensor imaging in the assessment of normal‐appearing brain tissue damage in relapsing neuromyelitis optica. AJNR Am J Neuroradiol 27: 1009–1015. [PMC free article] [PubMed] [Google Scholar]