

Abstract
Emerging noninvasive neuroimaging techniques allow for the morphometric analysis of patterns of gray and white matter degeneration in vivo, which may help explain and predict the occurrence of cognitive impairment and Alzheimer's disease. A single center prospective follow‐up study (Radboud University Nijmegen Diffusion tensor and Magnetic resonance imaging Cohort study (RUN DMC)) was performed involving 503 nondemented elderly individuals (50–85 years) with a history of symptomatic cerebral small vessel disease (SVD). Age was associated with a global reduction in cortical thickness, and this relationship was strongest for ventrolateral prefrontal cortex, auditory cortex, Wernicke's area, superior temporal lobe, and primary visual cortex. Right and left hemispheres differed in the thickness of language‐related areas. White matter (WM) lesions were generally negatively correlated with cortical thickness, primarily in individuals over the age of 60, with the notable exception of Brodmann areas 4 and 5, which were positively correlated in age groups 50–60 and 60–70, respectively. The observed pattern of age‐related decline may explain problems in memory and executive functions, which are already well documented in individuals with SVD. The additional gray matter loss affecting visual and auditory cortex, and specifically the head region of primary motor cortex, may indicate morphological correlates of impaired sensory and motor functions. The paradoxical positive relationship between WM lesion volume and cortical thickness in some areas may reflect early compensatory hypertrophy. This study raises a further interest in the mechanisms underlying cerebral gray and white matter degeneration in association with SVD, which will require further investigation with diffusion weighted and longitudinal MR studies. Hum Brain Mapp, 2010. © 2010 Wiley‐Liss, Inc.
Keywords: cortical thickness, aging, degeneration, morphometry, white matter lesions, small vessel disease
INTRODUCTION
A common topic in the field of aging research is the effect of the aging process upon brain morphology. Of particular interest is the isolation of specific patterns of morphological alterations that accompany aging, and how these patterns relate to the broad array of physiological, behavioral, memory, and cognitive changes observed in this process, especially those deficits which may predict underlying pathology or degeneration [Grady, 2008].
Recent advances in MR imaging techniques have allowed for high‐resolution in vivo analysis of age‐related brain alterations. A number of studies have utilized voxel‐based morphometry (VBM) to investigate the effects of aging on cortical gray matter (GM) and white matter (WM) volume or density [see Ashburner and Friston, 2000; Wright et al., 1995], which generally report an age‐related decline in these measures [Brickman et al., 2007; Good et al., 2001a, b; Raz et al., 1997, 2004; Sowell et al., 2003; Xu et al., 2000]. However, no clear consensus on a pattern of localization appears to emerge from these reports. An alternative MR‐based morphometric approach is that of cortical GM thickness analysis, which is based upon a geometric approximation to the boundaries of cortical GM [Kim et al., 2005; Tosun et al., 2004]. At least two studies, utilizing this approach, report a pattern of age‐related cortical thinning, apparent from middle age [Hutton et al., 2009; Salat et al., 2004].
The relationship of GM thickness patterns to WM integrity is a question of much importance, given that the prevalence of some degree of WM lesions (WML) has been reported at 95% in people aged 60 to 90 years [de Leeuw et al., 2001]. Moreover, periventricular WML severity is related to a factor‐of‐three increase in the rate of general cognitive decline for this same age group [de Groot et al., 2002]. The relationship of WML to GM degeneration, however, is still poorly understood, particularly with respect to GM cortical thickness.
Cerebral microangiopathy, or cerebral small‐vessel disease (SVD), is a degeneration of small cerebral blood vessels, whose common risk factors are age, hypertension, and possibly genetic factors [de Leeuw et al., 2002; Launer, 2003]. SVD is a significant cause of age‐related cognitive impairment and dementia [O'Brien et al., 2003], as well as behavioral, psychological, and somatic neurological symptoms [reviewed in: Schmidtke and Hüll, 2005]. At least one study of elderly individuals (mean age 58 years) has demonstrated a general decrease in cortical thickness for subjects with SVD compared to age‐matched controls, which was associated with poorer neuropsychological performance [Preul et al., 2005]. However, many questions remain about SVD, including its rate of progression and its detailed relationship to factors such as WM and GM morphology.
This study investigates the effects of aging and incidental WML upon cortical GM thickness in a large population of elderly adults with symptomatic SVD. Using cortical thickness and volumetric methods, we intend to address the following questions. First, how is the effect of aging upon cortical GM thickness distributed across the cerebral cortex in individuals from our cohort? Second, do sex differences in cortical morphology exist for our population, and do age‐ and SVD‐related changes in morphology differ between males and females? Third, does cortical thickness exhibit patterns of interhemispheric asymmetry, and how does such asymmetry interact with age? Finally, how is cortical GM thickness related to the extent of WM degeneration, and how is this pattern distributed?
MATERIALS AND METHODS
Subjects
This study is based upon the Radboud University Nijmegen Diffusion tensor and Magnetic resonance imaging Cohort study (RUN DMC), a single‐center prospective follow‐up study involving 503 participants (284 male, 219 female; 50–85 years; response rate 71.3%). None of the participants suffered from dementia on the basis of international diagnostic criteria, but have a history of symptomatic SVD [see Van Norden et al., 2008]. Eighteen subjects (3.5%) were excluded from the present analysis due to failures in the cortical surface generation process. Table I shows the demographics for the RUN DMC cohort.
Table I.
Demographic information for the study population
| Male (n = 270) | Female (n = 215) | |||||
|---|---|---|---|---|---|---|
| Age decade | 50–60 (n = 89) | 60–70 (n = 81) | 70–85 (n = 100) | 50–60 (n = 69) | 60–70 (n = 77) | 70–85 (n = 69) |
| Age at disease onset (years) | 54.6 (3.0) | 63.3 (3.1) | 73.9 (3.7) | 53.7 (2.9) | 63.9 (3.2) | 74.1 (3.8) |
| Disease duration (years) | 1.2 (1.1) | 1.3 (1.1) | 1.2 (0.9) | 1.7 (1.3) | 1.4 (1.2) | 1.7 (1.2) |
| Age at study participation (years) | 55.8 (2.8) | 64.7 (2.8) | 75.0 (3.5) | 55.4 (2.8) | 65.3 (2.9) | 75.8 (3.7) |
| MMSE | 28.6 (1.4) | 28.3 (1.4) | 27.5 (1.9) | 28.8 (1.3) | 28.2 (1.5) | 27.4 (1.7) |
| Education level | 5.3 (1.2) | 5.1 (1.3) | 4.7 (1.7) | 5.0 (1.0) | 4.5 (1.2) | 4.1 (1.5) |
| WML volume (ml) | 6.6 (7.0) | 13.6 (18.0) | 25.9 (25.1) | 8.3 (13.1) | 14.7 (21.6) | 20.7 (15.2) |
Numbers represent means (SD). MMSE, mini mental state examination. Educational levels range from 1–7: 1 representing less than primary school and 7 reflecting an academic degree (Hochstenbach et al., 1998).
MRI Acquisition
Imaging was performed on a 1.5 Tesla scanner (Magnetom Avanto, Siemens Medical Solutions, Erlangen, Germany) at the Donders Center for Cognitive Neuroimaging. The protocol included T1 3D MPRAGE acquisitions (TR/TE/TI 2250/3.68/850 ms; flip angle 15°; voxel size 1.0 × 1.0 × 1.0 mm), which are used for all cortical modeling analyses reported in this study, and Fluid‐Attenuated Inversion Recovery (FLAIR) acquisitions (TR/TE/TI 9000/84/2200 ms; voxel size 1.0 × 1.2 × 6.0 mm (including an interslice gap of 1 mm), which are used for WML volumetry.
White Matter Lesion Volume Estimation
WM lesions were manually segmented on transversal FLAIR images. WML were defined as hyperintense lesions on FLAIR with no corresponding cerebrospinal fluid‐ (CSF‐)like hypointensity on the T1‐weighted image. Because of the manual segmentation, WML could easily be differentiated from Virchow‐Robin Spaces as the latter structures are hypointense on both T1 and FLAIR imaging [Kwee and Kwee, 2005]. Two trained raters, blind to all clinical information, segmented all scans. WML volume (WMLV) was calculated as lesion surface by slice thickness and is reported in ml. Inter‐rater variability was determined in a random sample of 10% and yielded an intraclass correlation coefficient of 0.99 for total WMLV. Gliosis surrounding lacunar and territorial infarctions was not considered to be WML. Virchow‐Robin Spaces were hypointense areas on T1 and FLAIR imaging without surrounding gliosis and not taken into account in the analysis of the WML. Mutual information rigid body coregistration (SPM5, Wellcome Department of Cognitive Neurology, University College London, UK) was used to align WML images with T1 images. A Talairach‐based lobar atlas [Maldjian et al., 2003; WFU Pickatlas, v2.3] was registered to T1 images in SPM, using a nonlinear transformation.
Cortical Thickness Measurement
Cortical thickness (Thickness) analysis was performed using the CIVET pipeline. In brief, native MR images were registered into stereotaxic (MNI) space using a 9‐parameter linear transformation [Collins et al., 1994], corrected for nonuniformity [Sled et al., 1998], and segmented into background mask, WM, GM, and CSF [Zijdenbos et al., 2002]. The boundaries between GM/CSF and WM/GM were then approximated using an algorithm called Constrained Laplacian Automated Segmentation with Proximities (CLASP) [Kim et al., 2005; MacDonald et al., 2000], and cortical thickness was measured as the distance, in native space, along the links between corresponding vertices created in this process (t‐link). The resulting surface meshes contained 40,962 vertices per hemisphere. Finally, individual surface meshes were resampled to a template surface, obtained using an iterative group template registration algorithm [Lyttelton et al., 2007], to facilitate intersubject comparisons. We used the middle‐cortex surface obtained from this process to calculate two further measures: (1) cortical surface area (Asurf), calculated as the sum of areas of the triangular faces; and (2) cortical GM volume (Vsurf), calculated as the sum over each face of its area multiplied by its average vertex‐wise thickness value.
Anatomical Parcellation
Surfaces were parcellated into 41 Brodmann areas per hemisphere by applying a landmark‐based deformation map using Caret software [Van Essen et al., 2001] (Fig. 1A). This procedure effectively warps and resamples the Brodmann parcellation from the Population‐Average, Landmark‐, and Surface‐based atlas representation (PALS) [Van Essen, 2005] to the group template surface mesh used in the CIVET pipeline. Brodmann areas are herein referred to synonymously as GM regions‐of‐interest (GM ROIs), and a single GM ROI is referred to with the prefix “BA” followed by its number.
Figure 1.
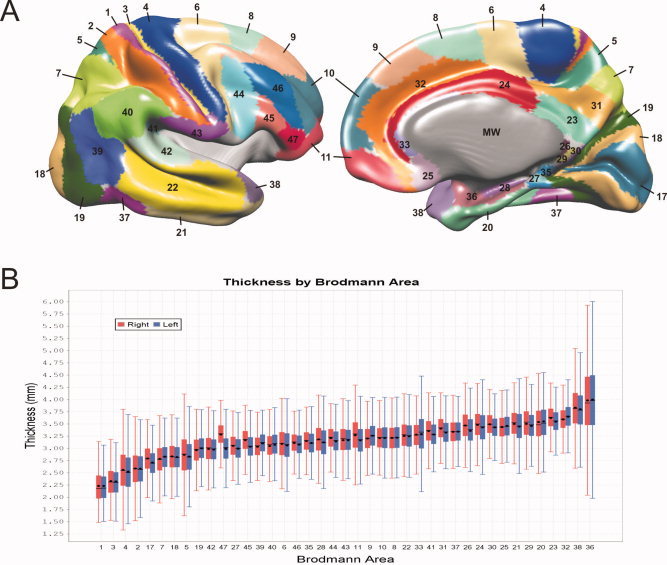
Cortical grey matter regions of interest (GM ROIs). A: Parcellation of the cortical surface into Brodmann areas. Grey areas are not analyzed in the present study, and include the medial wall (MW), which is artificially created by the surface extraction process, and the insula region. B: Boxplots of Thickness for each Brodmann area ROI, showing the distributions for both hemispheres. ROIs are sorted by increasing mean Thickness. Filled boxes represent quartiles 1 to 3, capped lines indicate the range of regular values, circles indicate the mean, and horizontal lines indicate the median.
Statistical Analysis
Statistical analyses were performed using the SurfStat Matlab library and SPSS 16.0, as follows. Mean statistics were obtained for the model Thickness ∼ Age + Sex + Age × Sex for both hemispheres. The models Asurf ∼ Age + Sex + Age × Sex, Asurf ∼ Hemisphere, Vsurf ∼ Age + Sex + Age × Sex, and Vsurf ∼ Hemisphere were also analyzed (see Supporting Information). Vertex‐wise statistics were computed as individual linear models (Thickness ∼ Age + Sex + Age × Sex) for each of 40,962 vertices per hemisphere. To indicate effect size, they are represented here as significant slope values, such that all nonsignificant slopes (P < 0.05) are set to zero. Corrected P statistics are obtained for these vertices using random field theory [Worsley, 2005; Worsley et al., 1999].
ROI‐based analysis of Age, Sex, and Hemisphere effects were performed by computing individual linear models for the mean of the subset of vertices in a given GM ROI (Thickness ∼ Age + Sex + Age × Sex; Thickness ∼ Age × Hemisphere; and Thickness ∼ Hemisphere). Significance thresholds were corrected for multiple comparisons (family‐wise error, FWE) using the Holm‐Bonferroni method. We further analyzed WML effects by testing the model Thickness ∼ Age + WMLV + Age × WMLV for individual GM ROIs. Given our subsequent findings that GM ROI‐wise WMLV was not significantly related to Thickness after Age was included as a factor, we decided to further investigate the relationship between WMLV and Thickness in three separate age groups: 50–60, 60–70, and 70+. Because WMLV is bound by zero, and consequently has a large positive skew, we applied a log transformation to these data, resulting in a bivariate normal distribution, which is necessary for a linear regression analysis. To plot the results for each group, we standardized the slope values to the statistics of the entire population. Significance was assessed using both P‐ and q‐values [false discovery rate, FDR; see Storey, 2002] to account for FWE.
RESULTS
Cortical Thickness
Figure 1B illustrates the distribution of mean Thickness in terms of the Brodmann area parcellation. BA1 and BA3 were thinnest (∼2 mm), whereas BA38 and BA36 were thickest (∼3.75). Vertex‐wise mean Thickness was also spatially distributed in a nonuniform manner (Fig. 2A). Primary motor and somatosensory cortices were thinnest (∼2 mm), whereas temporal pole and medial temporal lobe were thickest (∼4 mm or thicker). Thickness variance was also spatially distributed somewhat nonuniformly, with standard deviation being highest (∼0.2 mm) in the perirhinal region and moderately high (∼0.15 mm) in the primary motor and somatosensory cortices as well as the temporal pole. Analysis of hemispheric differences showed a significant difference in mean Thickness (right > left) (t = −9.40, P < 0.01), and significant hemispheric asymmetry in 28 Brodmann areas (Table II). The largest differences were found in the lateral prefrontal areas BA47 (Fig. 2D), BA11, and BA45, in which the right hemisphere was thicker than the left.
Figure 2.
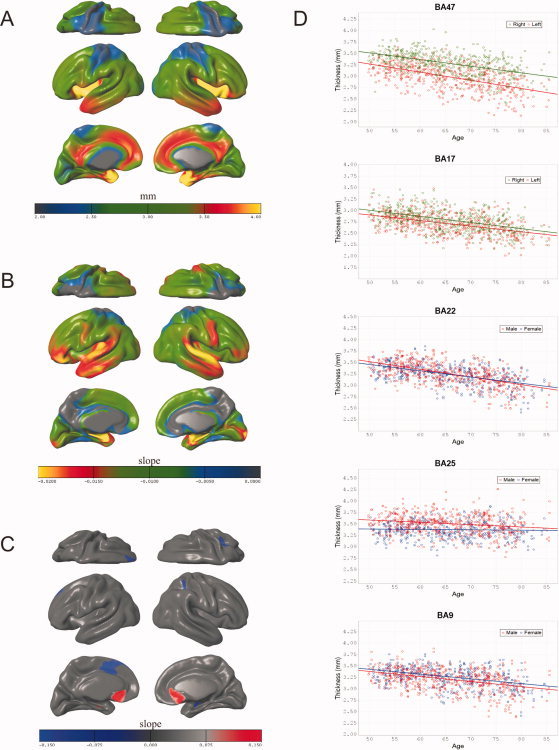
Three‐dimensional renderings of vertex‐wise values mapped onto the average surface and scatterplots of individual Brodmann area ROIs. A: Spatial distribution of vertex‐wise mean. Thickness in mm. B: Spatial distribution of the slope for Age in each vertex‐wise linear model of the form Thickness ∼ Age + Sex + Age × Sex. C: Spatial distribution of the slope for Sex (Male–Female) in the model Thickness ∼ Age + Sex; a positive (red) value corresponds to Male > Female. D: Scatterplots of Age versus mean Thickness for five Brodmann areas.
Table II.
Result of BA‐wise statistical analysis
| ROI | Asymmetrya (mm) | T‐values | |||||||||||
|---|---|---|---|---|---|---|---|---|---|---|---|---|---|
| Age | Sexc | Age × Sexd | WML | Age × WML | Left | Right | |||||||
| Asymmetry | Age × Hemisphereb | Left | Right | Left | Right | Left | Right | Left | Right | ||||
| BA1 | 0.00 | 0.08 | 0.54 | −4.63e | −4.63e | −0.32 | −0.95 | 0.18 | 0.76 | 1.26 | 1.69 | −1.00 | −1.48 |
| BA2 | 0.00 | −0.81 | 0.73 | −4.68e | −5.17e | 0.36 | 0.34 | −0.54 | −0.59 | 1.54 | 1.48 | −1.49 | −1.43 |
| BA3 | 0.01 | −1.24 | 0.52 | −5.19e | −4.69e | −0.18 | −0.39 | 0.06 | 0.26 | 1.52 | 2.47 | −1.26 | −2.28 |
| BA4 | 0.03 (R>L) | −6.05e | 0.80 | −4.86e | −4.26e | −0.51 | −0.88 | 0.37 | 0.79 | 1.97 | 2.85 | −1.59 | −2.60 |
| BA5 | 0.04 (R>L) | −5.67e | −0.55 | −2.39e | −2.34f | −1.79 | −1.31 | 1.66 | 1.22 | 2.28 | 1.74 | −1.89 | −1.40 |
| BA6 | 0.03 (R>L) | −6.19 | −1.67 | −6.38e | −5.33e | 0.03 | −0.52 | −0.24 | 0.36 | 1.71 | 2.05 | −1.66 | −2.07 |
| BA7 | 0.05 (L>R) | 8.48e | −0.05 | −3.41e | −3.75e | −0.67 | −0.77 | 0.60 | 0.60 | 2.20 | 1.94 | −2.08 | −1.85 |
| BA8 | 0.00 | 0.75 | −1.26 | −5.92e | −5.04e | −0.67 | −0.97 | 0.33 | 0.83 | 1.63 | 2.18 | −1.54 | −2.21 |
| BA9 | 0.06 (L<R) | 10.82e | −1.64 | −5.78e | −4.88e | −0.54 | −0.53 | 0.17 | 0.17 | 1.66 | 1.45 | −1.89 | −1.79 |
| BA10 | 0.00 | 0.32 | −1.16 | −6.06e | −5.91e | 0.75 | −0.22 | −0.78 | 0.11 | 1.54 | 1.22 | −2.09 | −1.79 |
| BA11 | 0.11 (R>L) | −22.09e | −4.07e (L>R) | −6.11f | −4.34e | 1.78 | 0.92 | −1.50 | −0.78 | 0.91 | 1.47 | −1.41 | −1.96 |
| BA17 | 0.09 (R>L) | −14.18e | 1.54 | −8.22e | −8.42e | 0.04 | 0.49 | −0.03 | −0.46 | 0.22 | 0.08 | −0.26 | −0.32 |
| BA18 | 0.01 | −2.03 | −0.40 | −7.47e | −6.74e | −0.13 | 0.37 | 0.25 | −0.29 | 1.21 | 1.46 | −1.12 | −1.47 |
| BA19 | 0.04 (L>R) | 8.09e | 0.76 | −5.63e | −5.96e | −0.18 | 0.63 | 0.39 | −0.39 | 1.77 | 2.00 | −1.82 | −2.12 |
| BA20 | 0.01 | 2.22 | −1.59 | −7.11e | −6.37e | 2.00 | 1.43 | −1.93 | −1.33 | 0.32 | 0.70 | −0.54 | −0.86 |
| BA21 | 0.05 (R>L) | −7.05e | −3.42f (L>R) | −8.15e | −6.49e | 1.80 | 1.33 | −1.60 | −1.23 | 0.77 | 1.90 | −0.93 | −2.12 |
| BA22 | 0.01 | −1.38 | −1.42 | −9.81e | −8.62e | 1.55 | 0.99 | −1.44 | −0.87 | 0.27 | 0.92 | −0.74 | −1.27 |
| BA23 | 0.08 (R>L) | −10.08e | 0.10 | −0.96e | −0.16e | 2.37 | 2.22 | −2.09 | −1.90 | −0.37 | 0.49 | −0.29 | −1.21 |
| BA24 | 0.05 (R>L) | −6.97e | −2.70 | −2.47e | −1.36e | 1.43 | 1.81 | −1.45 | −1.63 | 0.95 | 0.28 | −1.28 | −0.58 |
| BA25 | 0.02 (L>R) | 3.18f | −2.51 | −1.91e | 0.48 | 2.10 | 2.94 | −1.10 | −2.01 | 0.19 | 0.80 | −0.44 | −1.26 |
| BA26 | 0.11 (R>L) | −8.20e | 0.49 | −0.64f | −0.30e | 2.18 | 2.80 | −1.93 | −2.43 | 0.63 | 1.73 | −0.98 | −2.23 |
| BA27 | 0.06 (R>L) | −6.52e | −0.12 | −2.64e | −2.48e | 2.18 | 1.80 | −1.90 | −1.44 | 0.76 | 1.64 | −1.03 | −1.91 |
| BA28 | 0.06 (R>L) | −5.59e | 0.92 | −10.80e | −9.49e | 2.05 | 1.13 | −1.96 | −1.09 | −2.07 | −0.24 | 1.92 | −0.10 |
| BA29 | 0.04 (R>L) | −4.10 | 2.42 | 0.14 | −0.86e | 1.27 | 2.40 | −0.93 | −2.08 | 0.86 | 1.74 | −1.27 | −2.24 |
| BA30 | 0.06 (R>L) | −7.86e | 4.18e (R>L) | −0.36f | −1.92e | 0.35 | 2.29 | −0.03 | −2.00 | 1.45 | 1.99 | −1.77 | −2.54 |
| BA31 | 0.08 (R>L) | −14.59e | −0.71 | −1.76e | −1.28e | −0.07 | 1.10 | 0.13 | −1.01 | 0.99 | 0.81 | −1.12 | −1.04 |
| BA32 | 0.06 (L>R) | 9.09e | −1.10 | −3.3e | −3.47e | 1.76 | 1.23 | −1.89 | −1.40 | 1.56 | 0.94 | −2.10 | −1.43 |
| BA33 | 0.01 | 0.76 | −2.06 | −0.52 | 0.62 | 0.34 | 1.52 | −0.06 | −0.95 | 0.48 | 0.11 | −0.68 | −0.20 |
| BA35 | 0.04 (R>L) | −6.14e | 0.63 | −2.67e | −3.08e | 2.42 | 1.59 | −2.16 | −1.43 | 1.20 | 1.52 | −1.56 | −1.86 |
| BA36 | 0.02 | 1.46 | −1.69 | −9.84e | −7.88e | 2.23 | 2.29 | −1.96 | −2.26 | −0.35 | 0.35 | 0.15 | −0.56 |
| BA37 | 0.00 | 0.52 | −1.22 | −4.55e | −5.03e | 0.63 | 1.07 | −0.48 | −0.81 | 1.02 | 0.29 | −1.33 | 0.48 |
| BA38 | 0.03 (R>L) | −3.83e | −1.90 | −8.42e | −7.20e | 1.82 | 1.55 | −1.60 | −1.42 | 0.24 | 0.52 | −0.49 | −0.72 |
| BA39 | 0.07 (L>R) | 10.79e | −1.43 | −6.13e | −5.66e | 0.39 | 0.94 | −0.46 | −0.86 | 0.51 | 1.14 | −0.94 | −1.40 |
| BA40 | 0.02 (L>R) | 3.47e | −1.21 | −6.30e | −6.30e | 1.21 | 0.81 | −1.41 | −0.86 | 0.56 | 0.76 | −1.11 | −1.19 |
| BA41 | 0.07 (R>L) | −10.28e | −1.49 | −6.59e | −5.62e | 2.52 | 1.93 | −2.56 | −1.72 | −0.02 | 1.21 | −0.79 | −1.61 |
| BA42 | 0.02 | −2.19 | 0.32 | −9.94e | −10.16e | 2.08 | 1.97 | −1.98 | −1.88 | −0.37 | −0.70 | −0.37 | 0.20 |
| BA43 | 0.00 | −0.64 | 1.43 | −6.02e | −6.44e | 1.63 | 1.04 | −1.43 | −0.88 | −0.34 | 0.02 | −0.06 | −0.39 |
| BA44 | 0.07 (R>L) | −9.41e | −1.54 | −5.97e | −4.18e | −0.20 | −0.12 | 0.25 | 0.17 | 0.82 | 1.14 | −1.19 | −1.66 |
| BA45 | 0.14 (R>L) | −16.74e | −3.17 | −7.02e | −4.96e | −0.27 | 0.20 | 0.39 | −0.03 | 1.24 | 0.37 | −1.73 | −0.96 |
| BA46 | 0.03 (R>L) | −5.56e | −2.67 | −7.13e | −6.16e | 0.06 | 0.04 | −0.10 | −0.06 | 1.21 | 0.22 | −1.56 | −0.69 |
| BA47 | 0.29 (R>L) | −32.81e | −3.18 | −8.84e | −8.00e | 0.81 | −0.36 | −0.88 | 0.59 | 0.92 | 0.13 | −1.43 | −0.68 |
Indicate the thicker hemisphere and mean interhemispheric difference in mm.
Indicates the hemisphere in which the age effect is stronger.
For a male‐female comparison; a positive t‐score indicates male thicker than female.
For a male‐female comparison; a positive t‐score indicates that the age effect is stronger for males than females.
Significant at the α = 0.01 level (corrected for multiple comparisons).
Significant at the α = 0.05 level (corrected for multiple comparisons).
Age
There was a significant mean negative effect of Age on Thickness, for both left (t = −13.16, P < 0.01, R2adj = 0.262) and right (t = −12.73, P < 0.01, R2adj = 0.244, and slope = −0.010) hemispheres. The results of vertex‐wise analyses illustrate the spatial distribution of the slope for Age in this model (Fig. 2B): most of the cortical sheet showed significant decrease with Age, with the greatest effects apparent in the ventrolateral prefrontal cortex (BA45, BA46, and BA47), the primary and secondary auditory cortices (BA41, BA42), Wernicke's area (BA22), medial temporal lobe (BA36, BA28, excluding the hippocampal formation and amygdala), and the primary visual cortex. Analysis of Brodmann ROIs further elucidates this distribution (Table II). In three Brodmann areas (BA11, BA21, and BA30), the effect of Age on Thickness was asymmetrical, as indicated by a significant Age × Hemisphere interaction (Table II). There were no significant mean, vertex‐wise, or ROI‐wise quadratic effects of Age on Thickness.
Sex
There was no significant mean effect of Sex on Thickness for either hemisphere. Vertex‐wise analyses highlight some regions where a moderate Sex effect was apparent. After P‐value correction, these effects were not significant; however, when the interaction term was removed a pattern of significance was observed bilaterally in the subgenual area (BA25) (Male > Female) and in the left anterior cingulate (BA32) (Female > Male) (Fig. 2C). Analyses of Brodmann area ROIs did not result in any significant ROI‐wise effects of Sex, after correction for multiple comparisons (Table II). There was neither significant mean interaction effect of Age × Sex on Thickness nor any pattern of significant vertex‐wise or ROI‐wise interaction effects (Table II).
White Matter Lesions
No significant ROI‐wise effects were found after correction for multiple comparisons, for either WML or Age × WMLV, in the model Thickness ∼ Age + WMLV + Age × WMLV. To further investigate this relationship, we split the cohort into three age groups: 50–60, 60–70, and 70+, and tested the linear model Thickness ∼ log(WMLV) for each. As Figure 3 shows, 8 BAs show significant negative correlations in the 50–60 group (P < 0.05, q < 0.05), 28 BAs in the 60–70 group, and 27 BAs in the 70+ group. BA4 shows a significant positive correlation for the 50–60 age group as does BA5 for the 60–70 age group.
Figure 3.
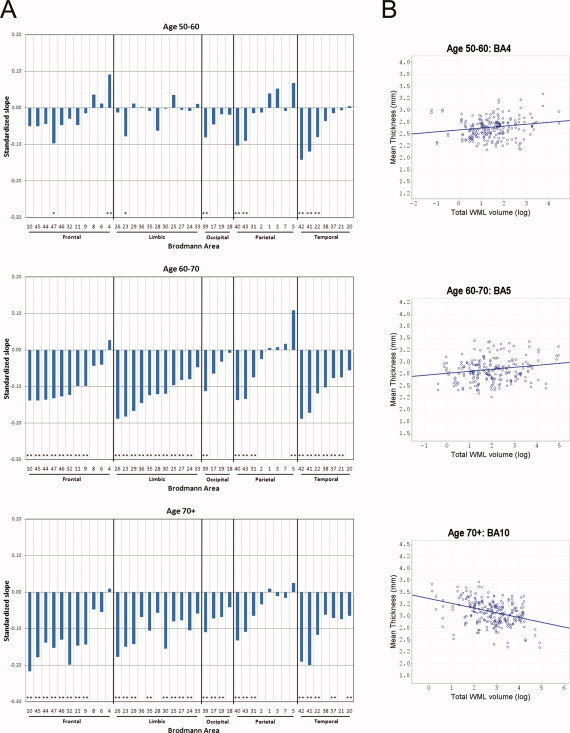
A: Bar plots showing the slope, standardized to the first‐order population statistics, for total WMLV in individual GM ROI‐wise linear regression models of the form Thickness ∼ log(WMLV). Analyses were performed over three age groups: 50–60, 60–70, and 70+. Model significance, accounting for FDR, is represented with asterisks (* indicates P < 0.05, q < 0.05; ** indicates P < 0.05, q < 0.01). For each lobe, BAs are sorted by the slope values from the 60–70 group. B: Selected scatterplots with linear regression lines for each age group, showing mean ROI‐wise cortical thickness versus log(WMLV) for BA4 and BA5 (positive), and BA10 (negative). [Color figure can be viewed in the online issue, which is available at wileyonlinelibrary.com.]
DISCUSSION
Distribution of Cortical Thickness
Cortical thickness has a distinct heterogeneous distribution across the cortex in our population, which is illustrated in Figures 1B and 2A. Superior primary motor and sensory areas are comparatively thin (2.0 to 2.5 mm), and the temporal pole and medial temporal cortex are comparatively thick (3.5–4.0 mm). BA36 has a particularly high mean thickness as well as a wide variance, with values as high as 6 mm (Fig. 1). While BA36 is indeed a thicker region, it is conceivable that, given its convoluted structure and the poor contrast of tissue types in this region (see Supporting Information Fig. 2), some of its variance is attributable to measurement artifact. For the rest of the brain, however, the distribution of thickness values seems reasonable, and similar to that reported in at least one study [Hutton et al., 2009], albeit globally higher than values reported in another [Salat et al., 2004].
Age‐ and SVD‐Related Cortical Thinning
We show that cortical thickness decreases with aging across most of the cortical sheet among elderly individuals with symptomatic SVD. As Figure 2 illustrates, the largest decreases in thickness were observed in the ventrolateral prefrontal cortex, the primary and secondary auditory cortex, Wernicke's area, the medial temporal lobe, and the primary visual cortex. Interestingly, the age effect in primary visual cortex is focused in the posterior region, which corresponds to foveal innervations [Wandell, 1999]. This distribution is comparable to that of GM density reported by Good et al. [ 2001b], but differ notably from those reported by Salat et al. [ 2004], who show a cortical thinning pattern that is predominant in primary motor cortex, where we find only a moderate significant effect, and apparent sparing of the ventrolateral prefrontal and temporal cortices, where we find the largest age effects. One possible explanation for this discrepancy is that these authors investigated a population with a much larger age range (18 to 93) than in this study. This would suggest that cortical thinning with age is a nonlinear effect with respect to the entire human lifespan, a possibility which is supported by at least one study of GM density [Sowell et al., 2003]. A second possible source of discrepancy is the different exclusionary criteria applied to both cohorts. The observed differences in cortical thinning may be partly attributable to a higher incidence of symptomatic SVD, which was excluded as a factor from the Salat et al. 2004 study, although SVD was also present in this cohort (personal correspondence). Given the strong relationship between age and SVD, and its high prevalence, it is difficult to disentangle these two factors. Preul et al. [ 2005] report a decreased mean cortical thickness in people with SVD versus age‐matched controls, but the distribution of this effect across the cortical sheet has not been investigated.
The observed age‐related GM atrophy of primary auditory and visual cortices is particularly interesting since it may represent a morphometric correlate to the hearing and vision deficits commonly encountered in old age. While primary somatosensory cortex appears to be relatively spared, the moderate thinning of inferior parts of motor cortex predict a degree of motor deficits, particularly in head motion. Although this study does not include the hippocampal formation or amygdala, we have reported separately that age‐related subjective cognitive failures are negatively related to hippocampal volume [Van Norden et al., 2008], which may be closely associated with the preferential thinning of medial temporal cortex observed here. We also find age‐related atrophy of lateral prefrontal cortex, which has been noted in a number of VBM‐based studies of brain morphology [Good et al., 2001b; Raz et al., 2004; Sowell et al., 2003]. Functionally, this atrophy may be related to reports that performance on two cognitive inhibition tasks presumed to require executive control, Stroop interference and stop signal responsiveness, significantly decrease with age, whereas performance on a nonexecutive cognitive inhibition task does not show a similar decrease [Andrés et al., 2008].
White Matter Lesions
WMLV does not appear to have a substantial relationship with GM thickness after accounting for age (Table II). However, since WM lesions become more probable with age [de Leeuw et al., 2001], it is still interesting to investigate the relationship of WMLV with cortical thickness across age groups. The results illustrated in Figure 3 suggest that in the 50–60 age group, this relationship is minor, with only 8 BAs showing significant negative correlations. In the two older age groups, however, we find a substantial and nonuniform increase in negative correlations, indicating a tighter coupling between these two forms of degeneration in individuals over 60. The strongest of these relationships is found in structures associated with executive function (BA10), speech production (BAs 44 and 45, or Broca's area), emotionality (BAs comprising cingulate cortex), and auditory processing (BAs 41 and 42). Interestingly, we also find a positive correlation in the younger age group for BA4, and in the middle age group for BA5. At first glance, such positive relationships appear counterintuitive, but may implicate a stable compensatory mechanism in response to a compromised network, which disappears as the brain degenerates further. Compensatory hyperactivation has been shown in the prefrontal cortex of Alzheimer patients [Grady et al., 2001], and an increased superior prefrontal GM volume corresponding to decreased cognitive performance has also been reported [Salat et al., 2002]. However, the functional implications of hypertrophy in BA4 (primary motor cortex), or BA5 (a secondary somatosensory area), are unclear.
CONCLUSIONS AND FUTURE PERSPECTIVES
This study is unique in that it utilizes a large sample size with a high response, and imaging data collected in a single center, using a single scanner and identical acquisition protocols. The morphometric estimates of GM cortical thickness and WMLV are derived from established, well‐documented procedures, which provide a more sensitive measure of age‐related changes than many previous approaches. Furthermore, the use of surface‐based cortical parcellation into Brodmann areas permits a more detailed anatomical reference set. Our results suggest that while aging has a virtually global negative effect upon this measure, this reduced thickness has a distinct pattern of preference which includes primary auditory and visual cortices. This finding suggests that age‐related changes in brain morphology occur in regions mediating early sensory processing, in addition to those mediating higher‐level cognitive functions. The relationship of WM degeneration to changes in cortical GM thickness is potentially informative about network alterations underlying age‐ and SVD‐related neural changes, but can only be highlighted by the present correlative morphological investigation. While WMLV was related to thinner cortex in most areas, two Brodmann areas in frontal and parietal cortex exhibit apparent cortical thickening. The mechanisms underlying this counterintuitive result remain an open question, but further studies including longitudinal data and diffusion‐weighted imaging will help address these issues more directly.
Supporting information
Additional Supporting Information may be found in the online version of this article.
Supplemental Figure 1. Population‐average cortical surface parcellations, such as the Brodmann parcellation used in this study, utilize landmarks such as prominent sulci and gyri to localize cortical areas. This suffers from the limitation that not all areas have a tight correspondence to such landmarks (see for instance Amunts et al., 2004). To test the sensitivity of Brodmann area boundaries to the mean cortical thickness values analyzed in this study, we assigned weights to vertices under the assumption that central vertices are more probably belong to an area than boundary vertices. To do this we used two weighting functions: a linear weighting such that central nodes are 1.0 and boundary nodes are 0.0, and a Gaussian weighting such that central nodes are 1.0 and sigma equals half the distance to the boundary vertices. The resulting weighting functions are illustrated in the 3D renderings, shown next to the Brodmann parcellation. This figure shows that in both conditions, the impact of weighting upon both mean thickness and its standard deviation is quite small, the largest differences being BA24, BA29, and BA33, each approximately 0.1 mm.
Supplemental Figure 2. Two‐ and three‐dimensional renderings from a randomly selected subject illustrating the location of BA36 on the cortex. The 3D rendering shows the GM/WM and CM/CSF boundary surfaces, cropped at 3 mm to either side of the horizontal plane. The 2D section renderings show the surface with respect to the T1‐weighted image. Red demarcates the location of BA36 on these surfaces. Notably, the cortical sheet in this region is quite convoluted, and varies from thick to narrow across its length. Moreover, it is apparent that the tissue classification in this region is relatively difficult, given its proximity to underlying subcortical grey matter. These factors may contribute to the comparatively high variation observed in this area.
Supplemental Figure 3. Two‐ and three‐dimensional renderings from a randomly selected subject illustrating the location of BA38 on the cortex (compare with BA36). While BA38 is a neighbour of BA36, it appears to be in a less convoluted region of cortex, has a fairly consistent thickness across its length, and is located in a region where tissue classification is less difficult.
Supplemental Figure 4. Three‐dimensional surface renderings of the mean cortical surface used to display results in this article (green), and the template surface obtained through iterative group registration (grey) (Lyttelton et al., 2007) which was used to co‐register cortical surfaces across subjects in this study.
Supplemental Figure 5. Boxplots of Thickness for each Brodmann area ROI, showing the distributions for both hemispheres. ROIs are sorted by lobe, then by increasing mean Thickness. Filled boxes represent quartiles 1 to 3, capped lines indicate the range of regular values, circles indicate the mean, and horizontal lines indicate the median.
Supplemental Video 1. Three‐dimensional video renderings of the middle cortical surface. The colour mapping depicts the standardized slope for each Brodmann area, obtained from the linear model Thickness ∼ WMLV, across three age groups, independently for each hemisphere (compare with Figure 3). At top right, a “glass” brain is shown, containing the thresholded WML probability distribution for the entire population.
Supplemental Video 2. The slope of Age as a factor in the vertex‐wise model Thickness ∼ Age + Sex + Age * Sex was clustered in Matlab using a k‐means clustering method. The resulting seven clusters are illustrated in a 3D video rendering. The rendering on the left of the video shows the clusters distributed across the cortical surface; the rendering on the right shows the mean slope of the Age effect for each cluster.
Supplemental Video 3. To better characterize the spatial distribution of the Age effect, the slope of Age as a factor in the GM ROI‐wise model Thickness ∼ Age + Sex + Age * Sex was clustered into six clusters in Matlab using a hierarchical clustering method. The resulting clusters are illustrated in a 3D video rendering. The rendering on the left of the video shows the clusters distributed across the cortical surface; the rendering on the right shows the slope of the Age effect for each cluster, averaged across the BAs in that cluster.
Supplemental Table 1: Cortical surface area and volume estimates.
Acknowledgements
The authors are grateful for the support and advice of Claude Lepage, Jason Lerch, and Keith Worsley (Montreal Neurological Institute), David Van Essen and Donna Dierker (Washington University in St. Louis), and David Norris (Radboud University Nijmegen Medical Center).
REFERENCES
- Andrés P, Guerrini C, Phillips LH, Perfect TJ ( 2008): Differential effects of aging on executive and automatic inhibition. Dev Neuropsychol 33: 101–123. [DOI] [PubMed] [Google Scholar]
- Ashburner J, Friston KJ ( 2000): Voxel‐based morphometry—The methods. Neuroimage 11( 6 Part 1): 805–821; (review). [DOI] [PubMed] [Google Scholar]
- Brickman AM, Habeck C, Ramos MA, Scarmeas N, Stern Y ( 2007): Structural MRI covariance patterns associated with normal aging and neuropsychological functioning. Neurobiol Aging 28: 284–295. [DOI] [PubMed] [Google Scholar]
- Collins DL, Neelin P, Peters TM, Evans AC ( 1994): Automatic 3D intersubject registration of MR volumetric data in standardized Talairach space. J Comput Assist Tomogr 18: 192–205. [PubMed] [Google Scholar]
- de Groot JC, de Leeuw FE, Oudkerk M, van Gijn J, Hofman A, Jolles J, Breteler MM ( 2002): Periventricular cerebral white matter lesions predict rate of cognitive decline. Ann Neurol 52: 335–341. [DOI] [PubMed] [Google Scholar]
- de Leeuw FE, de Groot JC, Achten E, Oudkerk M, Ramos LM, Heijboer R, Hofman A, Jolles J, van Gijn J, Breteler MM ( 2001): Prevalence of cerebral white matter lesions in elderly people: A population based magnetic resonance imaging study. The Rotterdam Scan Study. J Neurol Neurosurg Psychiatry 70: 9–14. [DOI] [PMC free article] [PubMed] [Google Scholar]
- de Leeuw FE, de Groot JC, Oudkerk M, Witteman JC, Hofman A, van Gijn J, Breteler MM ( 2002): Hypertension and cerebral white matter lesions in a prospective cohort study. Brain 125 ( Part 4): 765–772; [DOI] [PubMed] [Google Scholar]
- Good CD, Johnsrude I, Ashburner J, Henson RN, Friston KJ, Frackowiak RS ( 2001a) Cerebral asymmetry and the effects of sex and handedness on brain structure: A voxel‐based morphometric analysis of 465 normal adult human brains. Neuroimage 14: 685–700. [DOI] [PubMed] [Google Scholar]
- Good CD, Johnsrude I, Ashburner J, Henson RN, Friston KJ, Frackowiak RS ( 2001b): A voxel‐based morphometric study of ageing in 465 normal adult human brains. Neuroimage 14( 1 Part 1): 21–36. [DOI] [PubMed] [Google Scholar]
- Grady CL ( 2008): Cognitive neuroscience of aging. Ann NY Acad Sci 1124: 127–144; (review). [DOI] [PubMed] [Google Scholar]
- Grady CL, Furey ML, Pietrini P, Horwitz B, Rapoport SI ( 2001): Altered brain functional connectivity and impaired short‐term memory in Alzheimer's disease. Brain 124 ( Part 4): 739–756; [DOI] [PubMed] [Google Scholar]
- Hochstenbach J, Mulder T, van Limbeek J, Donders R, Schoonderwaldt H ( 1998): Cognitive decline following stroke: A comprehensive study of cognitive decline following stroke. J Clin Exp Neuropsychol 20: 503–517. [DOI] [PubMed] [Google Scholar]
- Hutton C, Draganski B, Ashburner J, Weiskopf N ( 2009): A comparison between voxel‐based cortical thickness and voxel‐based morphometry in normal aging. Neuroimage 48: 371–380. [DOI] [PMC free article] [PubMed] [Google Scholar]
- Kim JS, Singh V, Lee JK, Lerch J, Ad‐Dab'bagh Y, MacDonald D, Lee JM, Kim SI, Evans AC ( 2005): Automated 3‐D extraction and evaluation of the inner and outer cortical surfaces using a Laplacian map and partial volume effect classification. Neuroimage 27: 210–221. [DOI] [PubMed] [Google Scholar]
- Kwee RM, Kwee TC ( 2005): Virchow‐Robin spaces at MR imaging. Radiographics 27: 1071–1086. [DOI] [PubMed] [Google Scholar]
- Launer LJ ( 2003): Epidemiology of white‐matter lesions. Int Psychogeriatr 15: 99–103; (review). [DOI] [PubMed] [Google Scholar]
- Lyttelton O, Boucher M, Robbins S, Evans A ( 2007): An unbiased iterative group registration template for cortical surface analysis. Neuroimage 34: 1535–1544. [DOI] [PubMed] [Google Scholar]
- MacDonald D, Kabani N, Avis D, Evans AC ( 2000): Automated 3‐D extraction of inner and outer surfaces of cerebral cortex from MRI. Neuroimage 12: 340–356. [DOI] [PubMed] [Google Scholar]
- Maldjian JA, Laurienti PJ, Kraft RA, Burdette JH ( 2003): An automated method for neuroanatomic and cytoarchitectonic atlas‐based interrogation of fmri data sets. Neuroimage 19: 1233–1239. [DOI] [PubMed] [Google Scholar]
- O'Brien JT, Erkinjuntti T, Reisberg B, Roman G, Sawada T, Pantoni L, Bowler JV, Ballard C, DeCarli C, Gorelick PB, Rockwood K, Burns A, Gauthier S, DeKosky ST ( 2003): Vascular cognitive impairment. Lancet Neurol 2: 89–98. [DOI] [PubMed] [Google Scholar]
- Preul C, Lohmann G, Hund‐Georgiadis M, Guthke T, von Cramon DY ( 2005): Morphometry demonstrates loss of cortical thickness in cerebral microangiopathy. J Neurol 252: 441–447. [DOI] [PubMed] [Google Scholar]
- Raz N, Gunning FM, Head D, Dupuis JH, McQuain J, Briggs SD, Loken WJ, Thornton AE, Acker JD ( 1997): Selective aging of the human cerebral cortex observed in vivo: Differential vulnerability of the prefrontal gray matter. Cereb Cortex 7: 268–282. [DOI] [PubMed] [Google Scholar]
- Raz N, Gunning‐Dixon F, Head D, Rodrigue KM, Williamson A, Acker JD ( 2004): Aging, sexual dimorphism, and hemispheric asymmetry of the cerebral cortex: Replicability of regional differences in volume. Neurobiol Aging 25: 377–396. [DOI] [PubMed] [Google Scholar]
- Salat DH, Kaye JA, Janowsky JS ( 2002): Greater orbital prefrontal volume selectively predicts worse working memory performance in older adults. Cereb Cortex 12: 494–505. [DOI] [PubMed] [Google Scholar]
- Salat DH, Buckner RL, Snyder AZ, Greve DN, Desikan RS, Busa E, Morris JC, Dale AM, Fischl B ( 2004): Thinning of the cerebral cortex in aging. Cereb Cortex 14: 721–730. [DOI] [PubMed] [Google Scholar]
- Schmidtke K, Hüll M ( 2005): Cerebral small vessel disease: How does it progress? J Neurol Sci 229/230: 13–20. [DOI] [PubMed] [Google Scholar]
- Sled JG, Zijdenbos AP, Evans AC ( 1998): A nonparametric method for automatic correction of intensity nonuniformity in MRI data. IEEE Trans Med Imaging 17: 87–97. [DOI] [PubMed] [Google Scholar]
- Sowell ER, Peterson BS, Thompson PM, Welcome SE, Henkenius AL, Toga AW ( 2003): Mapping cortical change across the human life span. Nat Neurosci 6: 309–315. [DOI] [PubMed] [Google Scholar]
- Storey JD ( 2002): A direct approach to false discovery rates. J R Stat Soc Series B 64: 479–498. [Google Scholar]
- Tosun D, Rettmann ME, Han X, Tao X, Xu C, Resnick SM, Pham DL, Prince JL ( 2004): Cortical surface segmentation and mapping. Neuroimage 23 Suppl 1: S108–118; (review). [DOI] [PMC free article] [PubMed] [Google Scholar]
- Van Essen DC ( 2005): A population‐average, landmark‐ and surface‐based (PALS): Atlas of human cerebral cortex. Neuroimage 28: 635–662. [DOI] [PubMed] [Google Scholar]
- Van Essen DC, Drury HA, Dickson J, Harwell J, Hanlon D, Anderson CH ( 2001): An integrated software suite for surface‐based analyses of cerebral cortex. J Am Med Inform Assoc 8: 443–459. [DOI] [PMC free article] [PubMed] [Google Scholar]
- Van Norden AG, Fick WF, de Laat KF, van Uden IW, van Oudheusden LJ, Tendolkar I, Zwiers MP, de Leeuw FE ( 2008): Subjective cognitive failures and hippocampal volume in elderly with white matter lesions. Neurology 71: 1152–1159. [DOI] [PubMed] [Google Scholar]
- Wandell BA ( 1999): Computational neuroimaging of human visual cortex. Annu Rev Neurosci 22: 145–173. [DOI] [PubMed] [Google Scholar]
- Worsley KJ ( 2005): An improved theoretical P value for SPMs based on discrete local maxima. Neuroimage 28: 1056–1062. [DOI] [PubMed] [Google Scholar]
- Worsley KJ, Andermann M, Koulis T, MacDonald D, Evans AC ( 1999): Detecting changes in nonisotropic images. Hum Brain Mapp 8: 98–101. [DOI] [PMC free article] [PubMed] [Google Scholar]
- Wright IC, McGuire PK, Poline JB, Travere JM, Murray RM, Frith CD, Frackowiak RS, Friston KJ ( 1995): A voxel‐based method for the statistical analysis of gray and white matter density applied to schizophrenia. Neuroimage 2: 244–252. [DOI] [PubMed] [Google Scholar]
- Xu J, Kobayashi S, Yamaguchi S, Iijima K, Okada K, Yamashita K ( 2000): Gender effects on age‐related changes in brain structure. AJNR Am J Neuroradiol 21: 112–118. [PMC free article] [PubMed] [Google Scholar]
- Zijdenbos AP, Forghani R, Evans AC ( 2002): Automatic “pipeline” analysis of 3‐D MRI data for clinical trials: Application to multiple sclerosis. IEEE Trans Med Imaging 21: 1280–1291. [DOI] [PubMed] [Google Scholar]
Associated Data
This section collects any data citations, data availability statements, or supplementary materials included in this article.
Supplementary Materials
Additional Supporting Information may be found in the online version of this article.
Supplemental Figure 1. Population‐average cortical surface parcellations, such as the Brodmann parcellation used in this study, utilize landmarks such as prominent sulci and gyri to localize cortical areas. This suffers from the limitation that not all areas have a tight correspondence to such landmarks (see for instance Amunts et al., 2004). To test the sensitivity of Brodmann area boundaries to the mean cortical thickness values analyzed in this study, we assigned weights to vertices under the assumption that central vertices are more probably belong to an area than boundary vertices. To do this we used two weighting functions: a linear weighting such that central nodes are 1.0 and boundary nodes are 0.0, and a Gaussian weighting such that central nodes are 1.0 and sigma equals half the distance to the boundary vertices. The resulting weighting functions are illustrated in the 3D renderings, shown next to the Brodmann parcellation. This figure shows that in both conditions, the impact of weighting upon both mean thickness and its standard deviation is quite small, the largest differences being BA24, BA29, and BA33, each approximately 0.1 mm.
Supplemental Figure 2. Two‐ and three‐dimensional renderings from a randomly selected subject illustrating the location of BA36 on the cortex. The 3D rendering shows the GM/WM and CM/CSF boundary surfaces, cropped at 3 mm to either side of the horizontal plane. The 2D section renderings show the surface with respect to the T1‐weighted image. Red demarcates the location of BA36 on these surfaces. Notably, the cortical sheet in this region is quite convoluted, and varies from thick to narrow across its length. Moreover, it is apparent that the tissue classification in this region is relatively difficult, given its proximity to underlying subcortical grey matter. These factors may contribute to the comparatively high variation observed in this area.
Supplemental Figure 3. Two‐ and three‐dimensional renderings from a randomly selected subject illustrating the location of BA38 on the cortex (compare with BA36). While BA38 is a neighbour of BA36, it appears to be in a less convoluted region of cortex, has a fairly consistent thickness across its length, and is located in a region where tissue classification is less difficult.
Supplemental Figure 4. Three‐dimensional surface renderings of the mean cortical surface used to display results in this article (green), and the template surface obtained through iterative group registration (grey) (Lyttelton et al., 2007) which was used to co‐register cortical surfaces across subjects in this study.
Supplemental Figure 5. Boxplots of Thickness for each Brodmann area ROI, showing the distributions for both hemispheres. ROIs are sorted by lobe, then by increasing mean Thickness. Filled boxes represent quartiles 1 to 3, capped lines indicate the range of regular values, circles indicate the mean, and horizontal lines indicate the median.
Supplemental Video 1. Three‐dimensional video renderings of the middle cortical surface. The colour mapping depicts the standardized slope for each Brodmann area, obtained from the linear model Thickness ∼ WMLV, across three age groups, independently for each hemisphere (compare with Figure 3). At top right, a “glass” brain is shown, containing the thresholded WML probability distribution for the entire population.
Supplemental Video 2. The slope of Age as a factor in the vertex‐wise model Thickness ∼ Age + Sex + Age * Sex was clustered in Matlab using a k‐means clustering method. The resulting seven clusters are illustrated in a 3D video rendering. The rendering on the left of the video shows the clusters distributed across the cortical surface; the rendering on the right shows the mean slope of the Age effect for each cluster.
Supplemental Video 3. To better characterize the spatial distribution of the Age effect, the slope of Age as a factor in the GM ROI‐wise model Thickness ∼ Age + Sex + Age * Sex was clustered into six clusters in Matlab using a hierarchical clustering method. The resulting clusters are illustrated in a 3D video rendering. The rendering on the left of the video shows the clusters distributed across the cortical surface; the rendering on the right shows the slope of the Age effect for each cluster, averaged across the BAs in that cluster.
Supplemental Table 1: Cortical surface area and volume estimates.