

Abstract
To test the hypothesis that deep brain stimulation of the subthalamic nucleus (STN) restores the inhibitory output to the striatothalamocortical loop in Parkinson's disease, we obtained functional brain images of blood flow in 10 STN‐stimulated patients with Parkinson's disease. Patients were immobile and off antiparkinsonian medication for 12 h. They were scanned with and without bilateral STN‐stimulation with a 4‐h interval between the two conditions. The order of DBS stimulation (ON or OFF) was randomized. Stimulation significantly raised regional cerebral blood flow (rCBF) bilaterally in the STN and in the left nucleus lentiformis. Conversely, flow declined in the left supplementary motor area (BA 6), ventrolateral nucleus of the left thalamus, and right cerebellum. Activation of the basal ganglia and deactivation of supplementary motor area and thalamus were both correlated with the improvement of motor function. The result is consistent with the explanation that stimulation in resting patients raises output from the STN with activation of the inhibitory basal ganglia output nuclei and subsequent deactivation of the thalamic anteroventral and ventrolateral nuclei and the supplementary motor area. Hum Brain Mapp, 2009. © 2007 Wiley‐Liss, Inc.
Keywords: Parkinson, STN‐stimulation, PET, flow, VL, thalamus, deactivation, basalgangglia loop, clinical outcome
INTRODUCTION
Deep brain stimulation of the subthalamic nucleus (STN) is well‐established in patients with Parkinson's disease with medically intractable motor complications [Deep‐Brain Stimulation Group, 2001, Ostergaard et al., 2002, 2005; Limousin et al., 1998] but no dementia or psychiatric complaints [Welter et al., 2002]. Yet, the exact mechanism underlying the effect remains unclear. The original explanation claimed that stimulation inhibits net output from the STN. A more recent view holds that the effect is the opposite, i.e., that the mechanism is facilitation of the output from this nucleus [Dostrovsky and Lozano, 2002; Haslinger et al., 2005; Vitek, 2002], which abolishes the abnormally elevated activity in the motor cortex of patients at rest by inhibiting the thalamocortical input [Payoux et al., 2004].
The effect on the symptoms of Parkinson's disease is reversible. Thus, when the stimulator is inactive, tremor returns within minutes, and bradykinesia and rigidity return within hours, with steady worsening of axial signs. When the stimulator is active, motor Unified Parkinson's Disease Rating Scale (UPDRS) scores improve in the same order [Temperli et al., 2003]. However, with some exceptions [e.g., Asamura et al., 2006; Hilker et al., 2004; Trost et al., 2006], the majority of previous studies of STN stimulation did not include a sufficient interval of at least 4 h between the on and off states of STN stimulation.
In patients at rest, the thalamus is hyperactive [Jellinger, 2002], implying that glutamatergic neurons of the VA–VL complex of the thalamus fire repeatedly. In the present study, we test the claim that normalization of the firing rate by increased pallidal output therefore may reduce activity (and hence blood flow) in the thalamus, regardless of the state of local activation of GABAergic terminals. With labeled water (H2 15O) as the flow tracer, we used positron emission tomography to test the specific prediction that bilateral subthalamic stimulation in patients with Parkinson's disease inhibits the thalamocortical innervation, reflected in decrease of regional blood flow (rCBF) in the anteroventral and ventrolateral nuclei of the thalamus (VA–VL) and supplementary motor area (SMA). Finally we investigated the clinical significance of STN stimulation induced rCBF changes by correlating the effect of the stimulation on cerebral flow with the clinical outcome. To ensure the clinical stability of the patients, an interval of 4 h between the scans with STN stimulation on and off was sustained.
METHODS
Subjects
Ten bilaterally STN‐implanted patients with Parkinson's disease (eight men and two women, mean age 61.1 ± 9.1 years) off antiparkinson medication for 12 h, participated in the study. The study was approved by the local ethics committee, and all subjects gave written informed consent. Prior to the STN operation, all patients were neuropsychologically evaluated to rule out dementia and executive dysfunction (using WAIS 2 and WMS 2), personality disorders (tested with Millon Clinical Multiaxial Inventory), and depression (measured by Becks Depression Index), and after surgery were they followed clinically by a movement disorder specialist, who saw them at least every third month. None of the patients included in this study suffered from dementia, depression, or any significant disease other than Parkinson's disease before the operation or developed any of these during follow up.
The PET results of one subject (No. 9, female, 64 years) were excluded from the group analysis because of tomograph failure during the STN‐stimulator‐off condition. The subjects were off medication 12 h prior to the first PET session. All patients were scored with the UPDRS, part III, with stimulation on as well as off immediately before PET.
The clinical data of each subject is listed in Table I, and settings for the STN stimulation are listed in Table A (online material). The STN is divided into a large dorsolateral sensorimotor territory and a smaller ventromedial associative territory of which the most medial part of the nucleus represents a limbic area [Parent and Hazrati, 1995]. It has been demonstrated that stimulation of the limbic part of the STN can lead to behavioral changes [Krack et al., 2001]. Thus it is possible that differences in electrode placement may in part explain some of the inconsistencies in the literature of STN stimulation. For this reason for all 10 patients stimulation electrodes were verified to be correctly positioned in the dorsal part of the STN as indicated in Figure B (online material)
Table I.
Clinical data
| Subject no. | Gender | Age (years) | Duration of disease (years) | Duration of STN‐stimulation (months) | Antiparkinson medication | Most affected side off stimulation |
|---|---|---|---|---|---|---|
| 1 | Male | 40 | 9 | 5 | Pramipexole, levodopa | L |
| 2 | Male | 68 | 13 | 3 | Pramipexole, levodopa | R |
| 3 | Male | 58 | 9 | 3 | Pramipexole, levodopa | L |
| 4 | Male | 55 | 17 | 23 | Pergolide, levodopa | L |
| 5 | Male | 65 | 14 | 25 | Ropinerole, levodopa | R |
| 6 | Male | 72 | 14 | 17 | Levodopa | R |
| 7 | Female | 66 | 11 | 14 | Levodopa | R |
| 8 | Male | 53 | 13 | 9 | Pramipexole, levodopa, entacapone | L |
| 9a | Female | 64 | 11 | 19 | Pramipexole, levodopa | L |
| 10 | Male | 62 | 19 | 9 | Pergolide, levodopa | R |
No. 9 was excluded because of scanner failure.
PET Data Acquisition and Analysis
An index of regional cerebral blood flow (rCBF) was recorded with an ECAT Exact HR47 PET camera (Siemens/CTI, Knoxville, TN) in 3D mode, following fast bolus injections of 500 MBq H2 15O into the left antecubital vein. A single 60‐s frame of activity was acquired beginning at 60,000 true counts/s. Successive injections were separated by intervals of at least 12 min. Subjects were imaged in two sessions of six injections each: six injections with the stimulator off and six with the stimulator on. The order of the two sessions was randomized separated by a 4 h intermission [Temperli et al., 2003], with the subject out of the tomograph. Patients received no antiparkinson medication between the two sessions. For those randomized to begin with STN stimulation off, the stimulator was off for 4 h prior to the tomography. The subjects were instructed to relax and remain still during the tomography while watching a 21‐inch color monitor placed 70 cm from their eyes. The monitor displayed unpleasant, pleasant, or neutral picture series from the Empathy Picture System [Geday et al. 2003] (http://www.geday.net/eps) in a randomized but balanced order with the same number of pleasant/unpleasant/neutral picture series during the stimulator off as on the subjects were asked to look carefully at the images, but were not otherwise instructed. A movement disorder specialist watched patients closely for visible tremor or other movements.
A transmission image was obtained at the onset of each session. PET images were reconstructed after attenuation and scatter correction [Watson et al., 1996]. The 47 3.1‐mm sections were filtered to 16‐mm FWHM and 12‐mm FWHM isotropic (Hanning filter cut‐off frequency = 0.15 cycles/s). PET images were realigned using Automatic Image Registration software to correct for head movements between scans [Woods et al., 1992]. For anatomical localization of activation sites, T1‐weighted magnetic resonance imaging (MRI) was performed on a GE Sigma 1‐T scanner providing 1.5‐mm sections. The first PET image was coregistered to the MRI of each subject. PET and MRI data were mapped into standardized stereotaxic space [Talairach and Tournoux, 1998], using a nine‐parameter affine transformation from the minc program package of the MNI. All PET images were coregistered to the first PET image and with the MRI‐to‐Talairach, and PET‐to‐MRI transformations, mapped into standardized stereotaxic space. All PET images were normalized by masking to an average activity in gray matter of 100. Before inclusion in the final analysis all coregistration where validated by visual inspection
The t‐statistical maps were calculated voxel‐by‐voxel of PET volumes using local voxel SD. The rCBF indices recorded with STN‐stimulation on were regressed against rCBF indices recordede with STN‐stimulation of using Glim Image from Dot. Corrected P values for local maxima were calculated according to the method described by Worsley et al. [1996] for image volumes with nonuniform SD, with correction for multiple comparisons. Thus the t‐threshold for the P‐values differs according to degrees of freedom, filter size (FWHM), and search volume.
Global Analysis of All Gray Matter
We first performed a global search for sites of significant change in all gray matter (600 cm3) comparing images with stimulation on with those off, with regressor value 1 for stimulation on and −1 for stimulation off. A second global search analysis used the improvement in UPDRS III of each individual patient as regressor values for stimulation on and with the value zero for stimulation off, at the coordinates identified by the first analysis. We report only areas significantly deactivated or activated in both global analyses.
Restricted Analysis of the Basal Ganglia
A third analysis searched a restricted volume consisting of the basal ganglia bilaterally (45 cm3).
Validation
Fourth, to validate the results, we searched spheres with a 10‐mm radius centered on coordinates of significant activation or deactivation identified by the global and restricted search analyses with a search volume of 41 cm3, comparing the ON and OFF condition of the neutral image viewing. To further rule out bias from the emotional stimuli, for each validated cluster identified by the global and restricted analyses we tested for an interaction between emotion and STN‐stimulation, contrasting (emotional vs. neutral) ON vs. (emotional vs. neutral) OFF.
Connectivity Analysis
We used the activities in a 3‐mm‐radius spheres centered on the validated clusters in the striatothalamocortical loop and cerebellum identified by the analyses above (i.e., clusters in STN, lentiform nucleus, thalamus, SMA, and cerebellum) as regressors in further restricted analysis as follows. We interpreted covariance was as an indication of connectivity, in which activities in areas connected by excitatory synapses covaried positively, while activities in areas connected by inhibitory synapses covaried negatively.
RESULTS
Stimulation Efficacy
All subjects were off medication for 12 h prior to the study and were scored with UPDRS motor part III with bilateral STN stimulation on and then off for 4 h to evaluate the efficacy of stimulation. The average motor improvement of 25.2 points (70%) on the UPDRS part III, presented in Table II, is consistent with previous studies [e.g., Limousin et al., 1998; Ostergaard et al., 2002].
Table II.
STN efficacy measured as difference in motor scores on the Unified Parkinson's Disease Rating Scale (UPDRS III) for each of the 10 subjects
| Subject no. | UPDRS III “OFF” | UPDRS III “ON” | Effect (ON – OFF) |
|---|---|---|---|
| 1 | 18 | 4 | 14 |
| 2 | 40 | 22 | 18 |
| 3 | 18 | 7 | 11 |
| 4 | 65 | 12 | 53 |
| 5 | 48 | 8 | 40 |
| 6 | 48 | 10 | 38 |
| 7 | 14 | 4 | 10 |
| 8 | 37 | 20 | 17 |
| 9* | 43 | 11 | 32 |
| 10 | 31 | 12 | 19 |
| Mean | 36.2 ± 16.2 | 11 ± 6 | 25.2 ± 14.6 (70% improvement) |
Effect of Bilateral STN Stimulation
Global search of all grey matter revealed that STN‐stimulation significantly increased rCBF in the right STN, the left striatum (the activation cluster including the nucleus lentiformis and the medial part of the caudate nucleus, with maximum at the putamen), the left dorsolateral prefrontal cortex (DLPC) (superior frontal gyrus), and temporal cortices, while it decreased rCBF in the left motor cortex, left SMA, left thalamus at coordinates of the VL nucleus, and the cerebellum. Restricted search of the basal ganglia revealed significant activation of the left STN. In the validation procedure, the restricted search of all 13 spheres centred on coordinates identified by neutral stimuli only (search volume 41 cm3, df: 25, t > 4.17 for P < 0.05) confirmed the results of the global search bilaterally in STN, in left putamen, left VA–VL, left SMA, and in right cerebellum, presented in Table III, but did not replicate the changes in prefrontal and temporal cortices.
Table III.
Activations and deactivations during bilateral STN stimulation, FWHM 16 mm
| All scans | Neutral only | |||||||
|---|---|---|---|---|---|---|---|---|
| Anatomical area | BA | Talairach coordinates | t | P cor. | ||||
| x | y | z | t | P cor. | ||||
| Activations | ||||||||
| R. subthalamic nucleus | – | 13 | −11 | −8 | 7.99 | <0.00001 | 4.49 | <0.05 |
| L. subthalamic nucleus a | – | −13 | −11 | −8 | 5.17 | 0.01 | 4.24 | <0.05 |
| R. precuneus | 7 | 16 | −73 | 51 | 5.76 | <0.001 | 2.69 | n.s. |
| L. occipitotemporal gyrus | 19 | −19 | −66 | 0 | 4.88 | <0.01 | 2.10 | n.s. |
| L. middle temporal gyrus, insula | 21 | −51 | −13 | −11 | 5.62 | <0.01 | 2.74 | n.s. |
| L. lentiformis (putamen) | – | −21 | 2 | 6 | 9.96 | <0.00001 | 5.22 | <0.01 |
| L. superior frontal gyrus | 8 | −17 | 20 | 44 | 6.58 | <0.0001 | 3.08 | n.s. |
| Deactivations | ||||||||
| L. medial frontal gyrus (SMA) | 6 | −7 | −14 | 51 | −7.93 | <0.00001 | −4.60 | <0.02 |
| L. thalamus b | – | −20 | −24 | 2 | −5.46 | <0.01 | −4.32 | <0.05 |
| L. parahippocampal gyrus | 36 | −19 | −38 | −17 | −5.86 | <0.00001 | −2.71 | n.s. |
| L. precentral gyrus (motor cortex) | 4 | −39 | −21 | 63 | −7.93 | <0.00001 | −4.41 | <0.05 |
| L. cingulate gyrus | 31 | −17 | −23 | 36 | −5.86 | <0.01 | −4.02 | n.s. |
| R. cerebellum | – | 3 | −59 | −2 | −6.82 | <0.0001 | −5.09 | <0.01 |
Only areas significantly activated or deactivated in both global regression analyses (simple regression using regressor values 1 for ON and −1 for OFF, and complex regression using for each subject their own motor improvement on UPDSR III scores as regressors for ON and zero for OFF) are reported.
All t‐values and P values corrected for multiple comparisons in this table are from global regression (search volume 600 cm3) analysis using the UPRDS improvement as regressors.
Left STN was significantly activated by stimulation in the simple regression analysis, only in the restricted search in the basal ganglia only, search volume 45 cm3, but significantly so in global search using the UPDRS III scores. Areas where activation or deactivations were validated in the analysis performed on PET scans during neutral stimuli only are in bold.
FWHM 12 mm.
Activation of left putamen and bilateral subthalamic nuclei (Figs. 1 and 2), and deactivation of SMA and thalamus (Figs. 3 and 4) closely correlated with the benefit of the stimulation (UPDRS III stim. on – UPDRS III stim. off).
Figure 1.
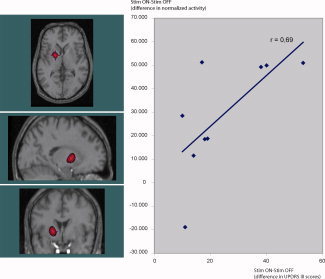
Activation in the left putamen (y‐axis, change in normalized PET counts) correlates significantly with the clinical improvement in parkinson motor symptoms by STN stimulation (t = 9.96, P < 0.00001, image threshold: t > 7) measured as improvement in UPDSR III (x‐axis, UPDSR III scores on minus UPDRS III scores off stimulation). [Color figure can be viewed in the online issue, which is available at www.interscience.wiley.com.]
Figure 2.
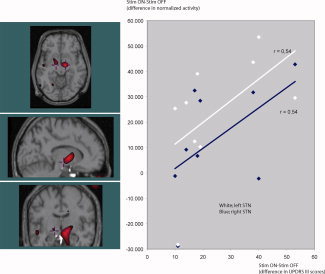
When comparing rCBF in the STN when stimulation is “ON” with stimulation “OFF” the right side (t = 7.77, P < 0.00001, image threshold: t > 5) increases more than in the left (t = 5.17, P < 0.01, image threshold: t > 5) (y‐axis, change in normalized PET counts). But there is no side‐difference in the positive correlation between the stimulation induced increase in STN activity and the patients' improvement in UPDRS III (x‐axis, UPDRS III scores on minus UPDRS III scores off stimulation). [Color figure can be viewed in the online issue, which is available at www.interscience.wiley.com.]
Figure 3.
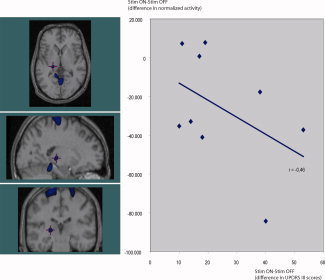
STN stimulation decreases rCBF in the lateral thalamus (y‐axis, change in normalized PET counts), this decrease is significantly correlated to the improvement in UPDRS III (x‐axis, UPDRS III scores on minus UPDRS III scores off stimulation). This deactivation (t = −5.87, P < 0.0001, image threshold: t < −5) appears to be slightly posterior to the VA–VL nucleus. Part of this may be caused by the limited resolution in H2 15O‐PET at 5–10 mm, but neuroanatomical differences—especially in the size of the ventricles—can misplace the basal ganglia in the resultant average image during the transformation to Talairach space. VA–VL nucleus was therefore identified on each subject's anatomical mri, which was then coregistered to the patients PET images used in a single subject analysis. This confirmed a STN‐deep brain stimulation induced rCBF decrease in the left VA–VL in six of the nine subjects. [Color figure can be viewed in the online issue, which is available at www.interscience.wiley.com.]
Figure 4.
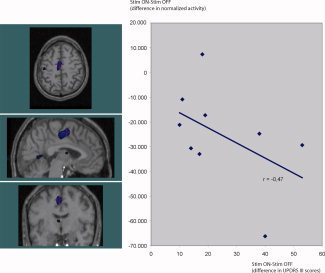
STN‐deep brain stimulation decreases rCBF in the left SMA (y‐axis, change in normalized PET counts), the decrease (t = −7.93, P < 0.00001, image threshold: t < −5) is significantly correlated to the improvement in UPDRS III (x‐axis, UPDRS III scores on minus UPDRS III scores off stimulation). [Color figure can be viewed in the online issue, which is available at www.interscience.wiley.com.]
Correlation analysis of connectivity in the striatothalamocortical circuit identified significant covariation among STN, putamen, VL, and SMA, as predicted by the model by Alexander et al. [1986], in which a rise of rCBF is coupled to a rise of rCBF in nucleus lentiformis, decline of CBF in VL, and decline of rCBF in SMA. Activity changes in right and left STN were also correlated, although the stimulation itself probably was the cause of this association, rather than the presence of connections between the nuclei. Activity changes in cerebellum and SMA were linked but no correlation existed between activity changes in VL and cerebellum (Fig. 5).
Figure 5.
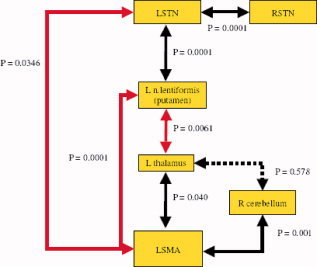
Red arrows refer to negative correlation. Deactivation of SMA is significantly correlated to activity changes in other parts of the basal ganglia loop and STN predicted by the model by Alexander and DeLong. Activity changes in cerebellum correlate with changes in SMA but not in the thalamus. The positive correlation between RSTN and LSTN is the consequence of a common cause of activity changes (the stimulation) rather than propose the existence of contra lateral connections between the two nuclei. [Color figure can be viewed in the online issue, which is available at www.interscience.wiley.com.]
DISCUSSION
The general results of the present analysis are consistent with STN‐DBS induced activation of a striatothalamocortical loop in the model proposed by Alexander et al. [1986]. Although this description of basal ganglia function has been refined greatly by inclusion of several reciprocal connections within the loop as well as connections to and from the substantia nigra and the cerebellum [see Baer et al., 2002; Houk and Wise, 1995; Nambu, 2004], the general principles of the model still apply. Increased firing of excitatory neurons in the STN activates the subthalamopallido‐striatal feedback mechanism. This feedback in turn elevates the firing of the inhibitory GABAergic putaminal and pallidal neurons innervating the VA–VL complex in the thalamus and thus lowers the activity of the excitatory thalamocortical projection. In the present study STN stimulation raised blood flow significantly in STN bilaterally and in the left nucleus lentiformis and lowered blood flow in the VL nucleus of the left thalamus and in left SMA.
There are several possible explanations for the increase in STN blood flow: it may be a consequence of interneuronal activity, of change of the input to the STN, or both. STN stimulation may also affect fibers passing around the STN and thus influence blood flow, or the stimulation may produce transmitter fatigue or cause retrograde transmission, both with unclear effects on blood flow. Hershey et al. [2003] reviewed the topic, and we concur with the conclusion that the most parsimonious explanation is that STN‐stimulation per se raises activity in the STN. However, all subjects in the present study were STN‐stimulated at frequencies above 100 Hz (online Table A) at which frequencies synaptic transmission fails [Urbano et al., 2002].
Also in the present study bilateral STN stimulation lowered rCBF in the left SMA. In patients with Parkinson's disease, STN stimulation augments the rCBF increase in SMA during motor tasks, but the main effect is a decrease of rCBF at rest rather than a rise during activation [Limousin et al., 1998; Hershey et al., 2003]. Thus Payoux et al. [2004] agreed with Ceballos‐Baumann et al. [1999] that the effect of stimulation is reduction of an abnormally high resting activity in motor cortex and selective activation during motion. We suggest that a similar mechanism can explain how studies of a resting baseline subtracted from the active condition [e.g., Pinto et al., 2004] yield higher activity of the SMA when STN stimulation is on compared to off.
Two issues complicate the interpretation of the evidence. First, it is not clear to which extent the changes seen in the thalamus anatomically overlap changes in the STN because of indistinct regional definition and partial volume effects. Second there is no agreement on the combined effects of GABA‐ergic innervation of the region: to which extent does an activation of GABA‐ergic terminals cancel the metabolic and circulatory effects of inhibition of target neurons?
We found that STN stimulation decreased rCBF in the VA–VL nuclei of the thalamus. In this respect the literature is equivocal; in a restricted analysis of basal ganglia only, Hershey et al. [2003] interpreted a significantly (P < 0.05) increased blood flow to the (LP) nucleus (x, y, z: −20, 22, 12 mm) of the thalamus, dorsal to the VL nucleus during STN stimulation at rest as a result of increased GABA‐ergic inhibition from internal pallidus and reticular substantia nigra and hence as a deactivation of thalamus. We find this interpretation less likely, as together with the pulvinar LP projects to higher‐order visual and association areas in the occipital, parietal, and temporal lobes, and is claimed to process and relay multimodal information to cerebral cortex.
In study of patients not at rest but engaged in motor execution and imagery Thobois et al. [2002] reported bilateral rCBF increases in the thalamus but only as uncorrected P‐values, with Z‐scores of 4.14 and 3.85; below the theoretical voxel threshold for P < 0.05 of 5.28 in global search (assuming a search volume of 500 cm3, df 75, and FWHM 6.5 mm), so it is difficult to draw conclusions from this evidence.
With correction for multiple comparisons STN stimulation significantly raised glucose metabolism bilaterally in the thalamus but did not reduce motor cortex activity [Hilker et al., 2004], the latter in contrast to most blood flow studies [Hershey et al., 2003; Limousin et al., 1997; Pinto et al., 2004; Thobois et al., 2002]. Hilker et al. [2004] reported that the activation cluster in both hemispheres reached as far down as midbrain (z‐coordinates – 14 mm). Thus the reported increase of glucose metabolism in reality may reflect an increase in STN rather than in thalamus metabolism. Asanuma et al. [2006] reported increased glucose metabolism in left VL nucleus of the thalamus but the cluster of voxels again spanned the subthalamic region in addition to ventrolateral thalamus. Trost et al. [2006] found no significant change in the thalamus but observed that stimulation lowered glucose metabolism in motor and supplementary motor cortices.
In the question of the effects of GABA‐ergic activation, we find no evidence in the literature that increased GABA release per se raises metabolism or blood flow; on the contrary, several recent studies suggest that GABA‐ergic inhibition lowers blood flow in the target area [Chen et al., 2005; Roland and Friberg, 1988; Takano et al., 2004; Xi et al., 2002]. Early PET studies suggested that blood flow measures might fail to distinguish between increased GABA‐ergic inhibition and increased glutamatergic excitation, as both require energy and both may benefit from increased blood flow [Ackermann et al., 1984]. In this interpretation, an increase in thalamic activity would not distinguish among the effects of inhibitory or excitatory input or excitatory output. However, more recent evidence suggests that increased blood flow is less likely to indicate increased GABA‐ergic inhibition. The neurophysiological coupling between regional blood flow and neuronal activity is the basis for the interpretation of the signals recorded by neuroimaging [Iadecola, 2002; Lauritzen and Gold, 2003; Lauritzen, 2001; Logothetis et al., 2001; Shmuel et al., 2006]. Although the study of Mathiesen et al. [1998] sometimes is taken to imply that increased GABA‐ergic activity raises blood flow in cerebellar cortex, the authors themselves actually interpret the increase as activation of the GABA‐ergic neurons in the region, and not as an effect of the release of GABA. There is evidence that cortical interneurons regulate the neurovascular coupling by altering the balance between vascular constrictions and dilatations. Thus, Cauli et al. [2004] showed that stimulation of single cortical interneurons, depending on subtype, constricts or dilates cortical microvessels. These findings demonstrate that specific subsets of cortical GABA interneurons translate afferent signals into appropriate vascular responses and thus act as local integrators of neurovascular coupling. However, this function of selected short‐range cortical interneurons has not been shown to alter the fundamental relationship between flow and activity in a given brain region. In summary, the bulk of the evidence indicates that GABA‐ergic inhibition of the thalamus lowers thalamic activity and blood flow. To be consistent with the mechanism proposed by Alexander et al. [1986], functional brain imaging results must reveal reduced blood flow in thalamus during DBS of the STN in patients with Parkinson's disease, if the DBS restores the normal resting striatal inhibition of the thalamocortical projections [Ceballos‐Baumann et al., 1999, Payoux et al., 2004, Eckert and Eidelberg, 2005].
STN‐stimulation also reduced rCBF in the cerebellum. The cerebellum is abnormally active in nonmedicated Parkinson patients [Eidelberg et al., 1994]. Cerebellar rCBF is correlated with akinesia [Payoux et al., 2004] but abnormal cerebellar activity may also be attributed to tremor [Hilker et al., 2004] or rigidity [Rivest et al., 1990]. The present patients were equally affected by tremor and rigidity. Hilker suggested that STN stimulation may act to reduce tremor either directly or indirectly via cerebellothalamocortical pathways that mediate tremor, by deactivating the rostral cerebellum via an antidromic effect in dentate‐thalamic fibers. The connectivity analysis of sites in the left thalamus and the right cerebellum revealed no significant correlation between the two regions (Fig. 5), suggesting that the cerebellar deactivation is unrelated to an effect of deep brain stimulation in dentate‐thalamic fibers. Rather, we suggest that it reflects changes in a functional equilibrium between the cerebellothalamocortical‐ and striatothalamocortical circuits, as a consequence of stimulation‐induced changes of basal ganglia activity.
The bilateral STN stimulation led to predominately left‐sided changes of the rCBF, as reported previously [Hershey et al., 2003; Hilker et al., 2004]. We searched through right‐sided mirror coordinates of significantly activated or deactivated clusters. Except for the right thalamus (where activity changes on average were close to zero as a likely consequence of the proximity to a highly significant activation cluster around the right STN), the search revealed an insignificant trend towards rCBF changes in the same direction as on the left side. By means of interaction analysis, we weighed potential explanations of this finding, including lateralization of Parkinsonian symptoms, side differences of the effect of STN‐deep brain stimulation, duration of the STN stimulation, and different settings of electrode impedance. None explained the asymmetry found in the present study. We suggest that the lateralization may be a consequence of normal left hemisphere dominance in motor function [Dassonville et al., 1998; Kawashima et al., 1993].
As indicated in Table III, STN‐stimulation also activated the upper part of the DLPC and the inferior temporal cortices. These activations may represent a stimulation induced activation of the oculomotor basal ganglia loop [Turatto et al. 2004], as the subjects were engaged in viewing images during the tomography, and as such possibly are similar to the stimulus induced SMA activation reported during motor tasks [Limousin, 1997]. We were unable to confirm these findings in the validating analysis of neutral stimulation only, and are reluctant to draw any firm conclusion from this finding.
Strafella et al. [2003] reported activity changes in pallidum and SMA and improvement of motor performance in Parkinson's disease when subjects moved a joystick. We now show that this correlation is valid for the entire striatothalamocortical loop at rest, when activations and UPDRS motor scores are compared on and off stimulation, implying that the striatothalamocortical loop is the clinically relevant target of evaluation of the effect of STN stimulation.
LIMITATIONS
The present study design did not include a baseline condition in which the patients were completely at rest without visual stimulation. The activations and deactivations reported here represent the motor findings in a study of the effects of STN stimulation on emotional perception [Geday et al., 2006]. We specifically checked whether emotional content itself is a confounder in the ROI analyses of blood flow changes during presentation of neutral and emotional images on and off DBS stimulation for all reported coordinates. We found no significant changes and only an insignificant trend indicating raised activity in the right STN for neutral vs. unpleasant images, consistent with activation by emotional content of the limbic part of the STN, as described elsewhere [Kuhn et al., 2005]. As this trend was equally present on and off stimulation, it is not a bias in the present study.
We further validated the results for neutral images only to rule out influence from emotional images. It remains a limitation that subjects, although immobile, were not truly at rest, as they always focused on, and were engaged in passive assessment of, images displayed in front of them. However, all subjects where instructed to relax in the tomograph and view a computer screen suspended from the ceiling, and the authors ascertained that all subjects complied and did not move visibly during the tomography.
The observation that no subject experienced significant tremor or dystonia, in spite of UPDRS III scores in the 30–60 range, may be purely incidental, but it may also represent a clinical interaction between symptoms of Parkinson's disease and the image assessment not detectable by the PET investigation.
Generally, an interval of more than 12 h is required for normalization of the dopamine receptor density after down‐regulation induced by levodopa. As plasma half‐lives of the agonists used by patients in this study ranged from 6 to 24 h, we do not claim that the subjects were completely without benefit of medication. However, we considered it unacceptable for the majority of patients to be without anti‐Parkinson medication for longer than 12 h, and at the same time to have the STN stimulator turned off for more than 4 h. The literature gives the preference of 12 h of drug‐freedom adopted in this study, e.g., Thobois [2002], Hilker [2004], Zhao et al. [2004], Pinto et al. [2004], and Payoux et al. [2004].
CONCLUSION
The results of the present study are consistent with the hypothesis that deep brain stimulation of the STN excites rather than inhibits output from the STN in Parkinson's disease. Increased STN firing excites neurons of the internal pallidum and the firing increases the inhibitory output from putamen to the VL nucleus of the thalamus, simultaneously decreasing the thalamic excitatory output to cortex and cortical activity. In this interpretation, the clinical effect of deep brain stimulation of the STN is a consequence of the reduction of the abnormally high resting activity observed in the SMA. The increased activity in the STN and nucleus lentiformis (putamen and pallidus), as well as the decreased activity in VL and SMA, both correlate with the benefit to motor function that patients experience after the operation. Thus, reactivation of the normal striatothalamocortical inhibition explains the improved motor function that patients enjoy after STN stimulation.
Supporting information
Additional Supporting Information may be found in the online version of this article.
Supporting Information Figure B
STN‐DBS settings in the 10 patients
REFERENCES
- Ackermann RF,Finch DM,Babb TL,Engel J Jr ( 1984): Increased glucose metabolism during long‐duration recurrent inhibition of hippocampal pyramidal cells. J Neurosci 4: 251–264. [DOI] [PMC free article] [PubMed] [Google Scholar]
- Alexander GE,DeLong MR,Strick PL ( 1986): Parallel organization of functionally segregated circuits linking basal ganglia and cortex. Annu Rev Neurosci 9: 357–381. [DOI] [PubMed] [Google Scholar]
- Asanuma K,Tang C,Ma Y,Dhawan V,Mattis P,Edwards C,Kaplitt MG,Feigin A,Eidelberg ( 2006): Network modulation in the treatment of Parkinson's disease. Brain 129 (Part 10): 2667–2678. [DOI] [PMC free article] [PubMed] [Google Scholar]
- Bernhard H,Kalteis K,Boecker H,Alesch F,Ceballos‐Baumanna AO ( 2005): Frequency‐correlated decreases of motor cortex activity associated with subthalamic nucleus stimulation in Parkinson's disease. NeuroImage 28: 598–606. [DOI] [PubMed] [Google Scholar]
- Cauli B,Tong XK,Rancillac A,Serluca N,Lambolez B,Rossier J,Hamel E ( 2004): Cortical GABA interneurons in neurovascular coupling: Relays for subcortical vasoactive pathways. J Neurosci 24: 8940–8949. [DOI] [PMC free article] [PubMed] [Google Scholar]
- Ceballos‐Baumann AO,Boecker H,Bartenstein P,von Falkenhayn I,Riescher H,Conrad B,Moringlane JR,Alesch F ( 1999): A positron emission tomographic study of STN stimulation in Parkinson disease: Enhanced movement‐related activity of motor‐association cortex and decreased motor cortex resting activity. Arch Neurol 56: 997–1003. [DOI] [PubMed] [Google Scholar]
- Chen Z,Silva AC,Yang J,Shen J ( 2005): Elevated endogenous GABA level correlates with decreased fMRI signals in the rat brain during acute inhibition of GABA transaminase. J Neurosci Res 79: 383–391. [DOI] [PubMed] [Google Scholar]
- Dassonville P,Lewis SM,Zhu XH,Ugurbil K,Kim SG,Ashe J ( 1998): Effects of movement predictability on cortical motor activation. Neurosci Res 32: 65–74. [DOI] [PubMed] [Google Scholar]
- Dostrovsky JO,Lozano AM ( 2002): Mechanisms of deep brain stimulation. Mov Disord 17 ( Suppl. 3) S63–S68. [DOI] [PubMed] [Google Scholar]
- Eckert T,Eidelberg D ( 2005): Neuroimaging and therapeutics in movement disorders. NeuroRx 2: 361–371. Review. [DOI] [PMC free article] [PubMed] [Google Scholar]
- Eidelberg D,Moeller JR,Dhawan V,Spetsieris P,Takikawa S,Ishikawa T,Chaly T,Robeson W,Margouleff D,Przedborski S ( 1994): The metabolic topography of parkinsonism. J Cereb Blood Flow Metab 14: 783–801. [DOI] [PubMed] [Google Scholar]
- Geday JA,Gjedde A,Boldsen AS,Kupers R ( 2003): Emotional valence modulates activity in the posterior fusiform gyrus and inferior medial prefrontal cortex in social perception. NeuroImage 18: 675–668. [DOI] [PubMed] [Google Scholar]
- Geday J,Ostergaard K,Gjedde A ( 2006): Stimulation of subthalamic nucleus inhibits emotional activation of fusiform gyrus. Neuroimage 33: 706–714. [DOI] [PubMed] [Google Scholar]
- Hershey T,Revilla FJ,Wernle AR,McGee‐Minnich L,Antenor JV,Videen TO,Dowling JL,Mink JW,Perlmutter JS ( 2003): Cortical and subcortical blood flow effects of subthalamic nucleus stimulation in PD. Neurology 61: 816–821. [DOI] [PubMed] [Google Scholar]
- Hilker R,Voges J,Weisenbach S,Kalbe E,Burghaus L,Ghaemi M,Lehrke R,Koulousakis A,Herholz K,Sturm V,Heiss WD ( 2004): Subthalamic nucleus stimulation restores glucose metabolism in associative and limbic cortices and in cerebellum: Evidence from a FDG‐PET study in advanced Parkinson's disease. J Cereb Blood Flow Metab 24: 7–16. [DOI] [PubMed] [Google Scholar]
- Houk JC,Wise SP ( 1995): Distributed modular architectures linking basal ganglia, cerebellum, and cerebral cortex: Their role in planning and controlling action. Cereb Cortex 5: 95–110. [DOI] [PubMed] [Google Scholar]
- Iadecola C ( 2002): Intrinisc signals and functional brain mapping: Caution, blood vessels at work. Cereb Cortex 12: 223–224. [DOI] [PubMed] [Google Scholar]
- Jellinger KA ( 2002): Recent developments in the pathology of Parkinson's disease. J Neural Transm Suppl 62: 347–376. [DOI] [PubMed] [Google Scholar]
- Kawashima R,Yamada K,Kinomura S,Yamaguchi T,Matsui H,Yoshioka S,Fukuda H ( 1993): Regional cerebral blood flow changes of cortical motor areas and prefrontal areas in humans related to ipsilateral and contralateral hand movement. Brain Res 623: 33–40. [DOI] [PubMed] [Google Scholar]
- Krack P,Kumar R,Ardouin C,Dowsey PL,McVicker JM,Benabid AL,Pollak P ( 2001): Mirthful laughter induced by subthalamic nucleus stimulation. Mov Disord 16: 867–875. [DOI] [PubMed] [Google Scholar]
- Kuhn AA,Hariz MI,Silberstein P,Tisch S,Kupsch A,Schneider GH,Limousin‐Dowsey P,Yarrow K,Brown P ( 2005): Activation of the subthalamic region during emotional processing in Parkinson disease. Neurology 65: 707–713. [DOI] [PubMed] [Google Scholar]
- Lauritzen M ( 2001): Relationship of spikes, synaptic activity, and local changes of cerebral blood flow. J Cereb Blood Flow Metab 21: 1367–1383. [DOI] [PubMed] [Google Scholar]
- Lauritzen M,Gold L ( 2003): Brain function and neurophysiological correlates of signals used in functional neuroimaging. JNeurosci 23: 3972–3980. [DOI] [PMC free article] [PubMed] [Google Scholar]
- Limousin P,Greene J,Pollak P,Rothwell J,Benabid AL,Frackowiak R ( 1997): Changes in cerebral activity pattern due to subthalamic nucleus or internal pallidum stimulation in Parkinson's disease. Ann Neurol; 42: 283–291. [DOI] [PubMed] [Google Scholar]
- Limousin P,Krack P,Pollak P,Benazzouz A,Ardouin C,Hoffmann D,Benabid AL ( 1998): Electrical stimulation of the subthalamic nucleus in advanced Parkinson's disease. N Engl J Med 339: 1105–1111. [DOI] [PubMed] [Google Scholar]
- Logothetis NK,Pauls J,Augath M,Trinath T,Oeltermann A ( 2001): Neurophysiological investigation of the basis of the fMRI signal. Nature 412: 150–157. [DOI] [PubMed] [Google Scholar]
- Mathiesen C,Caesar K,Akgoren N,Lauritzen M ( 1998): Modification of activity‐dependent increases of cerebral blood flow by excitatory synaptic activity and spikes in rat cerebellar cortex. JPhysiol 512 (Part 2): 555–566. [DOI] [PMC free article] [PubMed] [Google Scholar]
- Nambu A ( 2004): A new dynamic model of the cortico‐basal ganglia loop. Prog Brain Res 143: 461–466. [DOI] [PubMed] [Google Scholar]
- Ostergaard K,Aa Sunde N ( 2006): Evolution of Parkinson's disease during 4 years of bilateral deep brain stimulation of the subthalamic nucleus. Mov Disord 21(5): 624–631. [DOI] [PubMed] [Google Scholar]
- Ostergaard K,Sunde NAa,Dupont E ( 2002): Effects of bilateral stimulation of the subthalamic nucleus in patients with severe Parkinson's disease and motor fluctuations. Mov Disord 17: 693–700. [DOI] [PubMed] [Google Scholar]
- Parent A,Hazrati LN ( 1995): Functional anatomy of the basal ganglia. II.The place of subthalamic nucleus and external pallidum in basal ganglia circuitry. Brain Res Rev 20: 128–154. [DOI] [PubMed] [Google Scholar]
- Payoux P,Remy P,Damier P,Miloudi M,Loubinoux I,Pidoux B,Gaura V,Rascol O,Samson Y,Agid Y ( 2004): Subthalamic nucleus stimulation reduces abnormal motor cortical overactivity in Parkinson disease. Arch Neurol 61: 1307–1313. [DOI] [PubMed] [Google Scholar]
- Pinto S,Thobois S,Costes N,Le Bars D,Benabid AL,Broussolle E,Pollak P,Gentil M ( 2004): Subthalamic nucleus stimulation and dysarthria in Parkinson's disease: A PET study. Brain 127 (Part 3): 602–615. [DOI] [PubMed] [Google Scholar]
- Rivest J,Quinn N,Gibbs J,Marsden C ( 1990): Unilateral abolition of extrapyramidal rigidity after ipsilateral cerebellar infarction. Mov Disord 5: 328–330. [DOI] [PubMed] [Google Scholar]
- Roland PE,Friberg L ( 1988): The effect of the GABA‐A agonist THIP on regional cortical blood flow in humans. A new test of hemispheric dominance. J Cereb Blood Flow Metab 8: 314–323. [DOI] [PubMed] [Google Scholar]
- Shmuel A,Augath M,Oeltermann A,Logothetis NK ( 2006): Negative functional MRI response correlates with decreases in neuronal activity in monkey visual area V1. Nat Neurosci 9: 569–577. [DOI] [PubMed] [Google Scholar]
- Strafella AP,Dagher A,Sadikot AF ( 2003): Cerebral blood flow changes induced by subthalamic stimulation in Parkinson's disease. Neurology 60: 1039–1042. [DOI] [PubMed] [Google Scholar]
- Takano B,Drzezga A,Peller M,Sax I,Schwaiger M,Lee L,Siebner HR ( 2004): Short‐term modulation of regional excitability and blood flow in human motor cortex following rapid‐rate transcranial magnetic stimulation. Neuroimage 23: 849–859. [DOI] [PubMed] [Google Scholar]
- Talairach J,Tournoux P ( 1988): A Co‐planar Stereotaxic Atlas of the Human Brain. Stuttgart: Thieme. [Google Scholar]
- Temperli P,Ghika J,Villemure J‐G,Burkhard PR,Bogousslavsky J,Vingerhoets FJG ( 2003): How do parkinsonian signs return after discontinuation of subthalamic deep brain stimulation? Neurology 60: 78–81. [DOI] [PubMed] [Google Scholar]
- The Deep‐Brain Stimulation for Parkinson's Disease Study Group ( 2001): Deep‐brain stimulation of the subthalamic nucleus or the pars interna of the globus pallidus in Parkinson's disease. N Engl J Med 345: 956–963. [DOI] [PubMed] [Google Scholar]
- Thobois S,Dominey P,Fraix V,Mertens P,Guenot M,Zimmer L,Pollak P,Benabid AL,Broussolle E ( 2002): Effects of subthalamic nucleus stimulation on actual and imagined movement in Parkinson's disease: A PET study. J Neurol 249: 1689–1698. [DOI] [PubMed] [Google Scholar]
- Trost M,Su S,Su P,Yen RF,Tseng HM,Barnes A,Ma Y,Eidelberg D ( 2006): Network modulation by the subthalamic nucleus in the treatment of Parkinson's disease. Neuroimage 31: 301–307. [DOI] [PMC free article] [PubMed] [Google Scholar]
- Turatto M,Sandrini M,Miniussi C ( 2004): The role of the right dorsolateral prefrontal cortex in visual change awareness. Neuroreport 15: 2549–2552. [DOI] [PubMed] [Google Scholar]
- Urbano F,Leznik E,Llinas R ( 2002): Cortical activation patterns evoked by afferent axons stimuli at different frequencies: An in vitro voltage‐sensitive dye imaging study. Thalamus Relat Sys 1: 371–378. [Google Scholar]
- Vitek JL ( 2002): Mechanisms of deep brain stimulation: Excitation or inhibition. Mov Disord 17 ( Suppl 3): S69–S72. [DOI] [PubMed] [Google Scholar]
- Watson CC,Newport D,Casey ME ( 1996): Scatter stimulation technique for scatter correction in 3D PET In: Grangeat P,Amans JL, editors. Three‐Dimensional Image Reconstruction in Radiology and Nuclear Medicine. Dordrecht: Kluwer Academic; pp. 255–268. [Google Scholar]
- Welter ML,Houeto JL,Tezenas du Montcel S,Mesnage V,Bonnet AM,Pillon B,Arnulf I,Pidoux B,Dormont D,Cornu P,Agid Y ( 2002): Clinical predictive factors of subthalamic stimulation in Parkinson's disease. Brain 125 (Part 3): 575–583. [DOI] [PubMed] [Google Scholar]
- Woods RP,Cherry SR,Mazziotta A ( 1992): Rapid automated algorithm for aligning and reslicing PET images. J Comput Assist Tomogr 16: 620–633. [DOI] [PubMed] [Google Scholar]
- Worsley KJ,Marrett S,Neelin P,Vandal AC,Friston KJ,Evans AC ( 1996): A unified statistical approach for determining significant signals in images of cerebral activation. Human Brain Mapp 4: 458–473. [DOI] [PubMed] [Google Scholar]
- Xi ZX,Wu G,Stein EA,Li SJ ( 2002): GABAergic mechanisms of heroin‐induced brain activation assessed with functional MRI. Magn Reson Med 48: 838–843. [DOI] [PubMed] [Google Scholar]
- Zhao YB,Sun BM,Li DY,Wang QS ( 2004): Effects of bilateral subthalamic nucleus stimulation on resting‐state cerebral glucose metabolism in advanced Parkinson's disease. Chin Med J (Engl) 117(9): 1304–1308. [PubMed] [Google Scholar]
Associated Data
This section collects any data citations, data availability statements, or supplementary materials included in this article.
Supplementary Materials
Additional Supporting Information may be found in the online version of this article.
Supporting Information Figure B
STN‐DBS settings in the 10 patients