Abstract
Though somatotypic representation within the face in human primary somatosensory cortex (S1) to innocuous stimuli is controversial; previous work suggests that painful heat is represented based on an “onion‐skin” or segmental pattern on the face. The aim of this study was to determine if face somatotopy for brush stimuli in S1 also follows this segmental representation model. Twelve healthy subjects (nine men: three women) underwent functional magnetic resonance imaging to measure blood oxygen level dependent signals during brush (1 Hz, 15 s) applied to their faces. Separate functional scans were collected for brush stimuli repetitively applied to each of five separate stimulation sites on the right side of the face. These sites were arranged in a vertical, horizontal, and circular manner encompassing the three divisions of the trigeminal nerve. To minimize inter‐individual morphological differences in the post‐central gyrus across subjects, cortical surface‐based registration was implemented before group statistical image analysis. Based on activation foci, somatotopic activation in the post‐central gyrus was detected for brush, consistent with the segmental face representation model. Hum Brain Mapp, 2009. © 2008 Wiley‐Liss, Inc.
Keywords: innocuous, mechanical, fMRI, trigeminal, brush
INTRODUCTION
In the human parietal somatosensory strip (often referred to as the primary somatosensory cortex [S1]), the face and hand have the largest cortical representations [Penfield and Rasmussen, 1950]. While somatotopic organization within the hand representation has been relatively well described [Francis et al., 2000; Gelnar et al., 1998; Kurth et al., 2000; Shoham and Grinvald, 2001], organization within the face representation in human S1 remains controversial. Electrophysiological recordings in primates suggest that the general location of the face representation in post‐central gyrus across different species of monkeys is consistent, but that the representation of cortical fields within the face can vary across species [Jain et al., 2001; Kaas et al., 1979; Merzenich et al., 1978; Nelson et al., 1980; Sur et al., 1982]. Direct electrical stimulation of the post‐central gyrus in humans has indicated that the contralateral face is represented up‐right, such that the superior surface of the face is represented in S1 superiorly to the inferior surface of the face [Penfield and Rasmussen, 1950]. This superior‐to‐inferior organization has been supported by several human intra‐operative optical imaging studies that electrically stimulated different parts of the face [Sato et al., 2002; Sato et al., 2005; Schwartz et al., 2004]. However, functional magnetic resonance imaging (fMRI) and magneto‐encephalography (MEG) studies have indicated other organizational possibilities for the face in S1, including an inverted representation [Servos et al., 1999; Yang et al., 1993] and a representation featuring spatial overlap [Iannetti et al., 2003; Nguyen et al., 2004], in addition to the “up‐right” representation [Huang and Sereno, 2007].
Another fMRI study, which used painful instead of innocuous stimuli, reported a representation that featured caudal components of the face represented in S1 superior relative to the more rostral facial components [DaSilva et al., 2002]. For example, stimulation near the nose was represented more inferiorly in the post‐central gyrus than to stimulation on the lower jaw or superior to the eye. This rostro‐caudal representation was considered to be related to the vertical arrangement of the stimulation sites within the segmental “onion skin” model [Kunc, 1970], which is likely determined by segmental inputs from the trigeminal nucleus [Borsook et al., 2004].
Although the face is innervated by the three main branches of the trigeminal nerve (ophthalmic, maxillary, and mandibular), the second‐order level of sensory processing that occurs in the trigeminal nucleus is organized in this segmental rostro‐caudal manner. That is, the information conveyed by the trigeminal nerve divisions appear to converge and is reorganized in the trigeminal nucleus, conforming to the “onion skin” model. This segmental organization of face representation may be conserved as sensory encoding progresses from the trigeminal nucleus to the ventroposterior medial thalamus and then to S1 [DaSilva et al., 2002].
The “onion skin” model presents an intriguing explanation for the variety of face S1 representations reported in previous studies, since it depends on the spatial distribution of stimuli with respect to a segmental pattern. Thus, stimulation of areas innervated by the same trigeminal nerve division across studies is not necessarily consistent, as these face areas may span several segmental representations (Fig. 1).
Figure 1.
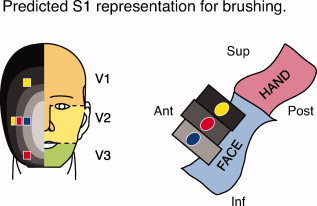
Hypothesized segmental representation model of the face in S1. Predicted somatotopic arrangement with multiple stimulus sites based on the “onion‐skin” model, which refers to the onion‐like segmental pattern of facial representation. On the schematic of the face, the yellow, blue, and red squares represent stimulation sites along the superior–inferior and medio‐lateral axes. The orange, yellow, and green face regions represent areas innervated by the ophthalmic (V1), maxillary (V2), and mandibular (V3) divisions of the trigeminal nerve, respectively. Concentric ovals in shades from light gray (rostral) to black (caudal) represent hypothesized rostro‐caudal segmental divisions of the face. The cartoon to the right represents a sagittal view of the primary somatosensory cortex (S1) in the left hemisphere (contralateral to the stimuli). Prior data suggest that different regions of the face are represented segmentally in S1. The gray rectangles portray the cortical fields that correspond to the different segmental divisions on the face illustration. For example, the blue stimulation site is located most rostral on the face, and is represented in a relatively inferior location in S1. Note that stimulus sites along the medio‐lateral surface of the face are within the same division of the trigeminal nerve (V2), but are predicted to have a segmental representation in S1. Stimulation sites may also span the same segmental divisions, as shown by stimulation sites colored identically. Adapted from DaSilva et al [2002].
This study used fMRI at 3 Tesla to test the hypothesis that the tactile face representation in human S1 is mapped in a segmental pattern, as previously suggested for painful heat [DaSilva et al., 2002]. The segmental model for touch in face S1 will be examined in depth, by including multiple stimulation sites predicted to lie within the same segmental divisions (Fig. 1). A segmental pattern of representation may be mapped by including stimulation sites along the superior‐inferior and rostro‐caudal axes of the face [Borsook et al., 2004]. Given the wide variation in sulcal geometry across individuals [Bushnell et al., 1999; Frackowiak et al., 2004], localization of group activation in S1 will be optimized by implementing surface‐based cortical mapping techniques [Dale et al., 1999; Fischl et al., 1999; Moore et al., 2000]. Such an approach affords a more precise and complete group picture of facial somatotopy in human S1 than previously reported.
METHODS
Subjects
Twelve healthy subjects (nine males, three females) were recruited through advertisements circulated in the Boston metropolitan area. All subjects provided informed consent to participate in this study. The subjects averaged 27 ± 10 (mean ± SD) years in age, and all were right‐handed. This study was approved by the McLean Hospital Institutional Review Board, and met the scientific and ethical guidelines for human research of the Helsinki Accord (http://ohsr.od.nih.gov/guidelines/helsinki.html).
Mechanical Stimulation
The brush stimulus was applied as the soft side of a Velcro strap. Stimulation consisted of 1 Hz brushing of a 20 mm × 16 mm area of skin along the superior–inferior axis of the face. The stimulation persisted for 15 s, and the time separating stimuli was 30 s. Brush stimuli were applied to the face using a lever system attached to a wooden frame overlying the MRI headcoil (Fig. 2).
Figure 2.
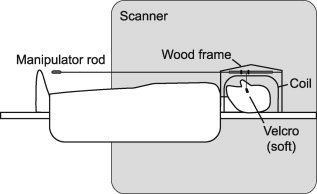
MRI‐compatible brush lever system. Velcro was attached to a lever that could be variably positioned on the face to make firm and stable contact with the skin. Plastic/nylon rods attached to the lever allowed us to brush the face while standing at the feet of the subject. Thus, there was no manual reaching into the head coil, and most movement occurred well away from the brain. The motion of the rod was limited using plastic stoppers (black) such that brushing only occurred along the 20 mm length of the stimulation site.
SCANNING EXPERIMENTAL PARADIGM
Each subject underwent five fMRI scans, each consisting of innocuous brushing of one of five sites on right side of the face (see Fig. 3 for locations of R1‐R5). The placement of these sites was not guided by a priori knowledge of the segmental divisions of the face per se, but rather by their potential to identify potential segmental divisions by positioning them on superior‐to‐inferior and medial‐to‐lateral axes of the face. The onion‐skin model will be used to interpret the patterns of somatotopic activations elicited by the variety of stimulation sites on the face. The order of the scans was as follows: R4, R3, R5, R2, and R1. Each scan consisted of a 55‐s baseline period followed by three stimulus cycles, as described above.
Figure 3.
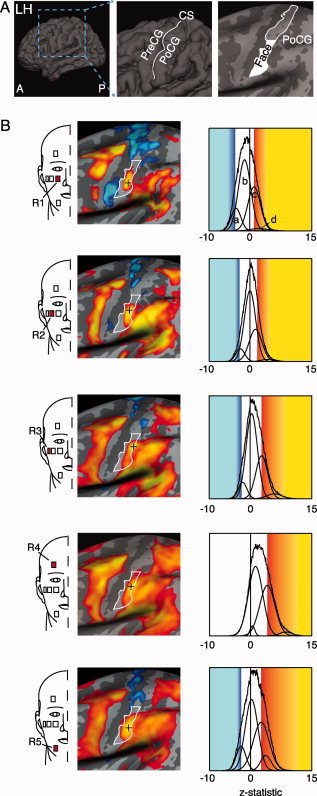
Localization of brush activation in left S1. (A) The first image is a reconstruction of the left hemisphere (LH) of an average brain (n = 12 subjects) subsequent to co‐registration using cortical surface‐based alignment via Freesurfer. A = anterior and P = posterior. The middle image is a magnified view of the central sulcus (CS) with labels for precentral gyrus (PreCG) and post‐central gyrus (PoCG). The image on the right is a brain that has been “inflated” to better visualize gray matter within the sulci, such that gyri are colored light gray and sulci are dark gray. This image highlights the approximate face representation in S1 as the inferior half of the PoCG. B) Group brush activation maps across stimulation sites. Red squares identified by number indicate the location of each stimulus. Significant positive (red to yellow) and negative activation levels (dark blue to light blue) based on stimulus‐based GLM analyses are displayed. Black crosses indicate the activation maxima. For visual presentation purposes, the group statistical maps were spatially smoothed using a 3.5 mm FWHM kernel. The z‐statistic distribution for each activation map is shown to the right. The y‐axis represents the relative population distribution. Z‐statistic thresholds were determined using GMM (Gaussian mixture modeling), which identified distinct distributions (modeled as gaussian curves) for positive and negative activations. The entire set of gaussian distributions for activation for each stimulus site is displayed in each graph. In region 1, four distributions were detected using GMM, with distributions for negative activation (a), noise (b), and positive activation (c, d). The threshold for significant activation was identified as the mode of the dominant positive and negative distributions. If the mode of the positive or negative distribution was below the relative contribution of the null distribution, the activation distribution was considered not significant. For further details on GMM, refer to [Becerra et al., 2006; Moulton et al., 2007; Pendse et al., 2006].
DATA ACQUISITION AND ANALYSIS
Image Acquisition
Imaging was realized using a 3T Siemens Trio scanner with a quadrature head coil. Anatomical images were acquired using a magnetization prepared rapid gradient echo (MPRAGE) sequence [128 1.33 mm‐thick slices with an in‐plane resolution of 1 mm (256 × 256)]. These anatomical images were used to generate cortical surface‐based reconstructions for each subject [Dale et al., 1999; Dale and Sereno, 1993]. Magnitude and Phase images were acquired to unwarp all functional scans, so as to improve co‐registration of the whole‐brain anatomical and functional scans. Slice location, number, and thickness were the same as the ones used in the functional scans. Functional scans were acquired in the order described above. Each functional scan consisted of 33 slices coronally oriented to match the brainstem axis and covering the middle region of the cerebrum. Slices were 3.5‐mm thick with in‐plane resolution of 3.5 mm (64 × 64). Although a higher spatial resolution would be theoretically ideal for investigating somatotopy, this would also result in a lower contrast‐to‐noise ratio and the resulting statistics would be weaker. A Gradient Echo (GE) echo planar imaging (EPI) sequence with TE/TR = 30/2,500 was used to acquire the data. Seventy‐four volumes were captured for each functional scan, resulting in a scan time of 3:05.
Individual Subject Level Image Processing
Functional imaging datasets were processed and analyzed using scripts within FSL 4.0 (FMRIB's Software Library, http://www.fmrib.ox.ac.uk/fsl [Smith et al., 2004]). The initial two volumes were removed from each of the functional scans to allow for signal equilibration. Visual screening of the functional volumes revealed that none of the subjects showed indications of gross movement (>1 voxel). The skull and other nonbrain areas were extracted from the anatomical and functional scans using FSL's script brain extraction tool (BET). Motion Correction using FMRIB's linear image registration tool (MCFLIRT) was performed on each functional scan. The functional scans were unwarped using FMRIB's utility for geometrically unwarping EPIs (FUGUE), and all volumes were mean‐based intensity normalized by the same factor. The volumes were spatially smoothed with a 5 mm full‐width at half‐maximum filter, and a 75 s high‐pass temporal filter was applied. These functional images were then co‐registered with the anatomical images using FMRIB's linear image registration tool (FLIRT).
First‐level fMRI analysis of single subject data was performed using FMRI Expert Analysis Tool using FMRIB's improved Linear model (FEAT FILM) Version 5.4 with local autocorrelation correction [Woolrich et al., 2001]. The explanatory variables (EVs) for brushing stimuli were entered as boxcar functions, and EVs were generated for the temporal derivatives of the brush timings. The EVs were convolved with a gamma function incorporating a 3‐s standard deviation and a 6‐s hemodynamic lag.
Group Level Whole‐Brain Image Analysis
For group analysis, individual statistics were registered to a three‐dimensional rendering of the average cortical surface reconstruction of the subjects' brains via Freesurfer 4.0.1 ((http://surfer.nmr.mgh.harvard.edu) [Fischl et al., 1999]). This spatial standardization method registers brains with respect to the alignment of their sulci, and has been previously used to localize fMRI activation within the post‐central gyrus [Moore et al., 2000]. In this spatial‐coordinate system, group activation maps for each stimulus condition were generated by fMRI expert analysis tool (FEAT) fMRIB's local analysis of mixed effects (FLAME). The statistical maps were thresholded using Gaussian Mixture Modeling (GMM), a multiple comparisons‐based analysis, to identify categories of activated and deactivated voxels [Becerra et al., 2006; Moulton et al., 2007; Pendse et al., 2006]. GMM was used as assumptions required for conventional thresholding methods were violated, as the distribution of z‐statistic values were not centered at zero and were non‐gaussian.
SEPARATION BETWEEN ACTIVATION FOCI
To determine the separability of activation foci in the group activation maps, the distribution of distances between activations for each pair of stimulation sites was identified in MNI305 space. For each stimulation site, activation was sampled based on the top 5% of z‐statistic values relative to the activation maxima in post‐central gyrus. The distribution of distances that separated the top 5% of activations of stimulus site pairs was generated using a boot‐strapping approach (10,000 iterations). From these distributions, the mean distance between activations in each pair of stimulus sites was calculated, and the percent of separations greater than 5 mm between site activations was measured. If more than 50% of the separation distribution for a pair of sites was greater than 5 mm (the smoothing value), then they were deemed significantly distinguishable.
Single Trial Average Analysis
Single trial average analysis (STAs) were calculated using in‐house programs implemented via MATLAB (Release 7.2, Mathworks Inc., Natick, MA) in combination with functional time courses and activation maps. The spatial mask used to calculate STAs were based on group activation in S1. To define distinct S1 clusters in the group activation maps, thresholds were raised above the GMM‐determined thresholds until activation in S1 was clearly separate from neighboring activation clusters. These spatial masks were defined on the average cortical surface‐based brain map, and transformed onto the spatial dimensions of the functional scans acquired for each subject. Within each spatial mask, the mean time course was extracted from each subject's mean‐based intensity‐normalized functional image. The EVs for each stimulus were used to define each specific “trial”. A trial was defined as the period consisting of 12.5 s prior to the beginning of the stimulus, and 32.5 s immediately following the beginning of the stimulus. This captured the duration of a stimulus response and its recovery without overlapping in time with the following stimulus. A trial average was calculated for each stimulus by taking the average time course of the all three trials. To measure a group STA response, the average and standard error at each time point of every subject's trial average was calculated.
RESULTS
fMRI Activation Maps
For each part of the face stimulated, brushing produced a cluster of significant positive activation within the cortical field of the face in the contralateral post‐central gyrus (Fig. 3). In addition, single trial average responses measured in post‐central gyrus during stimulation of each facial site were robust and comparable in temporal profile (Fig. 4). Stimulation of each facial site also consistently activated other structures outside of the post‐central gyrus, including the motor cortex, premotor cortex, the ventral intraparietal area (VIP), and the parietal operculum.
Figure 4.
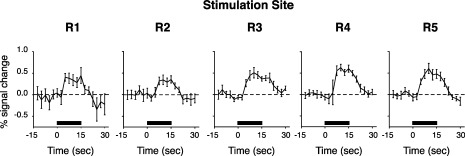
Single trial averages for brush activation across the different face stimulation sites. The black bar in each trial average indicates application of the brush stimuli. The STA response was shifted in the y‐axis for each stimulus condition, such that the median of the five pre‐stimulus time points was set to zero. Mean ± SE.
The coordinates of the activation maxima for each stimulation site, as recorded in MNI305 space (Table I), were spatially distinct in nearly every case (Table II). The majority of region pairs were separated by more than 5 mm (Table III), the full‐width at half maximum value of the spatial smoothing kernel. Region pairs that were separated by more than 5 mm were interpreted as lying in separate segmental divisions, while those pairs within 5 mm of each other were interpreted as being within the same segmental division. The activation maxima were aligned from inferior to superior portions of the post‐central gyrus in relation to the rostrocaudal segmental location of the stimulation sites on the face (Fig. 5A). Ipsilateral S1 did not show consistent focal activation with stimulation across the different facial sites.6
Table I.
Spatial coordinates of brush activation maxima in MNI305 space
| Condition | Peak z‐statistic | x | y | z |
|---|---|---|---|---|
| R1 | 3.80 | −61.7 | −10.5 | 34.4 |
| R2 | 4.66 | −59.7 | −14.9 | 41.3 |
| R3 | 8.46 | −55.6 | −18.6 | 39.8 |
| R4 | 11.36 | −59.0 | −16.2 | 41.3 |
| R5 | 11.51 | −61.5 | −12.3 | 35.5 |
Table II.
Mean distance and standard deviation between top 5% of activation (mm)
| R1 | R2 | R3 | R4 | R5 | |
|---|---|---|---|---|---|
| R1 | — | 5.4 (2.9)* | 10.5 (1.7)* | 9.2 (1.8)* | 3.1 (1.7) |
| R2 | — | — | 6.3 (2.5)* | 4.9 (2.4) | 4.0 (2.4) |
| R3 | — | — | — | 3.0 (1.6) | 8.4 (2.1)* |
| R4 | — | — | — | — | 7.0 (2.1)* |
| R5 | — | — | — | — | — |
indicates >5 mm.
Table III.
Percent of separation greater than 5 mm between top 5% of activation (mm)
| R1 | R2 | R3 | R4 | R5 | |
|---|---|---|---|---|---|
| R1 | — | 51.4* | 100.0* | 97.8* | 17.3 |
| R2 | — | — | 70.9* | 47.6 | 26.8 |
| R3 | — | — | — | 12.4 | 96.9* |
| R4 | — | — | — | — | 79.7* |
| R5 | — | — | — | — | — |
indicates spatially distinguishable representations.
Figure 5.
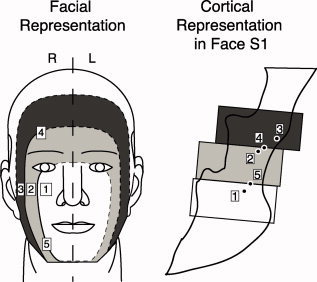
Schematic segmental representation of the face observed in S1. Brushing of different facial sites produced activation with foci that supports the segmental organization of face representation in S1. The black/white dots represent positive activation foci identified for each stimulation site for the group. Dashed lines in the concentric ovals indicate putative extrapolated segmental boundaries.
Figure 6.
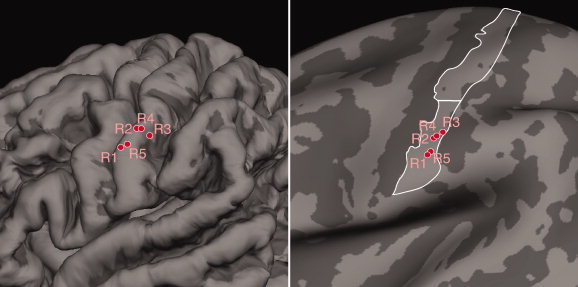
Localization of activation foci on the averaged brain. The image on the left portrays the pial surface of the average brain (n = 12 subjects) reconstructed using Freesurfer (Fischl et al., 1999), to highlight the three‐dimensional gyral and sulcal patterns. Foci and labels colored red indicate positive activation maxima. The image on the right is the inflated surface of the average brain.
DISCUSSION
The topography of activation foci in post‐central gyrus elicited by brushing support the segmental “onion‐skin” model of facial somatotopy [Kunc 1970). The single trial average responses indicated that brushing elicited reproducible temporal patterns of activation across the different stimulus sites. Brush stimuli applied to the more rostral components of the face were represented in S1 inferior and lateral to the more caudal face areas. In addition, areas stimulated within an onion‐skin layer, even though at separate stimulation sites (and innervated by different branches of the trigeminal nerve), were closely represented in the cortex (Fig. 5). In macaque monkeys, electrophysiological investigation of cortical representation of the face and intra‐oral representation in Brodmann Area 3b (BA 3b, also known as “SI proper”) has also shown a similar pattern of organization [Manger et al., 1996]; with a superior‐to‐inferior progression of cortical representation from the lower jaw to dorsolateral face to peri‐oral regions. While this organization in humans has been suggested previously for heat pain [DaSilva et al., 2002], this study has extended our previous findings to innocuous stimuli using a more thorough mapping of the face, as well as a cortical surface‐based fMRI analysis.
Activation maxima for brushing were located on the crown of the post‐central gyrus, tending towards the bank of the post‐central sulcus. The foci for brush activation roughly corresponds to BA 1 (or the “posterior cutaneous field”), based on probabilistic cytoarchitectonic maps generated from post‐mortem human brains [Geyer et al., 2000]. Note, however, that the spatial extent of activation for each stimulus site overlies several Brodmann regions, including BA 3b and 2. Electrophysiological recordings in primates have identified separate somatotopic representations to cutaneous stimuli in BA 3b, 1, and 2 [Kaas et al., 1979; Merzenich et al., 1978; Nelson et al., 1980; Pons et al., 1985; Sur et al., 1982]. These multiple representations have also been found to lie in close proximity to each other, and the cortical fields for BA 3b and 1 can appear as mirror‐image representations of each other as divided by their shared border. Although the potential involvement of BA 3b, 1, and 2 might suggest the presence of three hypothetically separable activation foci for a given brushing stimulus, only one foci per activation cluster was observable in this study. The likely coincident activation of each of these representations with innocuous brushing may contribute to the robust BOLD response observed across the extent of the post‐central gyrus. Thus, the observed activation is potentially a composite of activation in all three areas.
Other than S1, brushing also consistently produced activation in motor and premotor cortices, the VIP, and the parietal operculum. These areas have previously been shown to respond to tactile stimuli, each with varying capacities to encode somatotopy.
Somatotopic Variation in Human Studies
A segmental somatotopic representation may explain the variation reported in prior studies considering face S1 somatotopy using non‐noxious stimuli [Huang and Sereno, 2007; Iannetti et al., 2003; Penfield and Rasmussen, 1950; Sato et al., 2002; Sato et al., 2005; Schwartz et al., 2004; Servos et al., 1999]. Direct electrical stimulation of post‐central gyrus indicated an up‐right representation when considering the lip (rostral) vs. the forehead (caudal) [Penfield and Rasmussen, 1950], which is consistent with this proposed segmental organization. An intraoperative optical topography imaging study that clearly marked its stimulation sites in peri‐orbital and peri‐buccal areas is also consistent with this study, as the comparison was similarly caudal vs. rostral [Schwartz et al., 2004].
Comparison across studies that defined facial stimulation sites based on trigeminal divisions is more difficult [Huang and Sereno, 2007; Sato et al., 2002; Sato et al., 2005; Servos et al., 1999], as a single trigeminal division can span several layers of the onion‐skin representation (Fig. 1). An fMRI study that identified near complete representational overlap in contralateral S1 when comparing lip vs. forehead can at least be partly attributed to analysis methodology [Iannetti et al., 2003]; when the spatial extent of brush activation in the present study is considered instead of activation maxima, much spatial overlap in activation is observed across the stimulation sites. As summarized previously [Borsook et al., 2004], the site of stimulation may also produce overlapping or segregated activations.
An important caveat to this study is that the pattern of the activation foci described herein is based on group analysis. Although not presented here, reliable fMRI detection of face somatotopy within single subjects was not indicated by our data. For this study, a group level approach may be a more reliable measure of the generalized pattern of somatotopic activation than the single subject fMRI data, which exhibited poor signal‐to‐noise ratios. Indeed, the group results suggest that the peaks of the activation distributions for the stimulus sites are in different locations for this subject sample. However, somatotopy may be detectable in single subjects using an experimental design that utilizes more stimulation blocks than used in the present study.
Note that while the Z‐score thresholds for each stimulation condition decreased with the order of the functional scans, indicating an order effect, this was accounted for by the GMM thresholding method. Although order should not influence the location of activation, it did influence the activation strength for each stimulation condition. GMM appeared to be successful in minimizing the effect of the variation in the Z‐score distributions, as suggested by the spatial similarity of the activation maps for each of the stimulus sites (Fig. 3). This normalization of the activation maps is notable not only in the post‐central gyrus, but also in the surrounding regions and in regards to general noise level.
CONCLUSIONS
The data presented here support the segmental “onion‐skin” model of S1 representation for innocuous brushing. Although the overall cortical representations of the different sites on the face spatially overlapped in S1, the activation foci corresponding to each site were arranged as predicted by the segmental model. The sensitivity of the approach may lend itself to studies that map alterations of sensory inputs in neuropathic conditions of the face in a similar manner to that observed in phantom limb pain [Flor et al., 2006] patients. Measures of this plasticity may prove useful in measures of efficacy of clinical interventions [Flor and Birbaumer, 2000].
REFERENCES
- Becerra L,Morris S,Bazes S,Gostic R,Sherman S,Gostic J,Pendse G,Moulton E,Scrivani S,Keith D,Chizh B,Borsook D ( 2006): Trigeminal neuropathic pain alters responses in CNS circuits to mechanical (brush) and thermal (cold and heat) stimuli. J Neurosci 26: 10646–10657. [DOI] [PMC free article] [PubMed] [Google Scholar]
- Borsook D,Burstein R,Becerra L ( 2004): Functional imaging of the human trigeminal system: Opportunities for new insights into pain processing in health and disease. J Neurobiol 61: 107–125. [DOI] [PubMed] [Google Scholar]
- Bushnell MC,Duncan GH,Hofbauer RK,Ha B,Chen JI,Carrier B ( 1999): Pain perception: Is there a role for primary somatosensory cortex? Proc Natl Acad Sci USA 96: 7705–7709. [DOI] [PMC free article] [PubMed] [Google Scholar]
- Dale AM,Fischl B,Sereno MI ( 1999): Cortical surface‐based analysis. I. Segmentation and surface reconstruction. NeuroImage 9: 179–194. [DOI] [PubMed] [Google Scholar]
- Dale AM,Sereno MI ( 1993): Improved localization of cortical activity by combining EEG and MEG with MRI cortical surface reconstruction: A linear approach. J Cogn Neurosci 5: 162–176. [DOI] [PubMed] [Google Scholar]
- DaSilva AF,Becerra L,Makris N,Strassman AM,Gonzalez RG,Geatrakis N,Borsook D ( 2002): Somatotopic activation in the human trigeminal pain pathway. J Neurosci 22: 8183–8192. [DOI] [PMC free article] [PubMed] [Google Scholar]
- Eickhoff SB,Grefkes C,Zilles K,Fink GR ( 2007): The somatotopic organization of cytoarchitectonic areas on the human parietal operculum. Cereb Cortex 17: 1800–1811. [DOI] [PubMed] [Google Scholar]
- Fischl B,Sereno MI,Tootell RB,Dale AM ( 1999): High‐resolution intersubject averaging and a coordinate system for the cortical surface. Hum Brain Mapp 8: 272–284. [DOI] [PMC free article] [PubMed] [Google Scholar]
- Flor H,Birbaumer N ( 2000): Phantom limb pain: Cortical plasticity and novel therapeutic approaches. Curr Opin Anaesthesiol 13: 561–564. [DOI] [PubMed] [Google Scholar]
- Flor H,Nikolajsen L,Staehelin Jensen T ( 2006): Phantom limb pain: A case of maladaptive CNS plasticity? Nat Rev Neurosci 7: 873–881. [DOI] [PubMed] [Google Scholar]
- Frackowiak RS,Ashburner JT,Penny WD,Zeki S,Friston KJ,Frith CD,Dolan RJ,Price CJ ( 2004): Human Brain Function. San Diego: Academic Press. [Google Scholar]
- Francis ST,Kelly EF,Bowtell R,Dunseath WJ,Folger SE,McGlone F ( 2000): fMRI of the responses to vibratory stimulation of digit tips. NeuroImage 11: 188–202. [DOI] [PubMed] [Google Scholar]
- Gelnar PA,Krauss BR,Szeverenyi NM,Apkarian AV ( 1998): Fingertip representation in the human somatosensory cortex: An fMRI study. NeuroImage 7(Part 1): 261–283. [DOI] [PubMed] [Google Scholar]
- Geyer S,Schormann T,Mohlberg H,Zilles K ( 2000): Areas 3a, 3b, and 1 of human primary somatosensory cortex, Part 2. Spatial normalization to standard anatomical space. NeuroImage 11(Part 1): 684–696. [DOI] [PubMed] [Google Scholar]
- Huang RS,Sereno MI ( 2007): Dodecapus: An MR‐compatible system for somatosensory stimulation. NeuroImage 34: 1060–1073. [DOI] [PubMed] [Google Scholar]
- Iannetti GD,Porro CA,Pantano P,Romanelli PL,Galeotti F,Cruccu G ( 2003): Representation of different trigeminal divisions within the primary and secondary human somatosensory cortex. NeuroImage 19: 906–912. [DOI] [PubMed] [Google Scholar]
- Jain N,Qi HX,Catania KC,Kaas JH ( 2001): Anatomic correlates of the face and oral cavity representations in the somatosensory cortical area 3b of monkeys. J Comp Neurol 429: 455–468. [DOI] [PubMed] [Google Scholar]
- Kaas JH,Nelson RJ,Sur M,Lin CS,Merzenich MM ( 1979): Multiple representations of the body within the primary somatosensory cortex of primates. Science New York 204: 521–523. [DOI] [PubMed] [Google Scholar]
- Kunc Z ( 1970): Significant factors pertaining to the results of trigeminal tractotomy In: Hassler R,Walker A, editors. Trigeminal neuralgia, pathogenesis and pathophysiology. Stuttgart: Thieme; pp 90–100. [Google Scholar]
- Kurth R,Villringer K,Curio G,Wolf KJ,Krause T,Repenthin J,Schwiemann J,Deuchert M,Villringer A ( 2000): fMRI shows multiple somatotopic digit representations in human primary somatosensory cortex. Neuroreport 11: 1487–1491. [PubMed] [Google Scholar]
- Manger PR,Woods TM,Jones EG ( 1996): Representation of face and intra‐oral structures in area 3b of macaque monkey somatosensory cortex. J Comp Neurol 371: 513–521. [DOI] [PubMed] [Google Scholar]
- Merzenich MM,Kaas JH,Sur M,Lin CS ( 1978): Double representation of the body surface within cytoarchitectonic areas 3b and 1 in "SI" in the owl monkey (Aotus trivirgatus). J Compar Neurol 181: 41–73. [DOI] [PubMed] [Google Scholar]
- Moore CI,Stern CE,Corkin S,Fischl B,Gray AC,Rosen BR,Dale AM ( 2000): Segregation of somatosensory activation in the human rolandic cortex using fMRI. J Neurophysiol 84: 558–569. [DOI] [PubMed] [Google Scholar]
- Moulton EA,Pendse G,Morris S,Strassman A,Aiello‐Lammens M,Becerra L,Borsook D ( 2007): Capsaicin‐induced thermal hyperalgesia and sensitization in the human trigeminal nociceptive pathway: An fMRI study. NeuroImage 35: 1586–1600. [DOI] [PMC free article] [PubMed] [Google Scholar]
- Nelson RJ,Sur M,Felleman DJ,Kaas JH ( 1980): Representations of the body surface in postcentral parietal cortex of Macaca fascicularis. J Compar Neurol 192: 611–643. [DOI] [PubMed] [Google Scholar]
- Nguyen BT,Tran TD,Hoshiyama M,Inui K,Kakigi R ( 2004): Face representation in the human primary somatosensory cortex. Neuroscience Res 50: 227–232. [DOI] [PubMed] [Google Scholar]
- Pendse G,Moulton EA,Borsook D,Becerra LR ( 2006): A generalized mixture modeling approach applied to the problem of thresholding fMRI statistical maps. Soc Neurosci 36: 492.5. Online. [Google Scholar]
- Penfield W,Rasmussen T ( 1950): Secondary Sensory and Motor Representation. The Cerebral Cortex of Man: A Clinical Study of Localization of Function. New York: Macmillan; pp 109–134. [Google Scholar]
- Pons TP,Garraghty PE,Cusick CG,Kaas JH ( 1985): The somatotopic organization of area 2 in macaque monkeys. J Comp Neurol 241: 445–466. [DOI] [PubMed] [Google Scholar]
- Sato K,Nariai T,Sasaki S,Yazawa I,Mochida H,Miyakawa N,Momose‐Sato Y,Kamino K,Ohta Y,Hirakawa K,Ohno K ( 2002): Intraoperative intrinsic optical imaging of neuronal activity from subdivisions of the human primary somatosensory cortex. Cerebral Cortex 12: 269–280. [DOI] [PubMed] [Google Scholar]
- Sato K,Nariai T,Tanaka Y,Maehara T,Miyakawa N,Sasaki S,Momose‐Sato Y,Ohno K ( 2005): Functional representation of the finger and face in the human somatosensory cortex: Intraoperative intrinsic optical imaging. NeuroImage 25: 1292–1301. [DOI] [PubMed] [Google Scholar]
- Schwartz TH,Chen LM,Friedman RM,Spencer DD,Roe AW ( 2004): Intraoperative optical imaging of human face cortical topography: A case study. Neuroreport 15: 1527–1531. [DOI] [PubMed] [Google Scholar]
- Servos P,Engel SA,Gati J,Menon R ( 1999): fMRI evidence for an inverted face representation in human somatosensory cortex. Neuroreport 10: 1393–1395. [DOI] [PubMed] [Google Scholar]
- Shoham D,Grinvald A ( 2001): The cortical representation of the hand in macaque and human area S‐I: high resolution optical imaging. J Neurosci 21: 6820–635. [DOI] [PMC free article] [PubMed] [Google Scholar]
- Smith SM,Jenkinson M,Woolrich MW,Beckmann CF,Behrens TE,Johansen‐Berg H,Bannister PR,De Luca M,Drobnjak I,Flitney DE,Niazy RK,Saunders J,Vickers J,Zhang Y,De Stefano N,Brady JM,Matthews PM ( 2004): Advances in functional and structural MR image analysis and implementation as FSL. Neuroimage 23 ( Suppl 1): S208–S219. [DOI] [PubMed] [Google Scholar]
- Sur M,Nelson RJ,Kaas JH ( 1982): Representations of the body surface in cortical areas 3b and 1 of squirrel monkeys: Comparisons with other primates. J Compar Neurol 211: 177–192. [DOI] [PubMed] [Google Scholar]
- Woolrich MW,Ripley BD,Brady M,Smith SM ( 2001): Temporal autocorrelation in univariate linear modeling of FMRI data. Neuroimage 14: 1370–1386. [DOI] [PubMed] [Google Scholar]
- Yang TT,Gallen CC,Schwartz BJ,Bloom FE ( 1993): Noninvasive somatosensory homunculus mapping in humans by using a large‐array biomagnetometer. Proc Natl Acad Sci USA 90: 3098–3102. [DOI] [PMC free article] [PubMed] [Google Scholar]


