

Abstract
Objectives: There is a lot of variability between the results of studies reporting the pattern of gray matter volume changes in schizophrenia. Methodological issues may play an important role in this heterogeneity. The aim of the present study was to replicate the better performance of multivariate “source‐based morphometry” (SBM) over the mass‐univariate approach. Experimental design: Voxel‐based morphometry of Jacobian‐modulated gray matter volume images, using voxel and cluster level inference, and SBM were performed in a group of first‐episode schizophrenia patients (N = 49) and healthy controls (N = 127). Results: Using SBM we were able to find a significant reduction of gray matter volume in fronto‐temporo‐cerebellar areas whereas no significant results were obtained using voxel‐based morphometry. Conclusion: Multivariate analysis of gray matter volume seems to be a suitable method for characterization of the pattern of changes at the beginning of the illness in schizophrenia subjects. Hum Brain Mapp, 2010. © 2009 Wiley‐Liss, Inc.
Keywords: schizophrenia, gray matter, morphometry
INTRODUCTION
Schizophrenia is a condition with a complex neurobiology. The pathological processes include changes in the gray matter of the brain. Post‐mortem studies have reported findings of reductions of cortical thickness and neuropil loss not only in heteromodal cortex, but also in primary sensory areas [Harrison, 1999; Selemon et al., 1995]. These findings were accompanied by changes in GABA‐ergic interneurons [Lewis et al., 2005] as well as some reports of the loss of glia cells [Cotter et al., 2001]. Functionally, these changes could be reflected in many features as seen in schizophrenia, including the decreased ability of spatially distant areas of the brain to synchronize their activity (disconnectivity).
Neuroimaging methods have also been able to detect changes of gray matter in subjects suffering from schizophrenia. Many studies reported changes in cortical thickness, gray matter concentration, or gray matter volume (for a systematic review see Honea et al., 2005]. Recently, a meta‐analysis of studies that examined gray matter volume or concentration in schizophrenia was published [Ellison‐Wright et al., 2008]. Both gray matter reduction and increase were detected. Gray matter reduction was quite widespread, affecting both heteromodal associative cortex and primary sensory and motor areas. Interestingly, gray matter was increased not only in basal ganglia—a possible effect of certain antipsychotic agents, with the most evidence available for the effect of classical neuroleptics—but also in many cortical areas: BA 4, 6, 8, 9, 17, 18, 22, and 40.
Gray matter reduction is present from the beginning of the illness [Kasparek et al., 2007; Ellison‐Wright et al., 2008]. There is growing evidence of further progression of gray matter reduction following the first episode (for review see [van Haren et al., 2008]. It is important to note that chronically ill may constitute selected population of only severe cases, where behavioral changes linked with chronic psychotic illness, long‐term exposure to medication and other factors may all have adverse effect on the brain morphology. First‐episode subjects, on the other hand, may be quite heterogeneous group, composed of subjects with variable outcomes. If these findings hold true, there might be smaller changes in first episode subjects than in chronic patients, at least in a certain subgroup, or we may encounter high variability of brain morphology in the whole group of first‐episode patients. This might complicate detection of the changes at the beginning of the illness and the sensitivity of the method becomes a key factor.
Although the evidence for the gray matter changes in schizophrenia is unquestionable, the exact extent and location of the changes has not been clearly established. There are many factors that confound the picture, such as clinical heterogeneity. Moreover, methodological issues may contribute in a significant way. Most of the data on the pattern of gray matter changes comes from studies employing mass‐univariate techniques—that is, the image of the brain is divided into basic units of volume (voxels) and a statistical analysis is performed for every individual voxel, without taking into account the information regarding its surroundings. Moreover, in high‐resolution images of the brain, millions of individual tests have to be performed which requires stringent methods of multiple comparisons correction to prevent the inflation of false positive results. This holds true for traditional voxel‐level inference [Worsley et al., 1996]—where correction methods might be too stringent for morphological data because of the presence of higher spatial frequencies in the structural maps [Sowell et al., 1999]. Quite recently, after clarification of some methodological problems (such as the problem of local smoothness inhomogeneity), so called cluster level analysis, i.e. analysis based on the spatial extent of clusters of significant voxels, is being accepted [Friston et al., 1996]. That is, the inference is not based on highly significant, but possibly isolated voxels, but rather on large groups of voxels. Such groups of voxels may represent more neurobiologically meaningful portions of tissue. Different image preprocessing steps may also influence the ability to detect changes using univariate parametric methods: In the case of voxel‐based morphometry, two parameters could be analyzed: gray matter concentration and volume. After image registration, tissue classification (segmentation) and smoothing the value of individual voxels represents a fraction of particular tissue in a given location. This fraction is interpreted as “concentration of a tissue in particular voxel”, i.e. the proportion of gray matter to all other tissue types within a voxel. During the registration and spatial transformation to the standard space some parts of the brain are extended, some shrunk, and the information about volume differences is lost. Multiplication of the voxel value (“concentration”) by the parameters of relative volume changes of particular region, so called modulation by Jacobian of spatial transormation to the standard space, corrects this loss of information and gives “volume of a tissue” in particular voxel [Mechelli et al., 2005]. Meda et al. [Meda et al., 2008] demonstrated that the modulation step, used for local volume analysis, introduced a substantial amount of variability that rendered the results insignificant—in contrast to “concentration” measures where similar patterns of changes reached a significant level.
The utility of mass‐univariate approaches has been questioned several times—the issues of sensitivity or the ability to correctly characterize inherently multivariate brain morphology have been raised [Davatzikos, 2004; Davatzikos, 2004; Friston and Ashburner, 2004]. It was proposed that multivariate techniques may provide more valid information about brain morphology.
Several multivariate morphological studies (based on different techniques of feature extraction and pattern classification, used primarily to classify the groups of subjects based on morphological patterns) were already performed with subjects suffering from schizophrenia [Fan et al., 2007; Fan et al., 2008; Kawasaki et al., 2007]. Recently, the adoption of a powerful multivariate technique—Independent Component Analysis—for morphological data was published—the authors called the technique “Source‐based Morphometry” (SBM). In patients with chronic schizophrenia, the technique was more powerful than the univariate approach—voxel‐based morphometry—in the identification of gray matter changes [Xu et al., 2009]. The method is based on finding of independent patterns in gray matter images and consequent statistical analysis based on the comparison of the expression of the patterns in individual groups. Although SBM is also dealing with the groups of voxels, the nature of the method is quite different from the cluster‐level analysis in VBM. SBM groups voxels with similar pattern of variance (resulting in several “components”). Then, the magnitude of expression of individual components in every subject is given (component value) and the statistical analysis is performed based on the comparisons of component values for all components extracted. This approach leads to significant reduction of the severity of multiple comparisons correction, and, more importantly, uses information about the whole patterns of brain morphology, not only about individual voxels. In contrast, cluster‐level VBM deals with spatially interconnected groups of voxels that survived an arbitrary “cluster‐defining” threshold. The significance value of individual voxels in VBM is dependent on the general linear model, therefore, it is noise‐dependent and high variability may lead to the failure of a voxel to reach significance. This is not the case of SBM, which is based on a “noise‐free” technique—ICA—that deals only with the structure of variance in the data. Taken together, multivariate techniques, such as SBM, may be superior to mass‐univariate methods using either voxel or cluster level of inference.
The aim of this study was to replicate the improved performance of SBM over mass‐univariate voxel‐wise analysis of gray matter volume in a group of first‐episode schizophrenia patients.
METHODS
Subjects
First‐episode schizophrenia subjects
Forty‐nine patients (mean age, 23.6; SD, 4.6) admitted to the all‐males unit of the Department of Psychiatry, Masaryk University in Brno, with first‐episode schizophrenia, were recruited. The diagnosis was established during clinical interview guided by the International Statistical Classification of Disease and Related Health Problems (ICD‐10) research criteria, by two trained senior psychiatrists. The majority of the patients suffered from Paranoid schizophrenia (82%), only a small fraction of subjects were treated for Undifferentiated or Simplex schizophrenia. The duration of the illness prior to the start of antipsychotic treatment was 6.2 months (SD, 10.1). The course of treatment and dosing followed general clinical recommendations—psychotropic medication included antipsychotics, benzodiazepines, hypnotics, and anticholinergic antiparkinsonics. All subjects were treated with the second generation antipsychotics prior to MRI examination. Risperidone and olanzapine were given in most cases. The mean time from the antipsychotic treatment initiation to MRI measurement was 6 weeks, and the maximal time to MRI examination was 13 weeks.
Exclusion criteria were as follows: substance dependence detected by clinical evaluation and urine toxicology tests, neurological or systemic disease with a known relationship to brain alteration, and MRI contraindications.
Healthy Controls
Healthy subjects (all males) without any neurological, psychiatric or systematic condition affecting the brain were recruited. They were all males with a similar age range as the first‐episode schizophrenia group (mean age 24.8 years, SD 3.0). We included 127 subjects with the goal to increase the ability to detect changes using voxel‐based morphometry, based on observation that the larger the sample of the healthy controls group in a VBM study, the better the detection of volume loss [Pell et al., 2008].
The study was approved by a local ethical committee and all subjects signed an informed consent before entering the study.
MR Imaging
All subjects were scanned with a 1.5 T Siemens Symphony machine. Whole head T1 weighted images were obtained using 3D acquisition with IR/GR sequence, TR 1700 ms, TE 3.93 ms, TI 1100 ms, flip angle 15°, 160 slices, voxel size 1.17 × 0.48 × 0.48 mm, FOV = 246 × 246 mm, matrix size 512 × 512 voxels.
Image Preprocessing
MRI images were processed using SPM5 software (http://www.fil.ion.ucl.ac.uk/spm). Data from the MRI scanner were saved in DICOM format and converted into NIFTI format using the SPM5 internal DICOM toolbox. Spatial preprocessing was done according to voxel‐based morphometry [Ashburner and Friston, 2000]. The protocol involved transformation into standard stereotactic space (MNI) with removal of global shape differences (spatial normalization), correction of image intensity inhomogeneities, removal of voxels containing extracerebral tissue, and brain tissue classification to identify gray matter images. For image transformation we used standard SPM2 T1 and a gray matter template, i.e. ICMB‐152. “Modulation,” i.e. the application of the Jacobian determinant of transformation parameters with corresponding change of voxel values in areas that have been decreased or increased by the transformation, was performed to achieve gray matter volume images. Finally, the gray matter volume images were smoothed using a 12‐mm FWHM Gaussian kernel.
To account for individual differences in brain size we calculated the total gray matter volume of the brain. The total gray matter volume was calculated from gray matter images obtained from original MR images by segmentation in native space. After segmentation, each voxel represented gray matter concentration. The volume of gray matter in each voxel was calculated by multiplying the concentration by the voxel size. The total gray matter volume of the brain was calculated as a sum of these partial volumes across the whole image.
Before statistical analysis, the gray matter images were thresholded order to prevent changes that mirror the changes in other tissue types—only voxels with values greater than 0.1 entered further analysis.
Statistical Analysis
Demographic data were presented using standard descriptive statistics. Differences between groups in continuous variables were compared using the two‐sample t‐test.
Source‐based morphometry
The method is described in detail in [Xu et al., 2009]. We used GIFT software for ICA analysis (http://icatb.sourceforge.net/gift/gift_startup.php). Initially we estimated the number of components needed to characterize our data using algorithm described by Li [Li et al., 2007] and implemented in GIFT. Consequently, ICA using infomax algorithm yielded two matrices: mixing matrix (subjects by components) and source matrix (components by voxels). The individual row of the source matrix reshaped to the original 3D dimension (dimension of input data) represents a spatial distribution of voxel contribution to the component. Further the individual column of the mixing matrix represents the contribution of subjects to the component. Subsequent statistical analysis was performed on the mixing matrix: determination of group differences in gray matter components was performed using a two‐sample t‐test on every column of the mixing matrix to test for group differences with age and total gray matter volume as confounding factors. The results were corrected for multiple comparisons using False Discovery Rate and the significance threshold was set at P < 0.05 FDR corrected. Each source (spatial component) was then reshaped to the matrix with the same dimension as that of the input images, normalized to unit variance and thresholded by Z = 3 to display only those voxels that are maximally linked with a particular component. Anatomical labels of resulting clusters were obtained using the Talairach Daemon utility [Lancaster et al., 2000].
Voxel‐based morphometry
For VBM we used voxel‐wise statistical comparisons: General Linear Model with fixed factor Group (FES vs. HC) and two confounding variables (age and total gray matter volume). Although there were no differences in age between the two groups, we included it to filter out age‐related gray matter changes. The two groups were compared using t‐contrast with the statistical threshold set at P < 0.05 FDR corrected.
For comparison of results between the two methods we used two approaches for statistical inference of VBM results. At first the t‐map was converted into a z‐map and thresholded at Z = 3 (i.e., the same threshold as for SBM maps) [Xu et al., 2009]. For better approximation to the SBM statistical inference the spatial extent analysis of VBM was done too: we corrected the results for smoothness nonstationarity—the image was warped or flattened into a space where the data were isotropic, i.e. cluster size was corrected according to local smoothness [Worsley et al., 1999]. The cluster defining threshold was set to P < 0.001; the extent threshold was 0, i.e. no a priori filtering of small clusters. Finally, the results (corrected cluster sizes) were corrected to account for multiple comparisons problem as implemented in SPM5 (P < 0.05). There is tested the hypothesis: “The probability of obtaining at least one cluster with k voxels or more somewhere in the search volume is less then 0.05” [Friston et al., 1993].
RESULTS
Source‐Based Morphometry
According to estimation of the number of components, we extracted 17 independent components. Four of them represented artifacts (signal in the CSF space, in white matter) and were not included in subsequent statistical analysis. There was a significant effect of group in the case of three components. They represented areas of gray matter reduction, particularly in the prefrontal, temporal and cerebellar regions, in first‐episode schizophrenia subjects. There were also regions where schizophrenia subjects had more gray matter volume: parietal and occipital cortex (see Table I and Fig. 1).
Table I.
Changes of gray matter volume detected by source‐based morphometry
| Component | Direction | Cluster | Side | Gyrus | BA | MNI | mm∧3 |
|---|---|---|---|---|---|---|---|
| 2 | FES < NC | 1 | L | Superior temporal | 41 | −52 −30 15 | 14,000 |
| Transverse temporal | 41 | −44 −30 13 | |||||
| Postcentral | 40 | −62 −23 14 | |||||
| 2 | R | Transverse temporal | 41 | 50 −17 11 | 7,642 | ||
| Postcentral | 40 | 64 −21 17 | |||||
| Precentral | 4 | 64 −13 30 | |||||
| 3 | L | Middle frontal | 46 | −39 18 25 | 307 | ||
| 4 | R | Posterior cingulate | 31 | 22 −62 15 | 37 | ||
| 5 | FES < NC | 1 | L | Cerebellum, anterior lobe | −47 −46 −37 | 8,385 | |
| 2 | L | Cerebellum, anterior lobe | −7 −64 −35 | 326 | |||
| 3 | R | Cerebellum, posterior lobe | 8 −89 −32 | 5,278 | |||
| 4 | R | Parahippocampal | 36 | 20, −1, −43 | 348 | ||
| FES > NC | 1 | L | Cuneus | 17 | −10 −90 2 | 6,862 | |
| 2 | R | Middle Occipital | 37 | 42 −67 2 | 682 | ||
| 3 | R | Inferior Parietal Lobule | 40 | 37 −35 40 | 557 | ||
| 4 | R | Middle Occipital | 18 | 32 −92 −1 | 103 | ||
| 12 | FES < NC | 1 | L, R | Anterior cingulate | 32 | 0 26 38 | 27,296 |
| Superior frontal | 6 | 0 12 55 | |||||
| Medial frontal | 9 | 0 39 26 | |||||
| 2 | R | Superior frontal | 9 | 37 39 35 | 1048 | ||
| Middle frontal | 8 | 27 36 47 | |||||
| FES > NC | 1 | R | Precuneus | 7 | 30 −49 43 | 528 | |
| 2 | R | Insula | 13 | 47 −42 19 | 212 | ||
FES < NC, reduction in first‐episode patients; FES > NC, relative abundance of gray matter volume in first‐episode patients; L, left; R, right; BA, Brodmann area; MNI, coordinates in MNI stereotactic space; mm∧3, cluster volume.
Figure 1.
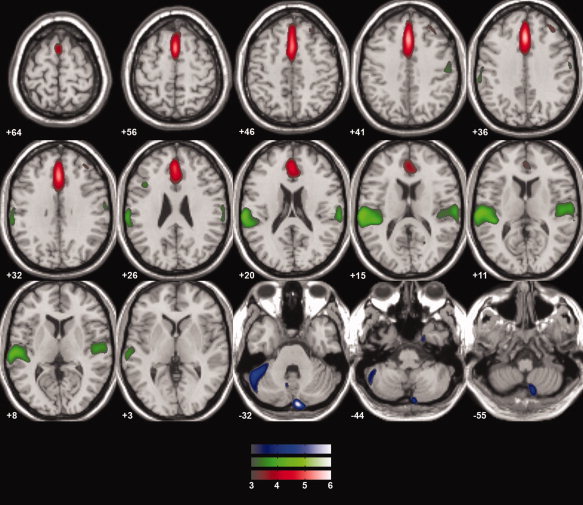
Gray matter volume reduction in first‐episode schizophrenia—SBM results. Overlay of the three significantly different components, where first‐episode schizophrenia subjects had smaller gray matter volume. All the spatial components were thresholded at Z = 3. Left is on the left side of the image, anterior is toward the top of the image.
Voxel‐Based Morphometry
VBM analysis was not able to detect any changes in gray matter in the schizophrenia group at the voxel‐level of significance, which had been set to P < 0.05 FDR corrected. Similarly, no changes were detected using cluster‐level spatial extent analysis. Regions identified by the thresholded z‐map are given in Table II.
Table II.
Changes of gray matter volume—VBM results
| Direction | Side | Gyrus | BA | MNI | mm∧3 |
|---|---|---|---|---|---|
| FES < NC | L | Inferior frontal | 47 | −56 23 −1 | 2,885 |
| Superior temporal | 22 | −56 11 −4 | |||
| L | Medial frontal | 6 | −3 9 52 | 855 | |
| R | Medial frontal | 9 | 1 31 35 | 574 | |
| Cingulate | 32 | 6 24 38 | |||
| L | Middle frontal | 9 | −49 8 39 | 521 | |
| Middle frontal | 46 | −48 24 27 | |||
| L | Medial frontal | 10 | −3 70 −4 | 396 | |
| L | Middle frontal | 8 | −28 27 52 | 332 | |
| L | Inferior frontal | 47 | −41 29 −18 | 158 | |
| L | Rectal | 11 | 0 26 −25 | 147 | |
| R | Superior temporal | 38 | 55 16 −10 | 489 | |
| L | Superior temporal | 22 | −63 −45 12 | 111 | |
| L | Precuneus | 19 | −15 −87 42 | 207 | |
| L | Inferior occipital | 18 | −42 −88 −18 | 501 | |
| R | Cerebellum, anterior lobe | 35 −36 −36 | 1,928 | ||
| R | Cerebellum, posterior lobe | 16 −90 −45 | 692 | ||
| FES > NC | L | Precentral Gyrus | 6 | −9 −23 72 | 1,796 |
| L | Middle Temporal Gyrus | 39 | −33 −72 25 | 368 | |
| L | Precuneus | 7 | −18 −72 35 | 190 | |
| L | Lingual Gyrus | −18 −78 −1 | 122 | ||
| R | Middle Occipital Gyrus | 18 | 17 −93 8 | 144 | |
| L | Middle Occipital Gyrus | 18 | −12 −92 11 | 989 | |
| L | Putamen | −27 1 4 | 1,927 | ||
| R | Putamen | 27, −4, −1 | 830 | ||
| L | Globus Pallidus | −12 2 −2 | 146 | ||
| R | Cerebellum, anterior lobe | 1 −46 −5 | 1,066 | ||
| L | Cerebellum, posterior lobe | −11 −37 −46 | 1,910 | ||
| R | Cerebellum, posterior lobe | 3 −42 −55 |
Clusters of gray matter changes from the z‐map derived from VBM analysis—thresholded at Z = 3. Labels obtained using Talairach Daemon, option nearest GM, distance 9 mm. Only clusters lager then 100 contiguous voxels are reported and only for comparison with the patterns of change detected by SBM—keep in mind that no voxels were significant in VBM analysis. FES < NC, reduction in first‐episode patients; FES > NC, relative abundance of gray matter volume in first‐episode patients; L, left; R, right; BA, Brodmann area; MNI, coordinates in MNI stereotactic space; mm∧3, cluster volume.
DISCUSSION
We were able to detect a significant reduction of gray matter in the medial prefrontal cortex (BA 6, 8, 9) including the anterior cingulate (BA 32), the dorsolateral prefrontal cortex (DLPFC, BA 46), the superior temporal gyrus (including the transverse temporal gyrus, i.e. Heschl's gyri, and the primary auditory cortex, BA 41) and adjacent parietal areas (BA 40), and a small cluster in the right parahippocampal gyrus (BA 36), and in the cerebellar hemispheres in first‐episode schizophrenia subjects using source‐based morphometry. These findings are similar to the original work of Xu et al. [Xu et al., 2009] where SBM was first described and are in agreement with the meta‐analysis of gray matter changes in schizophrenia [Ellison‐Wright et al., 2008].
In contrast to positive findings obtained using SBM, VBM analysis failed to find any significant changes in first‐episode schizophrenia subjects at the corrected threshold, neither at the voxel, nor at the cluster level inference. When z‐maps were compared, it was evident that SBM and VBM detect similar patterns of change. It should be noted however that the threshold is not valid for VBM inference. The threshold roughly corresponds to t‐test results at P < 0.001 uncorrected, which is not a valid threshold without an a priori anatomical hypothesis. The threshold P < 0.001 was used as a cluster defining threshold in our cluster‐level analysis. However, no significant clusters were found at this threshold. This demonstrates that two seemingly similar techniques (SBM and cluster‐level VBM), dealing with “clusters” of voxels, are not identical. It may be that the “noise‐dependent” method—VBM—may be sensitive to high variability in internally heterogeneous groups, as may be the case of first‐episode schizophrenia subjects, where different neurobiologically distinct subtypes may be mixed together. We may infer, therefore, that the SBM outperforms VBM analysis in first‐episode schizophrenia subjects.
Methodological issues, or differences in individual image preprocessing steps, may also lead to the differences in the pattern of changes [Bookstein, 2001; Meda et al., 2008; Salmond et al., 2002]. This fact, together with the heterogeneity of schizophrenia could lay behind differences in the patterns of change detected in individual studies. In this context it should be noted that the pattern of changes detected by SBM in our study is not completely identical with the results of the original publication of SBM method [Xu et al., 2009], or with the recent meta‐analysis [Ellison‐Wright et al., 2008]. However, we found changes in areas that are neurobiologically meaningful as supported by substantial body of evidence—see below. In light of clinical and presumably neurobiological heterogeneity it is of great importance to identify if there are several morphological patterns behind schizophrenia syndromes or if there is a common morphological substrate that is a hallmark of schizophrenia and additional changes create clinical heterogeneity. In this context the finding of fronto‐temporal gray matter reduction as a common pattern in changes in psychomotor poverty, reality distortion, and disorganization syndromes of schizophrenia [Koutsouleris et al., 2008] is of interest considering our findings.
The comparison of z‐maps deserves more comments: in SBM the threshold is applied to the source matrix that represents a certain relationship between voxels and individual significant components that survived correction of multiple comparisons: thresholding the source matrix images the voxels that are nonrandomly linked with particular components. In VBM we threshold directly the statistical parametrical maps, i.e. results of individual voxel‐wise analyses which requires specific means of multiple comparison correction. Comparison of z‐maps is therefore just a kind of demonstration that the two methods would detect similar patterns of change having the same power—which they do not have.
Components extracted by ICA were interpreted as “networks.” We should not misunderstand these networks in any functional way. The components should be taken morphologically—the regions contained by particular components express similar morphology—or variability of morphological features.
Changes of prefrontal cortex are a hallmark of schizophrenia neurobiology. Changes in the dorsolateral prefrontal cortex have been described in neuropathological literature [Harrison, 1999], in neuroimaging studies of brain morphology [Ellison‐Wright et al., 2008] and function. The DLPFC in schizophrenia is linked with working memory [Carter et al., 1998; Potkin et al., 2009], word encoding and recognition [Hofer et al., 2003] or executive functions deficits [Weinberger et al., 1986], and negative symptoms [Dolan et al., 1993]. DLPFC dysfunction is linked with many features of the illness, including mesolimbic dopamine system dysregulation [Bertolino et al., 2000], inaccuracy of cognitive control, impairment of global functioning, or clinical presentation [Yoon et al., 2008].
Gray matter loss in the medial prefrontal cortex has been reported several times [Yamada et al., 2007]. The medial prefrontal cortex is linked with autobiographical and person related information processing and empathy [Vollm et al., 2006]. It is activated during processing of emotionally charged stimuli, however, in schizophrenia subjects with flattened affectivity, the medial prefrontal cortex fails to activate [Fahim et al., 2005]. The ability to correctly attribute emotions is linked with gray matter volume of the medial prefrontal cortex [Yamada et al., 2007]. It is a node of “default brain network” where abnormalities in schizophrenia have been observed [Bluhm et al., 2007; Harrison et al., 2007]. Abnormal activation of the medial frontal cortex was also observed during the working memory paradigm [Mendrek et al., 2005], even when performance was taken into account [Thermenos et al., 2005].
A reduction of the anterior cingulate was found in a meta‐analysis of neuroimaging studies [Baiano et al., 2007] and was linked with executive dysfunction in first‐episode schizophrenia men [Szeszko et al., 2000]. Dysfunction of the anterior cingulate in schizophrenia is manifested as abnormal activation while processing conflicting, incongruent stimuli requiring increased involvement of selective attention, such as during the performance of the Stroop task [Carter et al., 1997], smaller error‐related activity during Continuous performance task [Carter et al. 2001] or during the verbal fluency paradigm [Ashton et al., 2000]. Abnormalities in the resting perfusion of the anterior cingulate have been found [Haznedar et al., 1997], and an association between anterior cingulate perfusion and disorganization syndrome [Liddle et al., 1992] or negative symptoms [Ashton et al., 2000] has also been found. The anterior cingulate seems to also be involved in antipsychotic effects in schizophrenia [Tislerova et al., 2008].
Changes in the temporal neocortex, in the superior temporal gyrus (STG) and adjacent heteromodal cortex in particular, are also quite frequent findings in both volumetric [Kuroki et al., 2006] and voxel‐based studies [Neckelmann et al., 2006; Sigmundsson et al., 2001]. Evidence for STG morphology abnormalities also comes from a report of increased diffusivity within the STG gray matter, suggesting abnormal tissue integrity [Lee et al., 2009] or cortical thickness measurements [Narr et al., 2005]. The superior temporal gyrus has also been linked to verbal hallucinations. In schizophrenia patients with marked auditory hallucinations, gray matter volume loss was observed in the STG bilaterally [Garcia‐Marti et al., 2008; O'Daly et al., 2007], where gray matter volume correlated with the severity of hallucinations [Neckelmann et al., 2006; O'Daly et al., 2007] and where gray matter loss overlapped with functional abnormalities [Marti‐Bonmati et al., 2007]. The STG is also involved in thought disorders and conceptual disorganization [Subotnik et al., 2003], semantic processing abnormalities [Nestor et al., 1993], verbal fluency [Kasparek et al., 2008] and specific neurophysiological findings [McCarley et al., 2002].
Cerebellar involvement in schizophrenia has been proposed several times, the most elaborated model was presented by Andreasen et al. [Andreasen et al., 1998]: cerebellar dysfunction may contribute to the loss of fine temporal ordering of cognitive processes leading to “cognitive dysmetria” which may be behind many aspects of schizophrenia. Abnormalities of cerebellar structure and function in schizophrenia is frequently described in the literature, including abnormalities of cerebellar size observed in neuroimaging studies, histopathological reports of decreased Purkinje cells density and size, decreased perfusion during many cognitive tasks which challenge memory, attention, social cognition, or emotivity (for a comprehensive review see [Andreasen and Pierson, 2008].
More important than the changes of individual areas is the overall pattern of morphological deviations—we have found changes in both the frontal and temporal regions. A similar pattern (medial prefrontal cortex, anterior cingulate, superior temporal gyrus, together with insular and ventrolateral cortex) has been previously observed in a VBM study [Yamada et al., 2007], and in a deformation‐based volumetric study that, similar to our study, also found cerebellar abnormalities [Volz et al., 2000]. It has been proposed that it is more appropriate to view schizophrenia as a failure of communication between critical nodes of large neuronal networks, rather than a dysfunction of separated individual areas. Friston and Frith [Friston and Frith, 1995] coined the term “fronto‐temporal disconnectivity” that stresses the importance of the coordination between the prefrontal and temporal networks. There is now direct evidence showing abnormal cooperation of prefrontal and temporal areas—during word encoding [Wolf et al., 2007], different aspects of semantic processing [Kubicki et al., 2003], verbal fluency [Boksman et al., 2005], listening to self or alien generated words [Mechelli et al., 2007], and speech production and perception [Ford et al., 2002]. Moreover, the loss of the modulatory effects of the anterior cingulate on fronto‐temporal cooperation has been reported [Fletcher et al., 1999]. Morphological interdependencies between prefrontal and temporal areas are also disturbed in schizophrenia [Woodruff et al., 1997], and gray matter reduction in prefrontal regions has been found to be associated with corresponding findings of abnormal morphological connections between frontal and temporal structures [Spoletini et al., 2009].
SBM analysis also detected a few clusters where first‐episode schizophrenia subjects had more gray matter volume than healthy controls: bilateral parietal cortex, occipital regions, and several clusters in the white matter (apparently a result of noise). Observations of increase of cortical gray matter in first‐episode schizophrenia have already been published [Ellison‐Wright et al., 2008]. However, the nature of the finding is not clear; the neuropathological correlate is unknown, as well as its functional consequences. The only evidence of gray matter increase in schizophrenia available concerns the effect of classical neuroleptics on the basal ganglia [Chakos et al., 1994; Dazzan et al., 2005]. It is not known if a similar effect also concerns cortical architecture. Interestingly, we were not able to detect a significant increase of gray matter volume in the basal ganglia, even though all subjects received antipsychotic medication before scanning. The VBM z‐map suggested such a finding, the statistical threshold was not, however, sufficient to prove it significant.
There are several factors that limit generalization of our results—lack of female patients, medication effects, or some methodological issues discussed in previous paragraphs. The lack of female patients in our study: it has been demonstrated that there are differences in both outcome [Usall et al., 2001; Grossman et al., 2006; Siegel et al., 2006] and brain morphology [Gur et al., 2002]. Thus, it would be necessary to replicate our results in a study including both males and females to generalize the results to all schizophrenia patients. The subjects in the patient group were not antipsychotic naive at the time of scanning, which could distort the patterns of change in schizophrenia, especially in the light of our findings of increased cortical gray matter. As discussed above, we have not been able to find the typical pattern of antipsychotic effect on brain morphology (i.e., basal ganglia enlargement) and the nature of cortical gray matter volume increase is not clear.
There are also several methodological issues that may influence the results and their interpretation. We performed the Independent Component Analysis on pooled data from all the schizophrenia as well as healthy control subjects. This approach assumes that both groups share the same components and only the magnitude of their expression is different. It is also possible that this assumption does not hold true and different components are present in schizophrenia patients and healthy controls. In such a case the group differences in the expression of components extracted from the pooled data would be an artifact. Conversely, it is necessary to perform statistical analysis on anatomically comparable components—and separate ICA in the two groups would necessarily lead to an arbitrary selection of more or less analogues components. Such approach would clearly introduce bias into the results. Another source of bias might be introduced by systematic variability of the results of image processing steps, such as the accuracy of the image registration [Bookstein, 2001]. Higher variability of brain shape in schizophrenia might lead to inaccurately registered images and seemingly significant differences in gray matter distribution might reflect such inaccuracy. However, many studies have demonstrated the validity of the approach, either by its ability to detect neurobiologically relevant changes in neuropsychiatric disorders [Keller et al., 2004] or by the ability to detect analogues changes as manual measurement of volume [Giuliani et al., 2005; Saze et al., 2007].
CONCLUSION
To summarize and conclude we were able to detect gray matter reduction in the medial prefrontal, neocortical temporal and cerebellar areas using source‐based morphometry. Voxel‐based morphometry lacked the power to detect any changes; however, with more relaxed thresholds, a similar pattern was present. In this respect (i.e. the higher power of SBM to detect disease‐related changes) we replicated the findings of the original publication of source‐based morphometry methodology [Xu et al., 2009]. Multivariate analysis of gray matter volume seems to be a suitable method for characterization of the patterns of change at the beginning of the illness in schizophrenia subjects.
REFERENCES
- Andreasen NC, Paradiso S, O'Leary DS ( 1998): “Cognitive dysmetria” as an integrative theory of schizophrenia: A dysfunction in cortical‐subcortical‐cerebellar circuitry? Schizophr Bull 24: 203–218. [DOI] [PubMed] [Google Scholar]
- Andreasen NC, Pierson R ( 2008): The role of the cerebellum in schizophrenia. Biol Psychiatry 64: 81–88. [DOI] [PMC free article] [PubMed] [Google Scholar]
- Ashburner J, Friston KJ ( 2000): Voxel‐based morphometry—The methods. Neuroimage 11 ( Part 1): 805–821. [DOI] [PubMed] [Google Scholar]
- Ashton L, Barnes A, Livingston M, Wyper D ( 2000): Cingulate abnormalities associated with PANSS negative scores in first episode schizophrenia. Behav Neurol 12 ( 1/2): 93–101. [DOI] [PubMed] [Google Scholar]
- Baiano M, David A, Versace A, Churchill R, Balestrieri M, Brambilla P ( 2007) Anterior cingulate volumes in schizophrenia: A systematic review and a meta‐analysis of MRI studies. Schizophr Res 93 ( 1–3): 1–12. [DOI] [PubMed] [Google Scholar]
- Bertolino A, Breier A, Callicott JH, Adler C, Mattay VS, Shapiro M, Frank JA, Pickar D, Weinberger DR ( 2000): The relationship between dorsolateral prefrontal neuronal N‐acetylaspartate and evoked release of striatal dopamine in schizophrenia. Neuropsychopharmacology 22: 125–132. [DOI] [PubMed] [Google Scholar]
- Bluhm RL, Miller J, Lanius RA, Osuch EA, Boksman K, Neufeld RW, Theberge J, Schaefer B, Williamson P ( 2007): Spontaneous low‐frequency fluctuations in the BOLD signal in schizophrenic patients: Anomalies in the default network. Schizophr Bull 33: 1004–1012. [DOI] [PMC free article] [PubMed] [Google Scholar]
- Boksman K, Theberge J, Williamson P, Drost DJ, Malla A, Densmore M, Takhar J, Pavlosky W, Menon RS, Neufeld RW ( 2005): A 4.0‐T fMRI study of brain connectivity during word fluency in first‐episode schizophrenia. Schizophr Res 75 ( 2/3): 247–263. [DOI] [PubMed] [Google Scholar]
- Bookstein FL ( 2001): “Voxel‐based morphometry” should not be used with imperfectly registered images. Neuroimage 14: 1454–1462. [DOI] [PubMed] [Google Scholar]
- Carter CS, MacDonald AW III, Ross LL, Stenger VA ( 2001): Anterior cingulate cortex activity and impaired self‐monitoring of performance in patients with schizophrenia: An event‐related fMRI study. Am J Psychiatry 158: 1423–1428. [DOI] [PubMed] [Google Scholar]
- Carter CS, Mintun M, Nichols T, Cohen JD ( 1997): Anterior cingulate gyrus dysfunction and selective attention deficits in schizophrenia: [15O]H2O PET study during single‐trial Stroop task performance. Am J Psychiatry 154: 1670–1675. [DOI] [PubMed] [Google Scholar]
- Carter CS, Perlstein W, Ganguli R, Brar J, Mintun M, Cohen JD ( 1998): Functional hypofrontality and working memory dysfunction in schizophrenia. Am J Psychiatry 155: 1285–1287. [DOI] [PubMed] [Google Scholar]
- Chakos MH, Lieberman JA, Bilder RM, Borenstein M, Lerner G, Bogerts B, Wu H, Kinon B, Ashtari M ( 1994): Increase in caudate nuclei volumes of first‐episode schizophrenic patients taking antipsychotic drugs. Am J Psychiatry 151: 1430–1436. [DOI] [PubMed] [Google Scholar]
- Cotter DR, Pariante CM, Everall IP ( 2001): Glial cell abnormalities in major psychiatric disorders: The evidence and implications. Brain Res Bull 55: 585–595. [DOI] [PubMed] [Google Scholar]
- Davatzikos C ( 2004): Why voxel‐based morphometric analysis should be used with great caution when characterizing group differences. Neuroimage 23: 17–20. [DOI] [PubMed] [Google Scholar]
- Dazzan P, Morgan KD, Orr K, Hutchinson G, Chitnis X, Suckling J, Fearon P, McGuire PK, Mallett RM, Jones PB, Leff J, Murray RM ( 2005): Different effects of typical and atypical antipsychotics on grey matter in first episode psychosis: The AESOP study. Neuropsychopharmacology 30: 765–774. [DOI] [PubMed] [Google Scholar]
- Dolan RJ, Bench CJ, Liddle PF, Friston KJ, Frith CD, Grasby PM, Frackowiak RS ( 1993): Dorsolateral prefrontal cortex dysfunction in the major psychoses: Symptom or disease specificity?. J Neurol Neurosurg Psychiatry 56: 1290–1294. [DOI] [PMC free article] [PubMed] [Google Scholar]
- Ellison‐Wright I, Glahn DC, Laird AR, Thelen SM, Bullmore E ( 2008): The anatomy of first‐episode and chronic schizophrenia: An anatomical likelihood estimation meta‐analysis. Am J Psychiatry 165: 1015–1023. [DOI] [PMC free article] [PubMed] [Google Scholar]
- Fahim C, Stip E, Mancini‐Marie A, Mensour B, Boulay LJ, Leroux JM, Beaudoin G, Bourgouin P, Beauregard M ( 2005): Brain activity during emotionally negative pictures in schizophrenia with and without flat affect: An fMRI study. Psychiatry Res 140: 1–15. [DOI] [PubMed] [Google Scholar]
- Fan Y, Gur RE, Gur RC, Wu X, Shen D, Calkins ME, Davatzikos C ( 2008): Unaffected family members and schizophrenia patients share brain structure patterns: A high‐dimensional pattern classification study. Biol Psychiatry 63: 118–124. [DOI] [PMC free article] [PubMed] [Google Scholar]
- Fan Y, Shen D, Gur RC, Gur RE, Davatzikos C ( 2007): COMPARE: Classification of morphological patterns using adaptive regional elements. IEEE Trans Med Imaging 26: 93–105. [DOI] [PubMed] [Google Scholar]
- Fletcher P, McKenna PJ, Friston KJ, Frith CD, Dolan RJ ( 1999): Abnormal cingulate modulation of fronto‐temporal connectivity in schizophrenia. Neuroimage 9: 337–342. [DOI] [PubMed] [Google Scholar]
- Ford JM, Mathalon DH, Whitfield S, Faustman WO, Roth WT ( 2002): Reduced communication between frontal and temporal lobes during talking in schizophrenia. Biol Psychiatry 51: 485–492. [DOI] [PubMed] [Google Scholar]
- Friston KJ, Ashburner J ( 2004): Generative and recognition models for neuroanatomy. Neuroimage 23: 21–4. [DOI] [PubMed] [Google Scholar]
- Friston KJ, Frith CD ( 1995): Schizophrenia: A disconnection syndrome? Clin Neurosci 3: 89–97. [PubMed] [Google Scholar]
- Friston KJ, Holmes A, Poline JB, Price CJ, Frith CD ( 1996): Detecting activations in PET and fMRI: Levels of inference and power. Neuroimage 4 ( Part 1): 223–235. [DOI] [PubMed] [Google Scholar]
- Friston KJ, Worsley KJ, Frackowiak RS, Mazziotta JC, Evans AC ( 1993): Assessing the significance of focal activations using their spatial extent. Hum Brain Mapp 1: 210–220. [DOI] [PubMed] [Google Scholar]
- Garcia‐Marti G, Aguilar EJ, Lull JJ, Marti‐Bonmati L, Escarti MJ, Manjon JV, Moratal D, Robles M, Sanjuan J ( 2008): Schizophrenia with auditory hallucinations: A voxel‐based morphometry study. Prog Neuropsychopharmacol Biol Psychiatry 32: 72–80. [DOI] [PubMed] [Google Scholar]
- Giuliani NR, Calhoun VD, Pearlson GD, Francis A, Buchanan RW ( 2005): Voxel‐based morphometry versus region of interest: A comparison of two methods for analyzing gray matter differences in schizophrenia. Schizophr Res 74 ( 2/3): 135–147. [DOI] [PubMed] [Google Scholar]
- Grossman LS, Harrow M, Rosen C, Faull R ( 2006): Sex differences in outcome and recovery for schizophrenia and other psychotic and nonpsychotic disorders. Psychiatr Serv 57: 844–850. [DOI] [PubMed] [Google Scholar]
- Gur RC, Gunning‐Dixon F, Bilker WB, Gur RE ( 2002): Sex differences in temporo‐limbic and frontal brain volumes of healthy adults. Cereb Cortex 12: 998–1003. [DOI] [PubMed] [Google Scholar]
- Harrison BJ, Yucel M, Pujol J, Pantelis C ( 2007): Task‐induced deactivation of midline cortical regions in schizophrenia assessed with fMRI. Schizophr Res 91 ( 1–3): 82–86. [DOI] [PubMed] [Google Scholar]
- Harrison PJ ( 1999): The neuropathology of schizophrenia. A critical review of the data and their interpretation. Brain 122 ( Part 4): 593–624. [DOI] [PubMed] [Google Scholar]
- Haznedar MM, Buchsbaum MS, Luu C, Hazlett EA, Siegel BV Jr, Lohr J, Wu J, Haier RJ, Bunney WE Jr ( 1997): Decreased anterior cingulate gyrus metabolic rate in schizophrenia. Am J Psychiatry 154: 682–684. [DOI] [PubMed] [Google Scholar]
- Hofer A, Weiss EM, Golaszewski SM, Siedentopf CM, Brinkhoff C, Kremser C, Felber S, Fleischhacker WW ( 2003): An FMRI study of episodic encoding and recognition of words in patients with schizophrenia in remission. Am J Psychiatry 160: 911–918. [DOI] [PubMed] [Google Scholar]
- Honea R, Crow TJ, Passingham D, Mackay CE ( 2005): Regional deficits in brain volume in schizophrenia: A meta‐analysis of voxel‐based morphometry studies. Am J Psychiatry 162: 2233–2245. [DOI] [PubMed] [Google Scholar]
- Kasparek T, Kucerova H, Prikryl R, Ceskova E, Mikl M, Krupa P ( 2008): Morphology of fronto‐temporal regions and word generation in first‐episode schizophrenia. Activitas Nervosa Superior 50: 88–90. [Google Scholar]
- Kasparek T, Prikryl R, Mikl M, Schwarz D, Ceskova E, Krupa P ( 2007): Prefrontal but not temporal grey matter changes in males with first‐episode schizophrenia. Prog Neuropsychopharmacol Biol Psychiatry 31: 151–157. [DOI] [PubMed] [Google Scholar]
- Kawasaki Y, Suzuki M, Kherif F, Takahashi T, Zhou SY, Nakamura K, Matsui M, Sumiyoshi T, Seto H, Kurachi M ( 2007): Multivariate voxel‐based morphometry successfully differentiates schizophrenia patients from healthy controls. Neuroimage 34: 235–242. [DOI] [PubMed] [Google Scholar]
- Keller SS, Wilke M, Wieshmann UC, Sluming VA, Roberts N ( 2004): Comparison of standard and optimized voxel‐based morphometry for analysis of brain changes associated with temporal lobe epilepsy. Neuroimage 23: 860–868. [DOI] [PubMed] [Google Scholar]
- Koutsouleris N, Gaser C, Jager M, Bottlender R, Frodl T, Holzinger S, Schmitt GJ, Zetzsche T, Burgermeister B, Scheuerecker J, Born C, Reiser M, Moller HJ, Meisenzahl EM ( 2008): Structural correlates of psychopathological symptom dimensions in schizophrenia: A voxel‐based morphometric study. Neuroimage 39: 1600–1612. [DOI] [PubMed] [Google Scholar]
- Kubicki M, McCarley RW, Nestor PG, Huh T, Kikinis R, Shenton ME, Wible CG ( 2003): An fMRI study of semantic processing in men with schizophrenia. Neuroimage 20: 1923–1933. [DOI] [PMC free article] [PubMed] [Google Scholar]
- Kuroki N, Shenton ME, Salisbury DF, Hirayasu Y, Onitsuka T, Ersner‐Hershfield H, Yurgelun‐Todd D, Kikinis R, Jolesz FA, McCarley RW ( 2006): Middle and inferior temporal gyrus gray matter volume abnormalities in first‐episode schizophrenia: An MRI study. Am J Psychiatry 163: 2103–2110. [DOI] [PMC free article] [PubMed] [Google Scholar]
- Lancaster JL, Woldorff MG, Parsons LM, Liotti M, Freitas CS, Rainey L, Kochunov PV, Nickerson D, Mikiten SA, Fox PT ( 2000): Automated Talairach atlas labels for functional brain mapping. Hum Brain Mapp 10: 120–131. [DOI] [PMC free article] [PubMed] [Google Scholar]
- Lee K, Yoshida T, Kubicki M, Bouix S, Westin CF, Kindlmann G, Niznikiewicz M, Cohen A, McCarley RW, Shenton ME ( 2009): Increased diffusivity in superior temporal gyrus in patients with schizophrenia: A Diffusion Tensor Imaging study. Schizophr Res 108 ( 1–3): 33–40. [DOI] [PMC free article] [PubMed] [Google Scholar]
- Lewis DA, Hashimoto T, Volk DW ( 2005): Cortical inhibitory neurons and schizophrenia. Nat Rev Neurosci 6: 312–324. [DOI] [PubMed] [Google Scholar]
- Li YO, Adali T, Calhoun VD ( 2007): Estimating the number of independent components for functional magnetic resonance imaging data. Hum Brain Mapp 28: 1251–1266. [DOI] [PMC free article] [PubMed] [Google Scholar]
- Liddle PF, Friston KJ, Frith CD, Frackowiak RS ( 1992): Cerebral blood flow and mental processes in schizophrenia. J R Soc Med 85: 224–227. [DOI] [PMC free article] [PubMed] [Google Scholar]
- Marti‐Bonmati L, Lull JJ, Garcia‐Marti G, Aguilar EJ, Moratal‐Perez D, Poyatos C, Robles M, Sanjuan J ( 2007): Chronic auditory hallucinations in schizophrenic patients: MR analysis of the coincidence between functional and morphologic abnormalities. Radiology 244: 549–556. [DOI] [PubMed] [Google Scholar]
- McCarley RW, Salisbury DF, Hirayasu Y, Yurgelun‐Todd DA, Tohen M, Zarate C, Kikinis R, Jolesz FA, Shenton ME ( 2002): Association between smaller left posterior superior temporal gyrus volume on magnetic resonance imaging and smaller left temporal P300 amplitude in first‐episode schizophrenia. Arch Gen Psychiatry 59: 321–331. [DOI] [PubMed] [Google Scholar]
- Mechelli A, Allen P, Amaro E Jr, Fu CH, Williams SC, Brammer MJ, Johns LC, McGuire PK ( 2007): Misattribution of speech and impaired connectivity in patients with auditory verbal hallucinations. Hum Brain Mapp 28: 1213–1222. [DOI] [PMC free article] [PubMed] [Google Scholar]
- Mechelli A, Price CJ, Friston KJ, Ashburner J ( 2005): Voxel‐based morphometry of the human brain: Methods and applications. Curr Med Imaging Rev 1: 105–113. [Google Scholar]
- Meda SA, Giuliani NR, Calhoun VD, Jagannathan K, Schretlen DJ, Pulver A, Cascella N, Keshavan M, Kates W, Buchanan R, Sharma T, Pearlson GD ( 2008): A large scale (N=400) investigation of gray matter differences in schizophrenia using optimized voxel‐based morphometry. Schizophr Res 101 ( 1–3): 95–105. [DOI] [PMC free article] [PubMed] [Google Scholar]
- Mendrek A, Kiehl KA, Smith AM, Irwin D, Forster BB, Liddle PF ( 2005): Dysfunction of a distributed neural circuitry in schizophrenia patients during a working‐memory performance. Psychol Med 35: 187–196. [DOI] [PubMed] [Google Scholar]
- Narr KL, Bilder RM, Toga AW, Woods RP, Rex DE, Szeszko PR, Robinson D, Sevy S, Gunduz‐Bruce H, Wang YP, DeLuca H, Thompson PM ( 2005): Mapping cortical thickness and gray matter concentration in first episode schizophrenia. Cereb Cortex 15: 708–719. [DOI] [PubMed] [Google Scholar]
- Neckelmann G, Specht K, Lund A, Ersland L, Smievoll AI, Neckelmann D, Hugdahl K ( 2006): Mr morphometry analysis of grey matter volume reduction in schizophrenia: Association with hallucinations. Int J Neurosci 116: 9–23. [DOI] [PubMed] [Google Scholar]
- Nestor PG, Shenton ME, McCarley RW, Haimson J, Smith RS, O'Donnell B, Kimble M, Kikinis R, Jolesz FA ( 1993): Neuropsychological correlates of MRI temporal lobe abnormalities in schizophrenia. Am J Psychiatry 150: 1849–1855. [DOI] [PubMed] [Google Scholar]
- O'Daly OG, Frangou S, Chitnis X, Shergill SS ( 2007): Brain structural changes in schizophrenia patients with persistent hallucinations. Psychiatry Res 156: 15–21. [DOI] [PubMed] [Google Scholar]
- Pell GS, Briellmann RS, Chan CH, Pardoe H, Abbott DF, Jackson GD ( 2008): Selection of the control group for VBM analysis: Influence of covariates, matching and sample size. Neuroimage 41: 1324–1335. [DOI] [PubMed] [Google Scholar]
- Potkin SG, Turner JA, Brown GG, McCarthy G, Greve DN, Glover GH, Manoach DS, Belger A, Diaz M, Wible CG, Ford JM, Mathalon DH, Gollub R, Lauriello J, O'Leary D, van Erp TG, Toga AW, Preda A, Lim KO ( 2009): Working memory and DLPFC inefficiency in schizophrenia: The FBIRN study. Schizophr Bull 35: 19–31. [DOI] [PMC free article] [PubMed] [Google Scholar]
- Salmond CH, Ashburner J, Vargha‐Khadem F, Connelly A, Gadian DG, Friston KJ ( 2002): The precision of anatomical normalization in the medial temporal lobe using spatial basis functions. Neuroimage 17: 507–512. [DOI] [PubMed] [Google Scholar]
- Saze T, Hirao K, Namiki C, Fukuyama H, Hayashi T, Murai T ( 2007): Insular volume reduction in schizophrenia. Eur Arch Psychiatry Clin Neurosci 257: 473–479. [DOI] [PubMed] [Google Scholar]
- Selemon LD, Rajkowska G, Goldman‐Rakic PS ( 1995): Abnormally high neuronal density in the schizophrenic cortex. A morphometric analysis of prefrontal area 9 and occipital area 17. Arch Gen Psychiatry 52: 805–818; discussion 819–80. [DOI] [PubMed] [Google Scholar]
- Siegel SJ, Irani F, Brensinger CM, Kohler CG, Bilker WB, Ragland JD, Kanes SJ, Gur RC, Gur RE ( 2006): Prognostic variables at intake and long‐term level of function in schizophrenia. Am J Psychiatry 163: 433–441. [DOI] [PubMed] [Google Scholar]
- Sigmundsson T, Suckling J, Maier M, Williams S, Bullmore E, Greenwood K, Fukuda R, Ron M, Toone B ( 2001): Structural abnormalities in frontal, temporal, and limbic regions and interconnecting white matter tracts in schizophrenic patients with prominent negative symptoms. Am J Psychiatry 158: 234–243. [DOI] [PubMed] [Google Scholar]
- Sowell ER, Thompson PM, Holmes CJ, Batth R, Jernigan TL, Toga AW ( 1999): Localizing age‐related changes in brain structure between childhood and adolescence using statistical parametric mapping. Neuroimage 9 ( Part 1): 587–597. [DOI] [PubMed] [Google Scholar]
- Spoletini I, Cherubini A, Di Paola M, Banfi G, Rusch N, Martinotti G, Bria P, Rubino IA, Siracusano A, Caltagirone C, Spalletta G ( 2009): Reduced fronto‐temporal connectivity is associated with frontal gray matter density reduction and neuropsychological deficit in schizophrenia. Schizophr Res 108 ( 1–3): 57–68. [DOI] [PubMed] [Google Scholar]
- Subotnik KL, Bartzokis G, Green MF, Nuechterlein KH ( 2003): Neuroanatomical correlates of formal thought disorder in schizophrenia. Cogn Neuropsychiatry 8: 81–88. [DOI] [PubMed] [Google Scholar]
- Szeszko PR, Bilder RM, Lencz T, Ashtari M, Goldman RS, Reiter G, Wu H, Lieberman JA ( 2000): Reduced anterior cingulate gyrus volume correlates with executive dysfunction in men with first‐episode schizophrenia. Schizophr Res 43 ( 2/3): 97–108. [DOI] [PubMed] [Google Scholar]
- Thermenos HW, Goldstein JM, Buka SL, Poldrack RA, Koch JK, Tsuang MT, Seidman LJ ( 2005): The effect of working memory performance on functional MRI in schizophrenia. Schizophr Res 74 ( 2/3): 179–194. [DOI] [PubMed] [Google Scholar]
- Tislerova B, Brunovsky M, Horacek J, Novak T, Kopecek M, Mohr P, Krajca V ( 2008): LORETA functional imaging in antipsychotic‐naive and olanzapine‐, clozapine‐ and risperidone‐treated patients with schizophrenia. Neuropsychobiology 58: 1–10. [DOI] [PubMed] [Google Scholar]
- Usall J, Araya S, Ochoa S, Busquets E, Gost A, Marquez M ( 2001): Gender differences in a sample of schizophrenic outpatients. Compr Psychiatry 42: 301–305. [DOI] [PubMed] [Google Scholar]
- van Haren NE, Cahn W, Hulshoff Pol HE, Kahn RS ( 2008): Schizophrenia as a progressive brain disease. Eur Psychiatry 23: 245–254. [DOI] [PubMed] [Google Scholar]
- Vollm BA, Taylor AN, Richardson P, Corcoran R, Stirling J, McKie S, Deakin JF, Elliott R ( 2006): Neuronal correlates of theory of mind and empathy: A functional magnetic resonance imaging study in a nonverbal task. Neuroimage 29: 90–98. [DOI] [PubMed] [Google Scholar]
- Volz H, Gaser C, Sauer H ( 2000): Supporting evidence for the model of cognitive dysmetria in schizophrenia—A structural magnetic resonance imaging study using deformation‐based morphometry. Schizophr Res 46: 45–56. [DOI] [PubMed] [Google Scholar]
- Weinberger DR, Berman KF, Zec RF ( 1986): Physiologic dysfunction of dorsolateral prefrontal cortex in schizophrenia. I. Regional cerebral blood flow evidence. Arch Gen Psychiatry 43: 114–124. [DOI] [PubMed] [Google Scholar]
- Wolf DH, Gur RC, Valdez JN, Loughead J, Elliott MA, Gur RE, Ragland JD ( 2007): Alterations of fronto‐temporal connectivity during word encoding in schizophrenia. Psychiatry Res 154: 221–232. [DOI] [PMC free article] [PubMed] [Google Scholar]
- Woodruff PW, Wright IC, Shuriquie N, Russouw H, Rushe T, Howard RJ, Graves M, Bullmore ET, Murray RM ( 1997): Structural brain abnormalities in male schizophrenics reflect fronto‐temporal dissociation. Psychol Med 27: 1257–1266. [DOI] [PubMed] [Google Scholar]
- Worsley KJ, Andermann M, Koulis T, MacDonald D, Evans AC ( 1999): Detecting changes in nonisotropic images. Hum Brain Mapp 8 ( 2/3): 98–101. [DOI] [PMC free article] [PubMed] [Google Scholar]
- Worsley KJ, Neelin SMP, Vandal AC, Friston KJ, Evans AC ( 1996): A unified statistical approach for determining significant signals in images of cerebral activation. Hum Brain Mapp 4: 58–73. [DOI] [PubMed] [Google Scholar]
- Xu L, Groth KM, Pearlson G, Schretlen DJ, Calhoun VD ( 2009): Source‐based morphometry: the use of independent component analysis to identify gray matter differences with application to schizophrenia. Hum Brain Mapp 30: 711–724. [DOI] [PMC free article] [PubMed] [Google Scholar]
- Yamada M, Hirao K, Namiki C, Hanakawa T, Fukuyama H, Hayashi T, Murai T ( 2007): Social cognition and frontal lobe pathology in schizophrenia: A voxel‐based morphometric study. Neuroimage 35: 292–298. [DOI] [PubMed] [Google Scholar]
- Yoon JH, Minzenberg MJ, Ursu S, Ryan Walter BS, Wendelken C, Ragland JD, Carter CS ( 2008): Association of dorsolateral prefrontal cortex dysfunction with disrupted coordinated brain activity in schizophrenia: Relationship with impaired cognition, behavioral disorganization, and global function. Am J Psychiatry 165: 1006–1014. [DOI] [PMC free article] [PubMed] [Google Scholar]