

Abstract
The occipital and parietal lobes contain regions that are recruited for both visual and haptic object processing. The purpose of the present study was to characterize the underlying neural mechanisms for bimodal integration of vision and haptics in these visuo‐haptic object‐selective brain regions to find out whether these brain regions are sites of neuronal or areal convergence. Our sensory conditions consisted of visual‐only (V), haptic‐only (H), and visuo‐haptic (VH), which allowed us to evaluate integration using the superadditivity metric. We also presented each stimulus condition at two different levels of signal‐to‐noise ratio or salience. The salience manipulation allowed us to assess integration using the rule of inverse effectiveness. We were able to localize previously described visuo‐haptic object‐selective regions in the lateral occipital cortex (lateral occipital tactile‐visual area) and the intraparietal sulcus, and also localized a new region in the left anterior fusiform gyrus. There was no evidence of superadditivity with the VH stimulus at either level of salience in any of the regions. There was, however, a strong effect of salience on multisensory enhancement: the response to the VH stimulus was more enhanced at higher salience across all regions. In other words, the regions showed enhanced integration of the VH stimulus with increasing effectiveness of the unisensory stimuli. We called the effect “enhanced effectiveness.” The presence of enhanced effectiveness in visuo‐haptic object‐selective brain regions demonstrates neuronal convergence of visual and haptic sensory inputs for the purpose of processing object shape. Hum Brain Mapp, 2010. © 2009 Wiley‐Liss, Inc.
Keywords: multisensory integration, object recognition, vision, haptics, inverse effectiveness
INTRODUCTION
Among the various properties that can be extracted from an object, including size, color, texture, material, hardness, etc., shape is the most prominent for human visual object recognition [Marr,1982]. Shape properties of objects can also be extracted by active touching (haptic exploration) of those objects. But, despite the fact that the shapes of objects are processed and represented by multiple sensory modalities, research into object recognition has primarily involved investigations using vision. A few researchers, however, have found behavioral evidence of cross‐modal transfer between vision and haptics for object shape [Gibson,1963; Newell et al.,2001; Norman et al.,2004]. More recently, it was found that vision and haptics share common neural substrates in humans for the representation of object shape [Amedi et al., 2001,2002; Beauchamp et al.,2008; Bruce et al.,1981; Culham and Kanwisher,2001; Grefkes et al., 2001,2002; James et al.,2002,2005; Peltier et al.,2007; Pietrini et al.,2004; Stilla and Sathian,2008; Stoesz et al.,2003; Zangaladze et al.,1999; Zhang et al.,2004]. For instance, James et al. [2002] found overlapping brain regions involved in visual and haptic recognition of novel 3D objects in the middle occipital (MO) cortex and in the lateral occipital (LO) cortex, which make up the lateral occipital complex [LOC; Grill‐Spector et al.,2001; Malach et al.,1995]. This neuroimaging result with healthy subjects was later supported by a case study with patient D.F. who has aperceptive visual‐form agnosia [Humphrey et al.,1994; Milner et al.,1991]. D.F. was shown to have bilateral damage in the LOC [James et al.,2003]. Of interest is that she showed deficits with tasks involving haptic shape processing that were as severe as her deficits on the same tasks using vision [James et al.,2005]. Based on other neuroimaging studies of visuo‐haptic object recognition, a subregion in the LOC that is selective to both visual and haptic objects is now called the lateral occipital tactile–visual (LOtv) [Amedi et al.,2001,2002], and it has been suggested that LOtv activation is related to processing the geometrical shape of both visually and haptically explored objects [Amedi et al.,2001,2002; James et al.,2002; Peltier et al.,2007; Pietrini et al.,2004; Stoesz et al.,2003; Zhang et al.,2004].
Another brain region distinct from LOC that has been considered to be a site of multisensory areal convergence for visuo‐haptic object recognition is the intraparietal sulcus (IPS). James et al. [2003] suggested that the anterior part of the IPS is involved in processing visual shape information particularly for visually guided reaching and grasping actions. Other studies found this area to be involved in tactile discrimination of shape or orientation [Bodegard et al.,2001; Kitada et al.,2006; Van Boven et al.,2005; Zhang et al.,2005]. Other neuroimaging studies suggested that IPS is a bimodal sensory region that receives inputs from both vision and touch [Culham and Kanwisher,2001; Grefkes et al.,2002; Stilla and Sathian,2008; Zhang et al.,2004].
Given the behavioral evidence that shape information can be transferred between vision and haptics, it is not surprising that information from these sensory modalities should converge onto a single brain region. One thing to consider, however, is that convergence within a particular area, as measured by the fMRI studies mentioned above, does not demonstrate that the signals converge onto the same individual neurons. Convergence of different sensory inputs on an area, but without synapsing on the same neurons, is called areal convergence. When the inputs converge in the same area and also synapse on the same neurons, it is called neuronal convergence, and results in integration of the different sensory signals [Meredith and Stein, 1986].
Recording from single neurons is difficult or impossible in humans. Functional neuroimaging provides a noninvasive method for inferring neural activity in the human brain, but those measurements are of neural activity from populations of neurons, not single neurons. Calvert [2000] was the first to address the need for different criteria to assess neuronal convergence with fMRI data compared with single‐unit recording data. Because populations of neurons in multisensory brain regions undoubtedly contain mixtures of unisensory and multisensory neurons [Allman et al.,2009], the null hypothesis to be rejected must be that a multisensory stimulus produces activation equivalent to the sum of the activations produced with the unisensory stimuli. This is because the multisensory stimulus will excite the unisensory neurons just as effectively as the unisensory components. When the multisensory stimulus produces more activation than the additive null hypothesis, it is said to be “superadditive.” No study to date, however, has examined the possibility that object‐selective brain areas in humans that respond to both vision and haptics are involved in multisensory integration, in spite of the evidence suggesting possible sites of convergence for visual and haptic object representations in the occipito‐temporal and parietal cortices.
The purpose of the present study was to define visuo‐haptic object‐selective brain regions and characterize the underlying mechanisms for bimodal integration of vision and haptics to find out whether these brain regions are sites of neuronal or areal convergence. Based on previous studies of audio‐visual integration [Calvert et al.,2001,2000; Stevenson et al.,2007; Stevenson and James,2009], we applied the superadditivity metric to the activation of those regions to assess multisensory integration. It is important to note, however, that we did not use only the superadditivity metric as an indication of multisensory integration. Models of BOLD fMRI activation based on neural spike counts in the superior colliculus have suggested that superadditivity may not be the ideal metric for determining multisensory convergence with population measures like fMRI [Laurienti et al.,2005; Stanford and Stein,2007; Stein and Stanford,2008; Stevenson et al.,2007,2009]. Meredith and Stein [1986] suggested that multisensory responses strongly depend on the effectiveness of the constituent stimuli being used. In those experiments, multisensory stimuli that were combinations of the least effective unisensory component stimuli produced the greatest multisensory enhancement in neurons. This effect is called the principle of inverse effectiveness. Here, we hypothesized that visuo‐haptic shape processing will also show inverse effectiveness in visuo‐haptic object‐selective brain regions. Finding inverse effectiveness would suggest the presence of multisensory integration, even in the absence of superadditivity. Thus, we included stimulus conditions in our design that would produce different levels of effectiveness and used inverse effectiveness as a second criterion for assessing multisensory integration.
MATERIALS AND METHODS
Subjects
Seven volunteers (three females and four males) between the ages of 19 and 33 participated in the study with monetary compensation. All participants reported right‐handedness, normal or corrected‐to‐normal visual acuity, normal sensation of touch, and no history of neurological disorders. Right handedness was assessed by the participants verbally reporting which hand they write with. The study was approved by the Indiana University Institutional Review Board. Written informed consent was obtained from all participants prior to the experiments.
Stimuli and Apparatus
Grayscale images of 40 objects and 40 textures were used for the visual object localizer run and each stimulus subtended 12° of horizontal and vertical visual angles. Twenty 3‐dimensional everyday‐life objects (e.g., cup, book, etc.) and twenty 2‐dimensional surface materials (e.g., fabric, sandpaper, etc.), all MR‐compatible and explorable by two hands within 3 s, were used for the haptic object localizer run. In other previous imaging studies [Amedi et al.,2001,2002], contrasting BOLD activation produced with objects and textures has been successfully used to localize visual or haptic object‐selective regions in the brain. In the experimental runs, 16 simple novel objects were used. These objects were composed of four Geon‐type geometric components; however, only one of those features was critical for discriminating the objects. Each stimulus was 14 cm wide and 9.4 cm long with four different types of material properties (dense/coarse texture, and small/medium size of pattern) and four different combinations of noncritical components (cylinders and boxes). Eight of them had a half‐circle‐shaped component as the critical feature, and the other eight had a triangle‐shaped component. Figure 1 shows one example from each category: half‐circle or triangle. For visual presentation, a picture of each stimulus was taken and presented in grayscale with 12° × 8° of visual angle. Having various material properties and noncritical components, stimuli were moderately complicated enough to keep participants attentive to the task and to not get bored, but prior to the experiments participants were told to use only the critical features to discriminate the objects. Considering that haptic exploration is relatively slow compared to visual exploration, the critical features were placed at the same position in every trial so that participants knew where to put their hands to find the critical features initially.
Figure 1.

Examples of stimuli used in experimental runs. Two critical features half‐circle (a) and triangle (b) are marked in a white circle.
The salience level of visual stimuli was varied by superimposing constant contrast Gaussian noise on the images and adjusting the signal contrast. The salience level of haptic stimuli was varied by the number of layers of felt fabric placed on top of the stimulus and also by a pair of PVC gloves worn by participants. Individual psychophysical thresholds of each participant were found using a two‐down/one‐up staircase procedure for the haptic low‐salience condition (71%) and a six‐down/one‐up staircase procedure for the haptic high‐salience condition (89%). For the visual salience, we simultaneously ran two interleaved three‐down/one‐up staircases converging at 79%. We then estimated 71% (low) and 89% (high) thresholds from a psychometric function fitted to the staircase data.
Throughout the experiments, visual stimuli were presented by a Mitsubishi XL30U projector placed outside of the MR room and viewed through a mirror mounted on an eight‐channel phased‐array head coil in a Siemens Magnetom Trio 3T whole‐body scanner. All stimuli were presented using a Macintosh computer operated by Mac OS 9 (Apple Computer, Cupertino, CA) connected to the projector and Matlab 5.2 (The Mathworks, Natick, MA) with the Psychophysics Toolbox [Brainard,1997; Pelli,1997]. Haptic stimuli were presented on a table that was placed over participant's abdomen and participants were told to use both hands to explore stimuli with their eyes closed. Two experimenters remained in the MR room during functional scans so that one of them could put haptic stimuli on the table in every trial and the other experimenter adjusted the stimulus salience level (e.g., layers of felt fabric). Auditory cues were given to both experimenters and participants for accurate stimulus onset and offset times. Visual and haptic stimuli were presented at the same time in the visuo‐haptic condition (VH). Participants were asked to start and end visual and haptic explorations simultaneously. At the same time that the visual stimulus was presented on the screen, an auditory cue was presented, which indicated to the subject that they were to begin haptic exploration. Because subjects were required to make a small movement to make contact with the object, onsets of visual and tactile stimulation were not consistently synchronized. Because haptic exploration required more time than visual exploration, stimulus offsets were also not consistently synchronized. We placed two response buttons at the participant's feet because the participant's hands were occupied with exploration. Each foot button was large (7.6 cm × 5 cm) and easy to press. Thus, subjects could make their responses with a small movement of their ankle. It was important that the movement was small to minimize possible head movements as a result of responding. The participants' legs were optimally positioned with a support under their knees to further lessen the impact of foot movement on head motion and to keep them comfortable.
fMRI Imaging Procedures
Stimuli were presented in a block‐designed paradigm for both localizer and experimental runs to reduce cognitive interference from task switching between sensory modalities (V, H, or VH), to ensure maximal power for statistical analyses, and to reduce the impact of any motion artifacts on data analysis. Each participant performed two visual object localizer runs and two haptic object localizer runs, followed by six experimental runs. Each localizer run contained five blocks of object presentation, five blocks of texture presentation, and 16‐s rest periods at the beginning and at the end of each run. Both “object” and “texture” stimulation blocks had four stimuli per block, and each stimulus was presented for 3 s and followed by a 1‐s rest period. Each block was always followed by a 16‐s rest period. The order of presenting blocks was randomized, and each condition had 10 blocks, presenting 40 stimuli total across all runs. Participants did not make any button responses during the localizer runs.
In the experimental runs, each run contained trials from only one cell in a 3 × 2 experimental design that crossed sensory modality (V, H, and VH) and stimulus salience (high and low), making the total number of runs six. Prior to each run, participants were told which sensory modalities they had to use. Each run contained eight blocks of stimulus presentation, with 16‐s rest periods at the beginning and at the end of run. Each block was 16 s long, presenting four 4‐s trials and was followed by a 16‐s rest period. The total number of stimuli per condition was 16, each being presented twice and counter‐balanced, resulting in 32 trials total within a run. Participants performed a 2AFC task based on the shape of the critical feature (see Fig. 1). Participants pressed the right‐foot button when the critical shape feature was a half‐circle and the left‐foot button when the critical shape feature was a triangle. Subjects were told to ignore other object features that were not critical to the task, such as noncritical shape features, and the texture of the objects. Participants were required to make a response within 3 s after stimulus onset and practiced the task before their imaging session until they were comfortable responding within the required time.
To limit participants' head movements produced by hand exploration of the stimuli and foot button responses, participants were specifically instructed to limit their movements and trained to minimize their arm and shoulder movements in an MRI simulator prior to the imaging session. Each participant's head was restrained tightly with foam padding in the head coil within the limit to which the foam padding did not cause discomfort.
Imaging Parameters
Whole‐brain functional volumes were acquired with a field of view of 220 × 220 mm2, an in‐plane resolution of 64 × 64 pixels, and 33 axial slices with 3.4 mm thickness and 0 mm slice gap, resulting in a voxel size of 3.4 × 3.4 × 3.4 mm3. Readout interactions between slices were managed by collecting slices in an interleaved ascending order. Functional images were collected using a relatively standard gradient echo EPI pulse sequence (TE = 25 ms, TR = 2,000 ms, flip angle = 70°). The number of EPI volumes per session was 145 and 177 in the localizer and experimental runs, respectively. High‐resolution T1‐weighted anatomical volumes with 160 sagittal slices (voxel size = 1 × 1 × 1 mm3) were acquired using Turbo‐flash 3D (TI = 1,100 ms, TE = 3.93 ms, TR = 14.375 ms, flip angle = 12°).
Data Analysis
Imaging data were analyzed using BrainVoyagerTM QX (Brain Innovation, Maastricht, Netherlands) run on a PC operated by Windows XP Professional (Microsoft Corporation, Redmond, WA). Anatomical imaging data were transformed into a standard space corresponding to Talairach's coplanner stereotaxic atlas of the human brain [Talairach and Tournoux,1988] using an eight‐parameter affine transform in BrainVoyagerTM QX 3D analysis tools. Functional imaging data were aligned to the first volume of the last run, which was performed closest to the anatomical data acquisition, as a reference, then aligned to the transformed anatomical data, and preprocessed. The preprocessing procedure included 3D motion correction, slice scan‐time correction, 3D spatial Gaussian smoothing (FWHM = 6 mm), and linear trend removal. The only temporal preprocessing was a linear trend removal; no high‐pass filter was used. Head movement parameters were not included as regressors in the GLM analyses described below. Because of the possibility that haptic exploration or foot‐button responses caused head movements, functional runs in which transient head movements exceeded 1 mm and/or gradual drift of the head exceeded 2 mm were excluded from the analyses.
Analysis of the functional data was performed using BrainVoyagerTM QX general linear model (GLM) with the Glover hemodynamic response function (HRF) applied to each predictor. For the localizers, an individual statistical parametric map (SPM) was created for each participant's visuo‐haptic object‐selective regions. The visuo‐haptic object‐selective regions were defined using a conjunction of two contrasts:
In addition to seven individual SPMs from seven participants' localizer data, a group‐average SPM was also created with a fixed‐effects GLM model from the localizer runs of all seven participants. A fixed‐effects model was used, because the goal was to localize LOtv and other bimodal object‐selective ROIs in this group of seven subjects for further analysis on these same seven subjects. The goal was not to generalize the location of the ROIs to the population from which those seven subjects were selected (in which case a random‐effects model would be used). Note that neither the individual nor the group‐average analyses used a conjunction of contrasts across subjects [Friston et al.,1999]. The conjunction was across stimulus modality, that is, a conjunction of two contrasts, one performed within the visual modality and one within the haptic modality.
SPMs generated from the localizer runs were thresholded using three criteria. The first method was a Bonferonni correction where the alpha level was divided by the number voxels. In this case, voxels were resampled from the original 3.4 × 3.4 × 3.4 mm3 to 3 × 3 × 3 mm3. Thus, the effective number of voxel used for Bonferonni correction was the total number of 3 × 3 × 3 mm3 voxels across the whole brain. The second method was false discovery rate [FDR; Genovese et al.,2002]. The third method was to choose an arbitrary, liberal voxelwise threshold and combine with a cluster‐size threshold [Forman et al.,1995; Thirion et al.,2007]. Cluster‐sizes were determined based on the resampled voxel size of 3 × 3 × 3 mm3.
Experimental runs were analyzed using both individual‐based and group‐average‐based region of interest (ROI) analyses. For the group‐average analysis, ROIs were determined from the group‐average SPM. Thus, the same clusters of voxels were used to extract timecourses for each subject. The group‐average ROI analysis ensures that the functional timecourses for each subject are drawn from the same anatomical location. For the individual ROI analysis, ROIs were determined separately for each subject from their own functional localizer data. Functional timecourses for each subject were extracted from their own unique ROIs. Thus, the individual ROI analysis ensures that the functional timecourses for each subject are taken from a region with similar functional specialization, but potentially at a slightly different anatomical location. For any given cognitive process, if there is a consistent mapping between anatomy and function across subjects, then the group‐average ROI and individual ROI analyses should produce similar results.
The percent BOLD signal change in each ROI was calculated from the timecourses as the average percent signal change across a time window that began 6 s after the onset of the stimulus block and ended at the end of the block. A 6‐s lag for the onset was used to take into account the typical hemodynamic lag. No lag was used after offset, because of the possibility that decay of the BOLD response may be different across conditions, particularly because of the differences in reaction time seen across stimulus modalities.
Finally, although the primary goal of the experiment was to assess multisensory integration and inverse effectiveness in bimodal object‐selective brain regions, we did perform an investigatory whole‐brain group‐average SPM analysis on the experimental runs, specifically searching for other brain regions that showed inverse effectiveness.
RESULTS
Behavioral Data
Table I shows the results of mean accuracy and response time from six participants. We could not collect button responses from one of the seven participants because the button response pad was not properly working while collecting her data. A two‐way analysis of variance (ANOVA) was performed on mean accuracy and response time using an alpha level of 0.05, and the sphericity assumption for within‐subjects ANOVA was tested using Mauchly's test. According to the test, it was assumed that the variances of different levels of each independent variable are not statistically different. Under this assumption, the ANOVA showed significant effects of stimulus salience (high or low) on both accuracy and response time (F (1,5) = 37.1, P = 0.002; F (1,5) = 14.6, P = 0.012) and significant effects of modality (V, H, or VH) on RT (F (2,10) = 92.5, P < 0.001), but no significant effects of modality on accuracy (F (2,10) = 1.56, P = 0.257). There was no significant interaction found between modality and salience on accuracy and response time (F (2,10) = 1.33, P = 0.308; F (2,10) = 0.712, P = 0.514). When participants used both modalities, vision and touch, during the shape discrimination task, their accuracy and response time may be expected to be optimal compared with unimodal conditions, but their response time for VH condition was approximately the mean of V and H conditions in both high‐ and low‐salience conditions because they were instructed not to use only one modality, but to use both modalities even in the conditions when the relatively faster visual process (mean 1.1 ± 0.08 s) could give them enough information to do the task without using the information from the slow haptic process (mean 2.1 ± 0.08 s). Accuracies in the bimodal VH condition and in the unimodal V or H condition, however, showed different tendencies between salience levels. When the salience of stimulus decreased from high to low in the bimodal VH condition, the accuracy rate did not drop as much as in the unimodal conditions. In other words, when participants perceived the shapes of stimuli by both vision and touch simultaneously (VH), the sensitivity to stimulus salience decreased compared to when they performed the shape discrimination task only by either vision or touch. The difference of sensitivity to stimulus salience between unimodal and bimodal conditions is depicted in Figure 2.
Table I.
Mean accuracy and response time by sensory modality and stimulus salience (N = 6)
| Accuracy (%) | Response time (s) | |||||
|---|---|---|---|---|---|---|
| Modality | V | H | VH | V | H | VH |
| High | 96.8 ± 1.6 | 91.6 ± 1.7 | 89.0 ± 4.0 | 0.8 ± 0.06 | 1.9 ± 0.08 | 1.7 ± 0.10 |
| Low | 73.9 ± 4.7 | 68.2 ± 7.5 | 79.1 ± 3.4 | 1.3 ± 0.09 | 2.2 ± 0.07 | 2.0 ± 0.06 |
Figure 2.
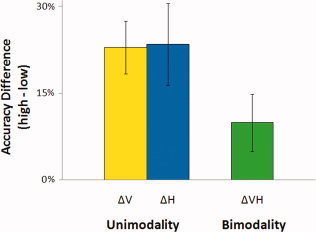
Accuracy difference across salience level as a function of sensory modality. [Color figure can be viewed in the online issue, which is available at www.interscience.wiley.com.]
Functional Localizer Analysis
In the localizer runs, we presented object or texture stimuli by vision or touch. Visuo‐haptic object‐selective brain regions were identified in each individual using a conjunction of two contrasts, “Visual Object > Visual Texture” and “Haptic Object > Haptic Texture.” Statistical parametric maps (SPM) of this conjunction contrast in individuals revealed three different visuo‐haptic object‐selective brain regions that responded more to both visual and haptic objects than textures: the left LOtv found in six participants, the anterior aspect of the left fusiform gyrus (aFG) in five participants, and the left IPS in five participants. Figure 3 shows visuo‐haptic object‐selective ROIs for each participant that passed a threshold of P (Bonferroni‐corrected) < 0.05, with corresponding t threshold of t (700) > 4.87 on sagittal and coronal slices of each individual's brain. Talairach coordinates of each ROI in each participant are shown in Table II. At this threshold, all three visuo‐haptic object‐selective brain regions, LOtv, aFG, and IPS, showed lateralized activations in the left hemisphere; however, at a more liberal threshold (voxelwise P < 0.05, t (700) > 1.96), all three ROIs showed a right‐hemisphere analog in most participants (5 out of 7).
Figure 3.

Individually defined regions‐of‐interest (ROIs) for visuo‐haptic object processing. Panels (a), (b), and (c) show left LOtv, left FG, and left IPS activations, respectively, on sagittal and coronal slices of each participant's brain. ROIs that were defined with a Boferroni‐corrected P value of 0.05 (t > 4.87) are marked with a yellow circle. LOtv, lateral occipital tactile‐visual area; FG, fusiform gyrus; IPS, intraparietal sulcus. Table II shows Talairach coordinates for the center of mass of each ROI. [Color figure can be viewed in the online issue, which is available at www.interscience.wiley.com.]
Table II.
Individual visuo‐haptic object‐selective ROIs in the functional localizer runs
| ROI | Participant | Talairach coordinate |
|---|---|---|
| (x, y, z) | ||
| L LOtv | P1 | −42, −77, 3 |
| P2 | −35, −65, 2 | |
| P3 | −45, −68, 17 | |
| P4 | −41, −65, −7 | |
| P5 | −38, −72, −3 | |
| P6 | −42, −57, −1 | |
| L aFG | P1 | −38, −46, −15 |
| P2 | −24, −39, −12 | |
| P3 | −42, −34, −20 | |
| P4 | −25, −41, −18 | |
| P5 | −38, −49, −13 | |
| L IPS | P1 | −28, −82, 43 |
| P2 | −37, −34, 56 | |
| P3 | −30, −44, 50 | |
| P4 | −24, −56, 57 | |
| P6 | −38, −35, 48 | |
| P (Boferroni corrected) < .05, t(700) > 4.87 | ||
The same conjunction contrast was also performed on the group‐average data from the localizer runs. Figure 4a shows the group‐average SPM of object‐selective brain regions that passed a threshold of P (Bonferroni‐corrected) < 0.05, with corresponding t threshold of t (4924) > 4.80 on lateral, posterior, and ventral views of an inflated cortical model of the brain. Figure 4b shows bilateral activation in the lateral occipital complex (LOC), FG, and IPS for visual object processing, and Figure 4c shows bilateral activation in the primary motor and somatosensory areas and unilateral activation in the left LOC, FG, and IPS for haptic object processing. Brain regions that responded to both visual and haptic objects are shown in green (Fig. 4a). A supplementary analysis with an FDR threshold of q = 0.001 (t (4924) > 4.20) and a cluster size threshold of 4 voxels in a group SPM revealed left LOtv (x,y,z = −45,−63,1) with a cluster size of 9,728 voxels, left aFG (x,y,z = −26,−41,−14) with a cluster size of 1,151, left IPS (x,y,z = −32,−39,52) with a cluster size of 6,081, and right hemisphere activations including right LOtv (x,y,z = 41,−62,−2) with a significantly smaller cluster size of 118 (82 times smaller than the cluster of left LOtv), right IPS (x,y,z = 32,−36,54) with a cluster size of 2,079, and no right FG activation.
Figure 4.

Localization of object‐selective brain regions. The upper panel (a) shows group‐average statistical parametric maps (SPMs) of object‐selective brain regions on lateral, posterior, and ventral views of an inflated cortical model of the brain. Visual object‐selective brain regions are shown in yellow, and haptic object‐selective brain regions are shown in blue. Green areas represent brain regions that respond to both visual and haptic objects. The middle panel (b) shows group SPMs of visual‐only object‐selective brain regions with a Bonferroni‐corrected P value of 0.05 (t > 4.80). The lower panel (c) shows group SPMs of haptic‐only object‐selective brain region with the same t‐statistics of (b). [Color figure can be viewed in the online issue, which is available at www.interscience.wiley.com.]
ROI Analysis of Experimental Data
Figure 5 depicts percent BOLD signal change in the three visuo‐haptic object‐selective ROIs to all six experimental conditions (high V, high H, high VH, low V, low H, and low VH). The first ROI analysis was performed on the ROIs defined within each individual subject (see Fig. 3). Figure 5a shows the BOLD activation averaged across all participants' individual ROIs. A two‐way repeated measures ANOVA, followed by paired‐sample t‐tests, was performed to assess BOLD differences among the experimental conditions using an alpha level of 0.05, and the sphericity assumption for within‐subjects ANOVA was tested using Mauchly's test. According to the test, it was assumed that the variances of different levels of each independent variable are not statistically different. Under this assumption, the ANOVA showed significant interactions between modality and stimulus salience on BOLD activation in left LOtv and left aFG (F (2,10) = 7.65, P = 0.01; F (2,8) = 25.8, P < 0.001), but not in left IPS (F (2,8) = 1.87, ns). In left LOtv and left aFG, we found no significant main effects of modality (F (2,10) = 1.66, ns; F (2,8) = 2.79, ns) and stimulus salience (F (1,5) = 0.131, ns; F (1,4) = 1.77, ns). In left IPS, however, we found a significant main effect of modality (F (2,8) = 8.66, P < 0.01) but no significant main effect of stimulus salience (F (1,4) = 0.546, ns). Paired‐sample t‐tests were then used to compare BOLD activations between experimental conditions across all participants' ROIs, and an alpha level of 0.05 was used for the t‐tests. In all three regions, left LOtv, left aFG, and left IPS, there was no significant difference of BOLD activation found between salience levels in unimodal conditions, V (t (5) = −1.03, P = 0.349; t (4) = 1.41, P = 0.23; t (4) = 0.489, P = 0.65), and H (t (5) = −1.37, P = 0.23; t (4) = −2.57, P = 0.062; t (4) = 0.051, P = 0.962). We, however, found significant differences between salience levels in bimodal condition (VH) in the ventral stream of object processing, the left LOtv (t (5) = 3.15, P = 0.025), and the left aFG (t (4) = 3.83, P = 0.019), but not in the dorsal stream, the left IPS (t (4) = 2.2, P = 0.093). It has been shown that the lateral occipital complex (LOC) is contrast‐invariant [Avidan et al.,2002] as well as size‐ and cue‐invariant [Grill‐Spector et al.,1999; Kastner et al.,2000; Mendola et al.,1999], and our results support contrast‐invariance of the LOC and the aFG.
Figure 5.

Activation as a function of region, salience, and stimulus modality. The upper panel (a) shows the averaged percent BOLD signal changes from individual participant's ROIs. The lower panel (b) shows percent BOLD signal changes extracted from group‐defined ROIs. [Color figure can be viewed in the online issue, which is available at www.interscience.wiley.com.]
The second ROI analysis was performed on the ROIs defined on the group‐average that passed a threshold of P (Bonferroni‐corrected) < 0.05 (Fig. 4a). Figure 5b shows the data from the group‐based analysis, presenting similar results to those from individual‐based analysis (Fig. 5a).
To assess integration in each region, we compared activation with visuo‐haptic bimodal stimulation to the combined activation of unisensory stimulations. Unisensory activations were combined using three different metrics: M(V,H), the mean of the two unisensory activations; Mx(V,H), the maximum of two unisensory activations; and S(V,H), the sum of two unisensory activations. The results are shown in Figure 6a. BOLD activation in the left LOtv with bimodal VH stimuli was greater than the mean (t (5) = 5.19, P = 0.0017) and the maximum (t (5) = 2.58, P = 0.0248) of two unisensory activations, but were not significantly different from the sum (t (5) = 0.141, P = 0.447) of two unisensory activations in high‐salience conditions. In contrast, in low‐salience conditions, BOLD activation in the left LOtv with bimodal VH stimuli was not significantly different from the mean (t (5) = 0.16, P = 0.439) or the maximum (t (5) = 0.949, P = 0.193) of two unisensory activations, but was significantly smaller than the sum (t (5) = 2.53, P < 0.0264) of two unisensory activations. The results in the left aFG showed the same pattern as in the left LOtv. The BOLD activation in the left aFG with bimodal VH stimuli was greater than the mean (t (4) = 3.25, P < 0.0157) and the maximum (t (4) = 2.52, P < 0.0328) of two unisensory activations but was not significantly different from the sum (t (5) = 0.515, P = 0.317) of two unisensory activations in high‐salience conditions. In low‐salience conditions, the BOLD activation in the left aFG with bimodal VH stimuli was not significantly different from the mean (t (4) = 0.277, P = 0.398) and the maximum (t (4) = 1.49, P = 0.105) of two unisensory activations but was significantly smaller than the sum (t (4) = 2.27, P < 0.043) of two unisensory activations. Lastly, the BOLD activation in the left IPS with bimodal VH stimuli was greater than the mean (t (4) = 2.77, P < 0.0253) but was not significantly different from the maximum (t (4) = 1.31, P = 0.131) and the sum (t (4) = 0.831, P = 0.226) of two unisensory activations in high‐salience conditions. In contrast, the BOLD activation in the left IPS with bimodal VH stimuli was not significantly different from the mean (t (4) = 1.16, P = 0.155) and the maximum (t (4) = 0.06, P = 0.477) of two unisensory activations but was marginally different from the sum (t (4) = 1.97, P = 0.06) of two unisensory activations in low‐salience conditions. We can see that none of the bimodal visuo‐haptic object‐selective regions passed the superadditivity criterion in either high‐ or low‐salience condition. For the comparison with the group data, the results from the group‐based analysis are shown in Figure 6b, presenting similar patterns to those from individual‐based analysis (Fig. 6a).
Figure 6.

Comparison of VH BOLD activation with mean, maximum, and sum criteria. The upper panel (a) shows the graphs from individually defined ROIs, and the lower panel (b) shows the graphs from group‐defined ROIs. [Color figure can be viewed in the online issue, which is available at www.interscience.wiley.com.]
To assess the rule of inverse effectiveness in our present data, we calculated the difference of BOLD activations between high‐ and low‐salience levels in V, H, and VH conditions (Fig. 7a). The results show that the multisensory enhancement increases as the effectiveness of the modality‐specific stimulus increases, surprisingly showing the opposite direction of the rule of inverse effectiveness (enhanced effectiveness). The BOLD differences in the left LOtv between high‐ and low‐salience levels of the visual‐specific (V) condition and the haptic‐specific (H) condition were significantly smaller than that of the bimodal (VH) condition (t (5) = 3.31, P < 0.0213 for V, t (5) = 4.15, P < 0.00892 for H). The BOLD difference in the left aFG between high‐ and low‐salience levels of the visual‐specific (V) condition was marginally different from that of the bimodal (VH) condition (t (4) = 2.67, P = 0.056) and the haptic‐specific (H) condition had a significantly smaller BOLD difference than in VH condition between high‐ and low‐salience levels (t (4) = 8.98, P < 0.001). In the left IPS, only BOLD difference between high‐ and low‐salience levels of the visual‐specific (V) condition was significantly smaller than that of the VH condition (t (4) = 3.24, P < 0.0317), but there was no difference found between H and VH conditions (t (4) = 1.16, P = 0.31). For the comparison with the group data, the results from the group‐based analysis are shown in Figure 7b, presenting similar patterns to those from individual‐based analysis (Fig. 7a).
Figure 7.

BOLD activation difference across salience as a function of stimulus modality and region. The upper panel (a) shows the results from individually defined ROIs, and the lower panel (b) shows the results from group‐defined ROIs. [Color figure can be viewed in the online issue, which is available at www.interscience.wiley.com.]
We also performed an investigatory whole‐brain group‐average SPM analysis on the experimental runs to assess whether other brain regions showed a pattern of enhanced effectiveness. This SPM analysis produced no significant clusters at an FDR threshold of q = 0.01 (t (9063) > 3.94) and a cluster size threshold of 4 voxels, likely due to the small sample size.
DISCUSSION
Consistent with previous research [Amedi et al.,2001,2002; Culham and Kanwisher,2001; Grefkes et al.,2002; James et al.,2002; Peltier et al.,2007; Pietrini et al.,2004; Stilla and Sathian,2008; Stoesz et al.,2003; Zhang et al.,2004], the present study confirmed the involvement of the lateral occipital cortex (LOtv) and IPS in the left hemisphere in both visual and haptic shape processing. Additionally, the present study also discovered an area in the left anterior fusiform gyrus (aFG) that was recruited with both haptic and visual discrimination, and was found consistently across subjects.
Yet, as we introduced earlier, the recruitment of these areas for both haptic and visual object recognition only implies areal convergence of haptic and visual inputs, not neuronal convergence. By comparing unimodal stimulation conditions (V, H) with a bimodal stimulation condition (VH), we were able to assess neuronal convergence. Similar to some recent studies of audio‐visual multisensory integration using fMRI [Beauchamp et al.,2004,2008; Hein et al.,2007; Kayser et al.,2005; van Atteveldt et al.,2004,2007], we found no evidence of superadditivity (sum rule, V + H < VH). At high salience, the VH stimulus was at best additive (V + H = VH), and at low salience, it was subadditive (V + H > VH). Although the VH stimulus in the present study passed the mean rule and maximum rule criteria for some conditions, those criteria are difficult to interpret when used with fMRI measurements [Stevenson et al.,2009]. This difficulty is further illustrated in Figure 6, where the mean and maximum criteria produce inconsistent outcomes across high and low levels of salience.
In addition to the criteria shown in Figure 6, we also applied the principle of inverse effectiveness to our three regions of interest as an alternative metric to assess neuronal convergence. Rather than inverse effectiveness, interestingly the data showed an opposite effect. With inverse effectiveness, activation to the combination of two unisensory stimuli is enhanced most when the unisensory components are least effective. Neural systems that display inverse effectiveness appear designed to gain more from the combination of signals when those signals are weak. In the present study, we found that the combination of two unisensory stimuli was enhanced most when the unisensory components were most effective. This effect, to the authors' knowledge, has never been reported before in the visuo‐haptic, audio‐visual, or audio‐haptic multisensory literature using invasive or noninvasive techniques in human or nonhuman subjects. We call the effect “enhanced effectiveness.”
Although we did not predict that visuo‐haptic object‐selective brain regions would show enhanced effectiveness, there are some explanations for the effect. A majority of the research on multisensory integration in humans is based on audio‐visual stimulation and activation of the STS. A majority of the research on animals involves spatial localization and single‐unit responses in the SC. Simply put, interactions between audition and vision may operate based on different mechanisms than those between vision and haptics, multisensory interactions for spatial localization may manifest differently from interactions for object processing, and finally, interactions in STS and SC may be different from those in occipito‐temporal and parietal cortex. All sensory modalities have unique characteristics of information processing. For instance, when measured behaviorally, all pairings of sensory modalities show unique asymmetries related to information transfer [Auvray et al.,2007,2008; Behrmann and Ewell,2003; Bensmaia et al.,2006; Blake et al.,2004; Craig,2006; Ernst et al.,2000; Guest and Spence,2003; James and Blake,2004; Shams et al.,2000,2002; Violentyev et al.,2005]. Our data suggest that visuo‐haptic integration in object‐selective cortex is performed in a different manner than audio‐visual or audio‐haptic integration in other parts of the brain.
Among the many differences between audio‐visual and visuo‐haptic object recognition, one distinct difference is the redundancy of the information we get from each modality. When one recognizes an object via vision and audition, the properties extracted from the object with each sensory modality are different. For example, the visual modality is most efficient at decomposing the retinal array into spatial frequencies and extracting complex form features. On the other hand, the auditory modality is most efficient at decomposing the cochlear array into temporal frequencies and then extracting complex sound features. Like vision, the haptic modality is efficient at decomposing the tactile array into spatial frequencies and extracting complex form features, like contour. Although this is a simplification, these examples illustrate the possibility that the processes involved in visual and auditory object recognition may be seen as more complimentary, compared to the processes involved in visual and haptic object recognition, which may be seen as more redundant. This is not to say that the information processed by vision and haptics is always redundant, or that vision and audition are always complimentary. For instance, hardness is easily extracted by haptics, but not vision, and color is easily extracted by vision and not haptics. In the present study, however, participants explored objects that could only be discriminated by their shape. Thus, the diagnostic features for the task were redundant across the two sensory modalities. If shape information is a critical component processed during visual and haptic object perception, we may expect to observe similar results in a condition with auditory shape presentation. Amedi et al. [2007] reported that the LOtv is also recruited during auditory object recognition only when shape information is extracted from visual‐to‐auditory sensory substitution soundscapes, suggesting that shape is a critical element that can be shared among different sensory modalities to recruit multimodal neurons in brain regions such as LOtv.
One potential problem with the speculation that enhanced effectiveness reflects the processing of redundant information across sensory modalities is that the behavioral data did not show a pattern of enhanced effectiveness, but instead showed inverse effectiveness, as would be predicted based on previous studies of human audio‐visual integration. Behavioral data, however, do not reflect the output of a single brain region. Thus, it may be the case that the bimodal object‐selective regions we analyzed show enhanced effectiveness, because they are primarily involved with processing the shape of objects, a characteristic that is processed redundantly across vision and haptics. The behavioral response, on the other hand, reflects a combination of many processes, not just those of the object‐selective regions we localized.
An alternative explanation for the enhanced effectiveness may be based on differences in the way that visual, auditory, and haptic stimuli are delivered to the subject. With audio‐visual combination stimuli, the viewing/listening time are equated, as are stimulus onset and offset. With visuo‐haptic combination stimuli, there can be a delay between visual stimulus onset and the time of first tactile contact, which could not have been perfectly controlled in the present experimental setup. Participants were instructed to make efforts to start visual and haptic explorations as simultaneously as possible, but their haptic explorations could have been initiated later than visual explorations due to the time needed to reach their hands to the stimuli. It should also be noted that the recognition time for haptics exceeded that for vision (Table I). Thus, both the onset and offset of stimulus exploration could have been asynchronous across modalities. Another consideration is that, in the present study, we used pictures of the objects for visual stimulation instead of having participants look at their hands touching the real objects. This could have led to a possible incongruence between the visual and haptic percepts and may have influenced the pattern of brain activation. In James and Blake's study [2004], however, they compared two conditions, one in which subjects looked at their hands touching a real stimulus and the other in which subjects looked at a computer‐generated visual stimulus while they touched a real object. The behavioral results of these two conditions were similar, suggesting that spatial discrepancy or incongruence between visual and haptic stimuli may not influence integration. In a future study, however, it would be valuable to manipulate the timing of visual and haptic onset and also the spatial congruence of the visual and haptic stimuli to assess their effects on sensory integration.
The principle of inverse effectiveness has been widely reported in the multisensory literature. Recently, however, several potential problems with the interpretation of inverse effectiveness have been revealed [Holmes,2007,2009]. The first potential problem is regression to the mean. If responses are conditionalized post hoc based on their effectiveness, then subsequent responses from that same neuron or to that same stimulus will regress to the mean. This phenomenon will inflate the probability of demonstrating inverse effectiveness purely by chance. If responses are conditionalized based on a priori experimental factors, such as the stimulus salience factor used in our experiment, regression to the mean is not a problem. The second potential problem is floor and ceiling effects. Both behavioral and neural systems have limits on performance. Pilot testing performed prior to our experiments determined the range of possible stimulus salience levels and the levels used in this experiment were chosen from the middle of the range. This ensured that ceiling and floor effects were not the cause of the effects. The third potential problem is the choice of units. For instance, changes in activation represented as a difference score may produce different results than those same changes represented as a proportion. Multisensory integration was assessed in our experiment using several different metrics. In summary, there are several common problems with the interpretation of inverse effectiveness. These same problems could also potentially compromise the interpretation of the new result shown here, enhanced effectiveness. The design of our experiment, however, took these potential problems into consideration.
The use of superadditivity as a metric for assessing multisensory enhancement is controversial [Beauchamp,2005; Laurienti et al.,2005; Stevenson et al.,2009]. With single‐unit recordings, superadditivity is more of a descriptive metric than a metric that is actually used to assess integration. Multisensory integration in single neurons is defined with the maximum rule. For instance, if a neuron responds more with a multisensory stimulus than with either unisensory stimulus, it shows multisensory enhancement. Unlike single‐unit recordings, fMRI measurements are derived from a vascular response to signaling in a population of neurons [Attwell and Iadecola,2002]. The neurons in that population will have a variety of response characteristics. For instance, in multisensory brain regions, there are unisensory and multisensory neurons [Allman et al.,2009]. Because fMRI measures from heterogeneous populations of neurons, neuronal convergence of multisensory inputs cannot be inferred using the maximum rule. A neuronal population that contained unisensory neurons alone responding to two separate sensory modalities would produce BOLD activation patterns that would exceed the maximum criterion [Laurienti et al.,2005; Stevenson et al.,2007,2009].
Because the maximum rule cannot be used with fMRI measures to assess multisensory integration, the use of superadditivity as a metric for use with fMRI was suggested [Calvert et al.,2000,2001; Stevenson et al.,2007; Stevenson and James,2009]. Theoretically, superadditivity overcomes the problems associated with the maximum rule, because the null hypothesis to be rejected when using superadditivity is that the multisensory activation must exceed the sum of the two unisensory activations. In practice, however, superadditivity has been criticized as to strict a criterion [Beauchamp,2005]. It is possible that this is due to another factor, which is that BOLD measurements suffer from an undetermined baseline. That is, for BOLD fMRI measurements, there exists no clearly defined absolute “zero” [Binder et al.,1999; Stark and Squire,2001]. Because the superadditivity metric contrasts the sum of two values with a single value, the influence of the “baseline” activation value (which is not zero) on the sum of the unisensory measurements is double the influence on the single multisensory measurement. Thus, strictness of the superadditivity criterion is dependent on the baseline condition, which may be arbitrarily chosen or show random fluctuation between experimental conditions, test sessions, subjects, or testing sites (for more details, see Stevenson et al. [2009]). Here, we found no evidence of superadditivity, but we did find evidence of enhanced effectiveness. Because of the arbitrary strictness of superadditivity, we suggest that the lack of superadditivity does not suggest that these brain regions are not integrating sensory information. Rather, we suggest that the presence of enhanced effectiveness suggests that these brain regions are integration visual‐haptic sensory information.
One potential issue with our experimental design is that processing bimodal stimuli may recruit more attentional resources than processing unimodal stimuli, and therefore, the object‐selective cortices may be activated more during bimodal conditions than during unimodal conditions. In the present study, however, we found no difference in the brain activation between bimodal and unimodal conditions for low salience, but found greater brain activation in the bimodal condition for high salience. If bimodal stimuli draw more attention from participants than unimodal stimuli, the results would show increased brain activation during bimodal conditions regardless of the salience of the stimuli. Thus, the currents results suggest that different attentional modulation during bimodal and unimodal shape discrimination cannot account for the patterns of activation.
There is also a possibility that visual imagery modulates cortical activation during haptic exploration of our stimuli. Lacey et al. [2007,2009] examined the relevance of visual imagery processes in the LOC and the IPS for visuo‐haptic object representation and proposed a putative model of modality‐independent multisensory shape representation in LOtv. According to their model, shape information can be processed either through bottom–up pathways starting from primary sensory brain regions or through top–down pathways arising from fronto‐parietal brain regions by means of the modulation of object familiarity. In their model, bottom–up resources are recruited more with unfamiliar objects and top–down resources are recruited more with familiar objects. In the present study, we used novel objects that were initially unfamiliar to the participants. They did, however, practice their tasks with same objects that were used in the experimental runs, which would have increased familiarity. Therefore, it is likely that our tasks recruited both bottom–up and top–down processes that take place during shape identification.
The three visuo‐haptic bimodal object‐selective brain regions in the present study were localized only in the left hemisphere. Considering that participants used both hands for palpation, this finding may suggest that visuo‐haptic multisensory object processing is lateralized more strongly to the left hemisphere. However, it should be noted that we used the conservative Bonferroni correction for multiple tests on the individual SPMs. With less conservative correction, we found a similar network of visuo‐haptic object‐selective brain regions in the right hemisphere, but weaker than that in the left hemisphere. ROI analyses on these right hemispheric cortical regions revealed a similar pattern of activation to those on the left visuo‐haptic object‐selective cortical regions, but the overall cluster sizes were smaller and effects were weaker than in the left hemisphere.
Another brain region that has been investigated thoroughly in both macaque monkeys and humans for its involvement in multisensory integration, but that was not included as one of our ROIs, is the superior temporal sulcus (STS). A majority of the research on STS has used audio‐visual stimulation, but at least one study [Bruce et al.,1981] has shown that macaque STS is sensitive to somatosensory, visual, and auditory stimulation. Likewise, a recent fMRI study [Beauchamp et al.,2008] showed that posterior STS in humans also responds to all three modalities: audition, vision, and touch. Thus, STS is an important site of polysensory integration. But, STS did not show evidence of visual and haptic convergence in the present study. This discrepancy is likely due to the type of stimuli used in the different studies. The present study used object stimuli, whereas other studies used basic stimuli, such as vibrations and tones of different frequency.
CONCLUSION
Our results demonstrate that visual and haptic sensory inputs converge on common object‐selective brain sites in the occipital, temporal, and parietal cortices to process object shape. Using the principle of inverse effectiveness as a criterion to assess visuo‐haptic multisensory integration, we found evidence of multisensory integration in these brain regions. The direction of the effect, however, was the opposite of that predicted. As the effectiveness of the unisensory component stimuli increased, so did the multisensory gain with the combination stimulus. We called this effect “enhanced effectiveness.” Future studies should consider the utility of inverse and enhanced effectiveness as tools for assessing multisensory integration in addition to more established metrics such as superadditivity.
Acknowledgements
We are grateful to Daniel Eylath and Aaron Scott for stimuli generation and presentation; Karin Harman James and the rest of the Indiana University Neuroimaging Group for their insights on this study; and June Yong Lee for his warm support.
REFERENCES
- Allman BL, Keniston LP, Meredith MA ( 2009): Not just for bimodal neurons anymore: The contribution of unimodal neurons to cortical multisensory processing. Brain Topogr 21( 3/4): 157–167. [DOI] [PMC free article] [PubMed] [Google Scholar]
- Amedi A, Malach R, Hendler T, Peled S, Zohary E ( 2001): Visuo‐haptic object‐related activation in the ventral visual pathway. Nat Neurosci 4: 324–330. [DOI] [PubMed] [Google Scholar]
- Amedi A, Jacobson G, Hendler T, Malach R, Zohary E ( 2002): Convergence of visual and tactile shape processing in the human lateral occipital complex. Cereb Cortex 12: 1202–1212. [DOI] [PubMed] [Google Scholar]
- Amedi A, Stern WM, Camprodon JA, Bermpohl F, Merabet L, Rotman S, Hemond C, Meijer P, Pascual‐Leone A ( 2007): Shape conveyed by visual‐to‐auditory sensory substitution activates the lateral occipital complex. Nat Neurosci 10: 687–689. [DOI] [PubMed] [Google Scholar]
- Attwell D, Iadecola C ( 2002): The neural basis of functional brain imaging signals. Trends Neurosci 25: 621–625. [DOI] [PubMed] [Google Scholar]
- Auvray M, Gallace A, Tan HZ, Spence C ( 2007): Crossmodal change blindness between vision and touch. Acta Psychol (Amst) 126: 79–97. [DOI] [PubMed] [Google Scholar]
- Auvray M, Gallace A, Hartcher‐O'Brien J, Tan HZ, Spence C ( 2008): Tactile and visual distractors induce change blindness for tactile stimuli presented on the fingertips. Brain Res 1213: 111–119. [DOI] [PubMed] [Google Scholar]
- Avidan G, Harel M, Hendler T, Ben‐Bashat D, Zohary E, Malach R ( 2002): Contrast sensitivity in human visual areas and its relationship to object recognition. J Neurophysiol 87: 3102–3116. [DOI] [PubMed] [Google Scholar]
- Beauchamp MS ( 2005): Statistical criteria in FMRI studies of multisensory integration. Neuroinformatics 3: 93–113. [DOI] [PMC free article] [PubMed] [Google Scholar]
- Beauchamp MS, Lee KE, Argall BD, Martin A ( 2004): Integration of auditory and visual information about objects in superior temporal sulcus. Neuron 41: 809–823. [DOI] [PubMed] [Google Scholar]
- Beauchamp MS, Yasar NE, Frye RE, Ro T ( 2008): Touch, sound and vision in human superior temporal sulcus. Neuroimage 41: 1011–1020. [DOI] [PMC free article] [PubMed] [Google Scholar]
- Behrmann M, Ewell C ( 2003): Expertise in tactile pattern recognition. Psychol Sci 14: 480–486. [DOI] [PubMed] [Google Scholar]
- Bensmaia SJ, Killebrew JH, Craig JC ( 2006): Influence of visual motion on tactile motion perception. J Neurophysiol 96: 1625–1637. [DOI] [PMC free article] [PubMed] [Google Scholar]
- Binder JR, Frost JA, Hammeke TA, Bellgowan PS, Rao SM, Cox RW ( 1999): Conceptual processing during the conscious resting state. A functional MRI study. J Cogn Neurosci 11: 80–95. [DOI] [PubMed] [Google Scholar]
- Blake R, Sobel KV, James TW ( 2004): Neural synergy between kinetic vision and touch. Psychol Sci 15: 397–402. [DOI] [PubMed] [Google Scholar]
- Bodegard A, Geyer S, Grefkes C, Zilles K, Roland PE ( 2001): Hierarchical processing of tactile shape in the human brain. Neuron 31: 317–328. [DOI] [PubMed] [Google Scholar]
- Brainard DH ( 1997): The psychophysics toolbox. Spat Vis 10: 433–436. [PubMed] [Google Scholar]
- Bruce C, Desimone R, Gross CG ( 1981): Visual properties of neurons in a polysensory area in superior temporal sulcus of the macaque. J Neurophysiol 46: 369–384. [DOI] [PubMed] [Google Scholar]
- Calvert GA, Campbell R, Brammer MJ ( 2000): Evidence from functional magnetic resonance imaging of crossmodal binding in the human heteromodal cortex. Curr Biol 10: 649–657. [DOI] [PubMed] [Google Scholar]
- Calvert GA, Hansen PC, Iversen SD, Brammer MJ ( 2001): Detection of audio‐visual integration sites in humans by application of electrophysiological criteria to the BOLD effect. Neuroimage 14: 427–438. [DOI] [PubMed] [Google Scholar]
- Craig JC ( 2006): Visual motion interferes with tactile motion perception. Perception 35: 351–367. [DOI] [PubMed] [Google Scholar]
- Culham JC, Kanwisher NG ( 2001): Neuroimaging of cognitive functions in human parietal cortex. Curr Opin Neurobiol 11: 157–163. [DOI] [PubMed] [Google Scholar]
- Ernst MO, Banks MS, Bulthoff HH ( 2000): Touch can change visual slant perception. Nat Neurosci 3: 69–73. [DOI] [PubMed] [Google Scholar]
- Forman SD, Cohen JD, Fitzgerald M, Eddy WF, Mintun MA, Noll DC ( 1995): Improved assessment of significant activation in functional magnetic resonance imaging (fMRI): Use of a cluster‐size threshold. Magn Reson Med 33: 636–647. [DOI] [PubMed] [Google Scholar]
- Friston KJ, Holmes AP, Price CJ, Buchel C, Worsley KJ ( 1999): Multisubject fMRI studies and conjunction analyses. Neuroimage 10: 385–396. [DOI] [PubMed] [Google Scholar]
- Genovese CR, Lazar NA, Nichols T ( 2002): Thresholding of statistical maps in functional neuroimaging using the false discovery rate. Neuroimage 15: 870–878. [DOI] [PubMed] [Google Scholar]
- Gibson JJ ( 1963): The useful dimensions of sensitivity. Am Psychol 18: 1–15. [Google Scholar]
- Grefkes C, Geyer S, Schormann T, Roland P, Zilles K ( 2001): Human somatosensory area 2: Observer‐independent cytoarchitectonic mapping, interindividual variability, and population map. Neuroimage 14: 617–631. [DOI] [PubMed] [Google Scholar]
- Grefkes C, Weiss PH, Zilles K, Fink GR ( 2002): Crossmodal processing of object features in human anterior intraparietal cortex: An fMRI study implies equivalencies between humans and monkeys. Neuron 35: 173–184. [DOI] [PubMed] [Google Scholar]
- Grill‐Spector K, Kushnir T, Edelman S, Avidan G, Itzchak Y, Malach R ( 1999): Differential processing of objects under various viewing conditions in the human lateral occipital complex. Neuron 24: 187–203. [DOI] [PubMed] [Google Scholar]
- Grill‐Spector K, Kourtzi Z, Kanwisher N ( 2001): The lateral occipital complex and its role in object recognition. Vision Res 41( 10/11): 1409–1422. [DOI] [PubMed] [Google Scholar]
- Guest S, Spence C ( 2003): Tactile dominance in speeded discrimination of textures. Exp Brain Res 150: 201–207. [DOI] [PubMed] [Google Scholar]
- Hein G, Doehrmann O, Muller NG, Kaiser J, Muckli L, Naumer MJ ( 2007): Object familiarity and semantic congruency modulate responses in cortical audiovisual integration areas. J Neurosci 27: 7881–7887. [DOI] [PMC free article] [PubMed] [Google Scholar]
- Holmes NP ( 2007): The law of inverse effectiveness in neurons and behaviour: Multisensory integration versus normal variability. Neuropsychologia 45: 3340–3345. [DOI] [PubMed] [Google Scholar]
- Holmes NP ( 2009): The principle of inverse effectiveness in multisensory integration: Some statistical considerations. Brain Topogr 21( 3/4): 168–176. [DOI] [PubMed] [Google Scholar]
- Humphrey GK, Goodale MA, Jakobson LS, Servos P ( 1994): The role of surface information in object recognition: Studies of a visual form agnosic and normal subjects. Perception 23: 1457–1481. [DOI] [PubMed] [Google Scholar]
- James TW, Blake R ( 2004): Perceiving object motion using vision and touch. Cogn Affect Behav Neurosci 4: 201–207. [DOI] [PubMed] [Google Scholar]
- James TW, Humphrey GK, Gati JS, Servos P, Menon RS, Goodale MA ( 2002): Haptic study of three‐dimensional objects activates extrastriate visual areas. Neuropsychologia 40: 1706–1714. [DOI] [PubMed] [Google Scholar]
- James TW, Culham J, Humphrey GK, Milner AD, Goodale MA ( 2003): Ventral occipital lesions impair object recognition but not object‐directed grasping: An fMRI study. Brain 126 ( Pt 11): 2463–2475. [DOI] [PubMed] [Google Scholar]
- James TW, James KH, Humphrey GK, Goodale MA ( 2005): Do visual and tactile object representations share the same neural substrate? In: Heller MA, Ballesteros S, editors. Touch and Blindness: Psychology and Neuroscience. Mahwah, NJ: Lawrence Erlbaum. [Google Scholar]
- Kastner S, De Weerd P, Ungerleider LG ( 2000): Texture segregation in the human visual cortex: A functional MRI study. J Neurophysiol 83: 2453–2457. [DOI] [PubMed] [Google Scholar]
- Kayser C, Petkov CI, Augath M, Logothetis NK ( 2005): Integration of touch and sound in auditory cortex. Neuron 48: 373–384. [DOI] [PubMed] [Google Scholar]
- Kitada R, Kito T, Saito DN, Kochiyama T, Matsumura M, Sadato N, Lederman SJ ( 2006): Multisensory activation of the intraparietal area when classifying grating orientation: A functional magnetic resonance imaging study. J Neurosci 26: 7491–7501. [DOI] [PMC free article] [PubMed] [Google Scholar]
- Lacey S, Campbell C, Sathian K ( 2007): Vision and touch: Multiple or multisensory representations of objects? Perception 36: 1513–1521. [DOI] [PubMed] [Google Scholar]
- Lacey S, Tal N, Amedi A, Sathian K ( 2009): A putative model of multisensory object representation. Brain Topogr 21( 3/4): 269–274. [DOI] [PMC free article] [PubMed] [Google Scholar]
- Laurienti PJ, Perrault TJ, Stanford TR, Wallace MT, Stein BE ( 2005): On the use of superadditivity as a metric for characterizing multisensory integration in functional neuroimaging studies. Exp Brain Res 166( 3/4): 289–297. [DOI] [PubMed] [Google Scholar]
- Malach R, Reppas JB, Benson RR, Kwong KK, Jiang H, Kennedy WA, Ledden PJ, Brady TJ, Rosen BR, Tootell RB ( 1995): Object‐related activity revealed by functional magnetic resonance imaging in human occipital cortex. Proc Natl Acad Sci USA 92: 8135–8139. [DOI] [PMC free article] [PubMed] [Google Scholar]
- Marr D ( 1982): Vision: A Computational Investigation into the Human Representation and Processing of Visual Information. San Francisco: W.H. Freeman; xvii, 397 pp. [Google Scholar]
- Mendola JD, Dale AM, Fischl B, Liu AK, Tootell RB ( 1999): The representation of illusory and real contours in human cortical visual areas revealed by functional magnetic resonance imaging. J Neurosci 19: 8560–8572. [DOI] [PMC free article] [PubMed] [Google Scholar]
- Milner AD, Perrett DI, Johnston RS, Benson PJ, Jordan TR, Heeley DW, Bettucci D, Mortara F, Mutani R, Terazzi E, Davidson DLW ( 1991): Perception and action in ‘visual form agnosia’. Brain 114 ( Pt 1B): 405–428. [DOI] [PubMed] [Google Scholar]
- Newell FN, Ernst MO, Tjan BS, Bulthoff HH ( 2001): Viewpoint dependence in visual and haptic object recognition. Psychol Sci 12: 37–42. [DOI] [PubMed] [Google Scholar]
- Norman JF, Norman HF, Clayton AM, Lianekhammy J, Zielke G ( 2004): The visual and haptic perception of natural object shape. Percept Psychophys 66: 342–351. [DOI] [PubMed] [Google Scholar]
- Pelli DG ( 1997): The VideoToolbox software for visual psychophysics: Transforming numbers into movies. Spat Vis 10: 437–442. [PubMed] [Google Scholar]
- Peltier S, Stilla R, Mariola E, LaConte S, Hu X, Sathian K ( 2007): Activity and effective connectivity of parietal and occipital cortical regions during haptic shape perception. Neuropsychologia 45: 476–483. [DOI] [PubMed] [Google Scholar]
- Pietrini P, Furey ML, Ricciardi E, Gobbini MI, Wu WH, Cohen L, Guazzelli M, Haxby JV ( 2004): Beyond sensory images: Object‐based representation in the human ventral pathway. Proc Natl Acad Sci USA 101: 5658–5663. [DOI] [PMC free article] [PubMed] [Google Scholar]
- Shams L, Kamitani Y, Shimojo S ( 2000): Illusions. What you see is what you hear. Nature 408: 788. [DOI] [PubMed] [Google Scholar]
- Shams L, Kamitani Y, Shimojo S ( 2002): Visual illusion induced by sound. Brain Res Cogn Brain Res 14: 147–152. [DOI] [PubMed] [Google Scholar]
- Stanford TR, Stein BE ( 2007): Superadditivity in multisensory integration: Putting the computation in context. Neuroreport 18: 787–792. [DOI] [PubMed] [Google Scholar]
- Stark CE, Squire LR ( 2001): When zero is not zero: The problem of ambiguous baseline conditions in fMRI. Proc Natl Acad Sci USA 98: 12760–12766. [DOI] [PMC free article] [PubMed] [Google Scholar]
- Stein BE, Stanford TR ( 2008): Multisensory integration: Current issues from the perspective of the single neuron. Nat Rev Neurosci 9: 255–266. [DOI] [PubMed] [Google Scholar]
- Stevenson RA, James TW ( 2009): Audiovisual integration in human superior temporal sulcus: Inverse effectiveness and the neural processing of speech and object recognition. Neuroimage 44: 1210–1223. [DOI] [PubMed] [Google Scholar]
- Stevenson RA, Kim S, James TW( 2009): An additive‐factors design to disambiguate neuronal and areal convergence: Measuring multisensory interactions between audio, visual, and haptic sensory streams using fMRI. Exp Brain Res 198: 183–194. [DOI] [PubMed] [Google Scholar]
- Stevenson RA, Geoghegan ML, James TW ( 2007): Superadditive BOLD activation in superior temporal sulcus with threshold non‐speech objects. Exp Brain Res 179: 85–95. [DOI] [PubMed] [Google Scholar]
- Stilla R, Sathian K ( 2008): Selective visuo‐haptic processing of shape and texture. Hum Brain Mapp 29: 1123–1138. [DOI] [PMC free article] [PubMed] [Google Scholar]
- Stoesz MR, Zhang M, Weisser VD, Prather SC, Mao H, Sathian K ( 2003): Neural networks active during tactile form perception: Common and differential activity during macrospatial and microspatial tasks. Int J Psychophysiol 50( 1/2): 41–49. [DOI] [PubMed] [Google Scholar]
- Talairach J, Tournoux P ( 1988): Co‐planar stereotaxic atlas of the human brain: 3‐dimensional proportional system: An approach to cerebral imaging. Stuttgart, NY: Thieme; viii, 122 pp. [Google Scholar]
- Thirion B, Pinel P, Meriaux S, Roche A, Dehaene S, Poline JB ( 2007): Analysis of a large fMRI cohort: Statistical and methodological issues for group analyses. Neuroimage 35: 105–120. [DOI] [PubMed] [Google Scholar]
- van Atteveldt N, Formisano E, Goebel R, Blomert L ( 2004): Integration of letters and speech sounds in the human brain. Neuron 43: 271–282. [DOI] [PubMed] [Google Scholar]
- van Atteveldt NM, Formisano E, Blomert L, Goebel R ( 2007): The effect of temporal asynchrony on the multisensory integration of letters and speech sounds. Cereb Cortex 17: 962–974. [DOI] [PubMed] [Google Scholar]
- Van Boven RW, Ingeholm JE, Beauchamp MS, Bikle PC, Ungerleider LG ( 2005): Tactile form and location processing in the human brain. Proc Natl Acad Sci USA 102: 12601–12605. [DOI] [PMC free article] [PubMed] [Google Scholar]
- Violentyev A, Shimojo S, Shams L ( 2005): Touch‐induced visual illusion. Neuroreport 16: 1107–1110. [DOI] [PubMed] [Google Scholar]
- Zangaladze A, Epstein CM, Grafton ST, Sathian K ( 1999): Involvement of visual cortex in tactile discrimination of orientation. Nature 401: 587–590. [DOI] [PubMed] [Google Scholar]
- Zhang M, Weisser VD, Stilla R, Prather SC, Sathian K ( 2004): Multisensory cortical processing of object shape and its relation to mental imagery. Cogn Affect Behav Neurosci 4: 251–259. [DOI] [PubMed] [Google Scholar]
- Zhang M, Mariola E, Stilla R, Stoesz M, Mao H, Hu X, Sathian K ( 2005): Tactile discrimination of grating orientation: fMRI activation patterns. Hum Brain Mapp 25: 370–377. [DOI] [PMC free article] [PubMed] [Google Scholar]