

Abstract
Purpose:
To assess whether structural and metabolic brain abnormalities are correlated in MTLE/HS syndrome.
Methods:
Optimized voxel‐based morphometry (VBM) of gray matter concentration (GMC) and gray matter volume (GMV) and proton magnetic resonance spectroscopy measurements from both‐sided hippocampal and thalamic regions were performed in 20 MTLE/HS patients and 20 sex‐ and age‐matched healthy controls. The local GMC and GMV values were calculated in both the affected and unaffected hippocampi and ipsilateral and contralateral thalami in patients and healthy subjects, and these were compared. VBM variables and NAA, NAA/Cr and NAA/(Cr+Cho) values from the investigated brain regions were correlated.
Results:
(1) Analysis revealed significantly more extensive GMV reduction than GMC reduction in patients' affected hippocampus. In addition, significant GMV reduction was observed in the ipsilateral thalamus in MTLE/HS patients. (2) Significant decreases in all VBM and MRS variables were revealed in the affected hippocampus. Whilst practically normal GMC values were revealed in patients' both‐sided thalamic regions, a significant decrease in local GMV and metabolic measurements were found in the patients' ipsilateral thalamus. (3) Pearson's correlations between structural and metabolic abnormalities were significant for the ipsilateral thalamus only.
Conclusion:
Structural and metabolic abnormalities as detected by optimized voxel‐based morphometry and 1H MRS in hippocampal and thalamic regions are only partially correlated in MTLE/HS patients. It seems therefore reasonable that both methods reflect different aspects of brain pathology, which, at least to some degree, might be independently ongoing. Hum Brain Mapp 2009. © 2008 Wiley‐Liss, Inc.
Keywords: mesial temporal lobe epilepsy, hippocampal sclerosis, thalamus, voxel‐based morphometry, MR spectroscopy
INTRODUCTION
Hippocampal sclerosis (HS) represents a well‐defined structural pathology, the presence of which often correlates with a typical electroclinical syndrome of mesial temporal lobe epilepsy (MTLE) and an excellent surgical outcome. HS is characterized by an increased hippocampal T2 signal and/or atrophied hippocampal formation on the MRI, significant neuronal cell loss in one or more hippocampal subfields, and increased glial cell numbers in the histological examination [Greenfield et al.,1997; Jackson et al.,1993]. A proton magnetic resonance spectroscopy (1H MRS) performed in MTLE/HS subjects typically reveals a lower N‐acetyl‐aspartate (NAA) concentration or an abnormal ratio of NAA to creatine/phosphocreatine (Cr) and choline (Cho) in the affected hippocampus [Cendes et al.,1997b]. The described structural and metabolic abnormalities are tightly linked to each other. Interestingly, both the structural and metabolic changes in MTLE/HS patients are not solely confined to the hippocampus, but extended to other brain regions. Significant volume loss was repeatedly found in the extra‐hippocampal gray matter (GM) (the parahippocampal regions, the amygdala, and the entorhinal and perirhinal cortices, but also in the lateral temporal neocortex, the cingulate gyrus, the basal forebrain, the thalamic and striatal nuclei, the medial orbitofrontal areas, the insula, and the cerebellum) [Bernasconi et al.,2000,2003,2004; Bonilha et al.,2003,2005,2007; Coste et al.,2002; Deasy et al.,2000; Dreifuss et al.,2001; Duzel et al.,2006; Hagemann et al.,2002; Jutila et al.,2001; Keller et al.,2004; Moran et al.,2001; Mueller et al.,2006; Natsume et al.,2003]. A recent study in patients with hippocampal sclerosis investigated by 31P MR spectroscopic imaging showed decreased PCr/ATP in the bilateral hippocampus, the ipsilateral thalamus, and the striatum [Pan et al.,2005]. Using 1H MRS, we recently observed a statistically significant reduction of NAA, NAA/Cr, and NAA/(Cr + Cho) ratios in the thalamus ipsilateral to the hippocampal sclerosis [Fojtikova et al.,2007]. These MRS findings fit well with the results of several previous PET and SPECT studies revealing extended extrahippocampal functional changes in MTLE/HS patients [Arnold et al.,1996; Benedek et al.,2004; Henry et al.,1990,1993; Juhasz et al.,1999; Newberg et al.,2000; Shin et al.,2001; Tae et al.,2005; Yune et al.,1998].
The true relationship between hippocampal volumes and 1H MRS abnormalities in patients with MTLE/HS remains a matter of discussion. Whilst Cendes et al. [1997b] and Sawrie et al. [2001] found a significant correlation between hippocampal volumes and 1H MRS in MTLE/HS, Kuzniecky et al. [2001] and Duzel et al. [2004] did not replicate earlier findings. In all the cited papers, the correlations between structural and metabolic measurements were investigated only within the hippocampal regions, and no study analyzed these correlations within the extrahippocampal GM. Furthermore, to the best of our knowledge, all the studies on the relationship between GM volumes and metabolic abnormalities in MTLE/HS were performed using MR volumetry for measurements of volume changes. Optimized voxel‐based morphometry (VBM) was recently developed to increase the sensitivity of standard VBM in detecting neuroanatomical differences in vivo using structural MRIs [Ashburner and Friston,2000; Good et al.,2001a,b]. Generally, the most important advantage of VBM is its ability to examine the entire brain, rather than a particular structure, in an unbiased and objective manner. The optimized VBM technique incorporates an additional modulation step, enabling us to independently study changes in GM volumes and GM concentrations between subject cohorts. The analysis of the modulated GM images can then detect regional differences in the volume of GM (GMV), and the analysis of the unmodulated GM images allows the detection of regional differences of GM concentration (GMC).
In this study, we used optimized VBM with and without modulation and 1H MRS measurements (NAA, NAA/Cr, and NAA/(Cr + Cho) ratios) from both‐sided hippocampal and thalamic regions in MTLE/HS patients to assess in a complex manner whether structural and metabolic abnormalities are correlated in this specific syndrome. We also correlated both structural and metabolic changes within the brains of the investigated patients with their ages at seizure onset and with the duration of their epilepsy.
MATERIALS AND METHODS
Subjects
MTLE/HS patients from our fourth level surgical centre for epilepsy were admitted to the study. We analyzed the data of 20 adult patients (17 women, 3 men) in whom we had recorded temporal lobe seizures during video EEG monitoring and who fulfilled the diagnostic criteria for mesial temporal lobe epilepsy with hippocampal sclerosis. The control group consisted of 20 sex‐ and age‐matched healthy volunteers. The mean age of the subjects in the patient group was 38.9 ± 9.68 years (ages ranged from 17 to 55 years; median age 38.5 years); the mean age in the control group was 38.4 ± 7.94 years (ages ranged from 18 to 51 years; median age 39 years). All the patients had been routinely investigated, including long‐term semi‐invasive video‐EEG monitoring, high‐resolution MRI, and neuropsychological testing. The diagnosis of unilateral mesial temporal lobe epilepsy in our patients was based on a consonance of history data, ictal and interictal EEG findings, ictal semiology, neuropsychology, interictal SPECT/PET, and neuroimaging findings. Visual inspection of the MRI scans by two independent physicians (a radiologist and an epileptologist) revealed unequivocal unilateral hippocampal sclerosis: in 14 patients on the left side and in 6 patients on the right side. All our patients had MRI evidence of unilateral hippocampal sclerosis concordant with the EEG lateralization of the epileptogenic zone. None of our patients revealed other brain structural lesions on MRI scans, and none of the patients had undergone previous intracranial surgery. After completing preoperative investigation (including present VBM/MRS examination), eight patients underwent anteromedial temporal resections, all of them with seizure‐free outcome (Engel I). The mean age of the patients at the time of seizure onset was 9.7 ± 9.8 years, with a median 7.5 years. The mean disease duration in our patients was 28.3 ± 13.64 years, with a median 30 years. According to their history data (derived from seizure diaries), at the time of the investigation, the frequency of complex partial seizures (CPS) ranged in our patients from 0 to 56 seizures per month, with a mean of 9.5 ± 12.98. The frequency of secondary generalized seizures (sGTCS) ranged from 0 to 7 seizures per month, with a mean of 0.4 ± 1.56. All patients had been seizure free for ≥24 h before MRI investigation. The majority of the healthy subjects in the control group were volunteers from the professional sector with no history of neurological or psychiatric diseases. Informed consent was obtained from each participant after all of the procedures were fully explained. The study received the approval of the local ethics committee.
MRI Data Acquisition
MR examinations were performed on a 1.5 T scanner (Siemens Magnetom Symphony, Erlangen, Germany) using a multichannel head coil. The MRI protocol for voxel‐based morphometry included 3D T1‐weighted magnetization prepared rapid gradient echo (MPRAGE) sequence with TR = 1.7 s, TE = 3.93 ms, TI = 1.1 s, FA = 15°, 512 × 512 matrix size, FOV 246 × 246 mm, and 160 sagittal slices with slice thickness = 1.17 mm. The protocol for spectroscopic examination included proton single‐voxel spectroscopy (SVS) and spectroscopic imaging (SI). SVS was measured using the PRESS sequence from the left and right hippocampus with the following parameters: TR = 1.5 s, TE = 80 ms; number of averages = 128; VOI (volume of interest) size = 20 × 20 × 20 mm; 1,024 time points and bandwidth 1,000 Hz. The VOIs included part of the head and the mid region of the left and right hippocampus. Both water‐suppressed spectra and spectra without water suppression (32 averages) were acquired. SI was measured using the volume preselected PRESS‐SI sequence from both thalami with the following parameters: TR = 1.5 s; TE = 80 ms; number of averages = 12; FOV 80 × 80 mm; VOI = 40 × 40 mm; slice thickness = 10 mm; 8 × 8 elliptically weighted (hamming weighting) encoding steps; 1,024 time points and bandwidth 1,000 Hz. Both water‐suppressed SI spectra and SI spectra without water suppression (4 averages) were acquired. The exact positioning of the VOI was adjusted according to the individual anatomy using MRI images.
Data Processing
Voxel‐based morphometry
Anatomical MRI data were analyzed using SPM2 (Wellcome Department of Cognitive Neurology, http://www.fil.ion.ucl.ac.uk) running in MATLAB 6.5 (The MathWorks, Natick, MA). Preprocessing of structural data was performed using VBM2 toolbox (http://dbm.neuro.uni-jena.de/vbm/vbm2-for-spm2/). The method used for optimized VBM with and without modulation, as described by Good et al. [2001b], was slightly modified for this study. Previous VBM studies found significant left–right asymmetries in GM in healthy brains [Good et al.,2001a]. For this reason, a symmetrical customized template and customized symmetrical priors were generated to allow a combination of right and left TLE in the SPM analysis. To create this template, the original (20 images) and left–right flipped images (20 images) of the control group were normalized to the standard SPM template. The normalized data were then smoothed with an 8 mm full‐width‐at‐half‐maximum (FWHM) isotropic Gaussian kernel and averaged. To create symmetrical priors, the normalized original and left‐right flipped images of the control group were segmented into GM, white matter (WM), and cerebrospinal fluid (CSF) by using the SPM standard segmentation procedure and standard priors. After smoothing the segmented images with an 8‐mm FWHM isotropic Gaussian kernel, they were averaged to create customized symmetrical GM, WM, and CSF priors [Mueller et al.,2006]. Using these priors, all images were then segmented into GM partitions and modulated for GM volume inferences. Finally, smoothing was performed with 10‐mm Gaussian kernel for pure segmented (unmodulated) GM segments. Because the step of modulation introduces some smoothness to data, modulated GM segments were smoothed with 8‐mm Gaussian kernel only. This approach results in comparable smoothness of statistical parametric maps. Local GMC and GMV values considered in ensuing statistics were calculated as an average intensity value within region of GM modulated/unmodulated unflipped segments specified by mask of either hippocampus or thalamus. These masks were drawn from AAL atlas (http://www.cyceron.fr/freeware/). Despite we used own study specific priors manual examining of all subjects shown us a good correspondence between masks and subjects' shapes. The local GMC and GMV values in both the affected and unaffected hippocampi and ipsilateral and contralateral thalami in patients and both‐sided hippocampi and thalami in healthy subjects were used for the analysis of group differences and correlations with MRS data. We did not use voxel‐based approach for correlations as the local CMC and GMV values better match the MRS VOIs.
MRS
SI spectra were first zero filled to a 16 × 16 matrix arriving at a final nominal voxel size of 5 × 5 × 10 mm. No additional k‐space filtering was performed. Both SVS and SI data were processed by the LCModel using water as an internal standard accounting for the different water content in WM, GM, and CSF as well as for the different point spread functions in T1‐weighted MPRAGE images and SI data [Gasparovic et al.,2006; Provencher,1993]. Concentration values of water in individual tissue types and the corresponding water relaxation times were adopted from Gasparovic et al. [2006]. Calculated concentrations of individual metabolites evaluated by the LCModel were further corrected for metabolites' relaxation times T1 and T2. T1 and T2 values for the hippocampus were adopted from Christiansen et al. [1993]; T1 and T2 values for the thalamus from Frahm et al. [1989]. All SI data calculations and corrections were performed using the LCModel. Four adjacent voxels situated in the center of the right and left thalamus were selected for the evaluation of metabolite concentrations from SI data (for details, see [Fojtikova et al.,2006,2007]. All selected voxels were located entirely within the thalamus to minimize partial volume effects. The values of NAA, NAA/Cr, and NAA/(Cr + Cho) ratios were used for the statistical analysis.
Statistical Analysis
Group differences for age were tested by t test. The modulated and unmodulated GM images (GMV and GMC) were analyzed using SPM2. A comparison of GMC and GMV between the patients and the healthy controls was performed. For this purpose, the x axis of GM segments of patients with right‐sided hippocampal sclerosis was flipped. Total gray matter volume was included as nuisance variable for GMC and GMV comparisons. Contrasts were defined to detect whether each voxel of tissue had a lower probability of being GM between patients and controls. Resultant t‐statistic maps were thresholded at a P value of < 0.05 by using false discovery rate (FDR) to correct for multiple comparisons.
To assess whether analyzed variables (local GMC, local GMV, NAA, NAA/Cr, and NAA/(Cr + Cho) ratios) within determined hippocampal and thalamic voxels differed significantly between patients and controls, a t‐test was performed. Each of the measurements was analyzed separately. Values from affected (with hippocampal sclerosis) and nonaffected (without hippocampal sclerosis) hippocampi in patients were compared with corresponding values in controls, and they were also compared each to other. The same approach was used for the assessment of the ipsilateral (ipsilateral to the affected hippocampus) and contralateral (contralateral to the affected hippocampus) thalami. Before the use of the t‐test, the normal distribution of the values in patients and in healthy controls was verified. Statistical significance was considered to be present if P < 0.05 in all the tested parameters.
Pearson's correlations were used to assess whether structural (local GMC or local GMV) and metabolic data [NAA, NAA/Cr, and NAA/(Cr + Cho)] differed in a correlated manner across patients (and controls). Correlations were calculated separately for the affected and nonaffected hippocampus and the ipsilateral and contralateral thalamus. Additional Pearson's correlations were calculated to assess whether potential structural or metabolic changes within the brains of the investigated patients were related to the age of seizure onset or to the duration of epilepsy. We did not investigate here correlations with actual seizure frequency as these values are not necessarily a reflection of epilepsy severity (in some patients recently referred to our center, immediate modifications in antiepileptic treatment dramatically changed the seizure frequency). Lifetime seizure burden could often not be obtained reliably.
To exclude the impact of the epileptic focus lateralization, T‐statistics and Pearson's correlations (as described earlier) were separately calculated for the subgroups of left‐ and right‐sided MTLE/HS patients. Subgroup differences for age, duration of epilepsy, and frequency of CPS and sGTCS, as well as for a percentage of subjects with rare contralateral interictal epileptic discharges in semi‐invasive EEG were tested by a t‐test.
The Statistica program from StatSoft was used for the data analysis.
RESULTS
Regions with significantly reduced GMC and GMV in MTLE/HS subjects are given in Table I. SPM analysis clearly revealed more extensive GMV reduction than GMC reduction in the patients' affected hippocampus/parahippocampal region (see Fig. 1). In addition, significant GMV reductions were also observed in several distant brain regions. The clusters were found in the ipsilateral thalamus, the ipsilateral cerebellar hemisphere, the ipsilateral caudate, the ipsilateral posterior cingulate (BA 31), the ipsilateral lateral temporal neocortex, and the contralateral anterior cingulate (BA 32).
Table I.
Brain areas that showed significantly reduced gray matter concentration/volume in MTLE/HS patients compared to controls
| Anatomical location | MNI coordinates (x, y, z) | Cluster size (number of voxels) | Z‐score |
|---|---|---|---|
| GMC | |||
| Ipsi hippocampus and parahippocampal gyrus | −31, −9, −22 | 1229 | 5.48 |
| GMV | |||
| Ipsi hippocampus and parahippocampal gyrus | −25, −36, −4 | 9160 | 5.66 |
| Ipsi cerebellum | −14, −32, −20 | 843 | 4.43 |
| Ipsi thalamus | −7, −25, 13 | 785 | 4.37 |
| Ipsi caudate | −11, 11, 6 | 276 | 4.06 |
| Ipsi posterior cingulate/BA 31/ | −13, −24, 42 | 276 | 3.99 |
| Ipsi superior temporal gyrus /BA 22/ | −58, −55, 13 | 111 | 3.65 |
| Ipsi inferior temporal gyrus/BA 37/ | −59, −52, −11 | 115 | 3.64 |
| Contra anterior cingulate/BA 32/ | 5, 20, 39 | 202 | 3.61 |
Voxel size 1 × 1 × 1 mm. Ipsi, ipsilateral; contra, contralateral to the side of HS. Height threshold: P < 0.05 FDR corrected; minimum cluster size = 100 adjacent voxels.
Figure 1.
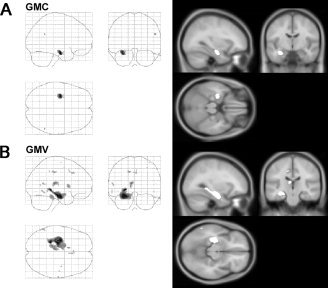
Gray matter abnormalities in MTLE/HS. A: Reductions in gray matter concentration (GMC) compared to healthy subjects. B: Reductions in gray matter volume (GMV) compared to controls. Both maps P < 0.05 FDR corrected.
Significant decreases in the local GMC (P < 0.05; P < 0.001), local GMV (P < 0.0001; P < 0.00001), NAA (P < 0.01; P < 0.00001), NAA/Cr (P < 0.01; P < 0.0005), and NAA/(Cr + Cho) values (P < 0.01; P < 0.0001) were revealed in the affected hippocampi compared to the values within the unaffected hippocampi (in patients) and the healthy hippocampi (in controls). A significant NAA decrease was also observed in the unaffected hippocampi in the patient group in comparison with the hippocampal NAA values in the control group (P = 0.001) (Table II, Fig. 2A). Whilst practically normal GMC values were revealed in patients' both‐sided thalamic regions, a significant decrease in local GMV (P < 0.001) and metabolic measurements (NAA, P < 0.0001; NAA/(Cr + Cho), P < 0.00001) were found in the patients' ipsilateral thalamus when compared with that of the controls. Additionally, there were significant differences in metabolic values between the ipsi‐ and contralateral thalami in patients (NAA, P < 0.0005; NAA/(Cr + Cho), P < 0.01) (Table III; Fig. 3A).
Table II.
Local GMC, GMV, and analyzed metabolic values in both the affected and unaffected hippocampi in patients and healthy subjects (standard deviations are given in parentheses)
| Affected hippocampus (patients) | Unaffected hippocampus (patients) | Healthy hippocampus (controls) | |
|---|---|---|---|
| GMC | 0.57 (0.042) | 0.60 (0.027) | 0.61 (0.022) |
| GMV | 0.38 (0.047) | 0.45 (0.047) | 0.46 (0.045) |
| NAA | 9.55 (0.971) | 10.37 (0.808) | 11.13 (0.808) |
| NAA/Cr | 0.80 (0.117) | 0.90 (0.110) | 0.91 (0.101) |
| NAA/(Cr + Cho) | 0.64 (0.090) | 0.72 (0.087) | 0.74 (0.078) |
Figure 2.
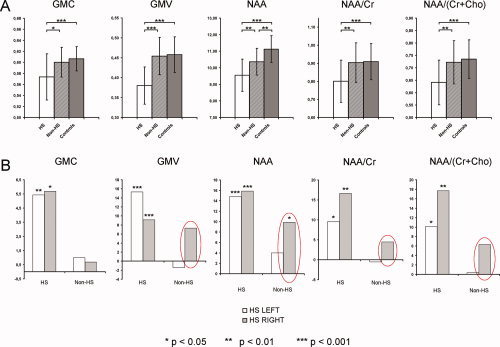
A: Comparisons of analyzed data from the affected (HS), contralateral unaffected (non‐HS), and healthy hippocampi (complete group data); B: Relative differences between values of analyzed variables in patients and healthy controls, separately for the subgroups of patients with left‐ (white bar) and right‐sided HS pathology (gray bar).
Table III.
Local GMC, GMV, and analyzed metabolic values in both the ipsilateral and contralateral thalami in patients and healthy subjects (standard deviations are given in parentheses)
| Ispilateral thalamus (patients) | Contralateral thalamus (patients) | Healthy thalamus (controls) | |
|---|---|---|---|
| GMC | 0.46 (0.046) | 0.47 (0.044) | 0.47 (0.028) |
| GMV | 0.31 (0.049) | 0.33 (0.052) | 0.35 (0.030) |
| NAA | 16.27 (1.972) | 17.67 (2.765) | 17.64 (2.413) |
| NAA/Cr | 1.08 (0.191) | 1.10 (0.234) | 1.122 (0.222) |
| NAA/(Cr + Cho) | 0.91 (0.134) | 0.98 (0.148) | 0.99 (0.134) |
Figure 3.
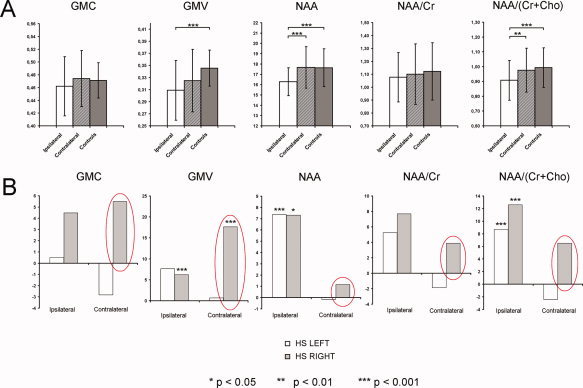
A: Comparisons of analyzed data from the ipsilateral, contralateral, and healthy thalami (complete group data); B: Relative differences between values of analyzed variables in patients and healthy controls, separately for the subgroups of patients with left‐ and right‐sided HS pathology.
Interestingly, distinct patterns of structural and metabolic changes within both the hippocampal and thalamic regions were observed in patients with left‐ and right‐sided HS pathology. The relative differences between the values of the analyzed variables in patients and healthy controls (healthy controls minus patients divided by healthy controls), separately for the subgroups of patients with left‐ and right‐sided HS, are shown in Figures 2B and 3B. Obviously, more pronounced changes were seen in the nonaffected/contralateral hippocampi and thalami in the right‐sided MTLE/HS patients. These changes were highly stable across analyzed variables and anatomical structures (hippocampi and thalami). The differences were significant for local GMC (P = 0.020) and local GMV (P = 0.003) in the contralateral thalamus only (t‐test). There were no significant differences in age (38.2 ± 9.96 vs. 40.7 ± 9.67; P = 0.30), duration of epilepsy (27.6 ± 11.97 vs. 29.7 ± 18.18; P = 0.38), frequency of CPSs (10.9 ± 15.2 vs. 6.0 ± 4.56; P = 0.14), or frequency of sGTCS (0.53 ± 1.86 vs. 0.37 ± 0.39; P = 0.53) between the patients with left and right MTLE/HS. The percentage of subjects with rare contralateral interictal epileptic discharges in semi‐invasive EEG was counterbalanced in both subgroups (60% in left HS and 66% in right HS).
Pearson's correlations between structural and metabolic abnormalities were significant for the ipsilateral thalamus only (local GMV positively correlated with NAA/Cr (P = 0.037, r = 0.469) and NAA/(Cr + Cho) (P = 0.026, r = 0.497) (see Fig. 4).
Figure 4.

Significant correlations between structural and metabolic abnormalities within the ipsilateral thalamus. A: Correlations between local GMV and NAA/Cr; B: Correlations between local GMV and NAA/(Cr + Cho). [Color figure can be viewed in the online issue, which is available at www.interscience.wiley.com.]
In contrast, no significant correlations were found in the affected or in the contralateral hippocampus when the data of both left and right MTLE/HS were analyzed together. However, positive correlations were found in the affected hippocampus between local GMC values and NAA (P = 0.033; r = 0.847), as well as between local GMV and NAA/Cr (P = 0.026, r = 0.864) in the subgroup of right‐sided MTLE/HS patients. In the same subgroup of patients, significant correlations were also observed between the local GMV and NAA/Cr (P = 0.023; r = 0.873) and NAA/(Cr + Cho) (P = 0.015; r = 0.899) in the ipsilateral thalamus. However, the limited value of these calculations due to the very small sample size in the right‐sided HS subgroup has to be emphasized. At the same time, no significant correlations within both hippocampi and thalami were revealed in the subgroup of left‐sided MTLE/HS. No significant correlations between VBM and MRS data were found in healthy controls.
No significant correlations were detected among the investigated GMC, GMV, or metabolic data and age of seizure onset. Regarding correlations with disease duration, the only significant (negative) correlation was found for the ipsilateral thalamic GMV data (P = 0.035; r = −0.473).
DISCUSSION
Widespread structural and metabolic abnormalities beyond the hippocampal formation have repeatedly been described in patients suffering from MTLE/HS. Using MR volumetry and particularly VBM techniques, a significant volume loss has also been systematically found in various extra‐hippocampal gray matter structures [Bernasconi et al.,2000,2003,2004; Bonilha et al.,2003,2005,2007; Coste et al.,2002; Deasy et al.,2000; Dreifuss et al.,2001; Hagemann et al.,2002; Jutila et al.,2001; Keller and Roberts,2007; Keller et al.,2004; Moran et al.,2001; Mueller et al.,2006; Natsume et al.,2003]. Our findings of significant GM volume reductions beyond the affected hippocampus and the ipsilateral parahippocampal region, especially in the ipsilateral thalamus and striatum, the ipsilateral cerebellum, the ipsilateral posterior cingulate, the lateral temporal neocortex, and finally in the contralateral anterior cingulate cortex, are in good agreement with previous VBM studies. In contrast to VBM, metabolic abnormalities as measured by 1H MRS reflect neuronal and glial dysfunction rather than absolute neuronal cell loss. Indeed, several animal and human studies support this statement. Animal experiments suggest that NAA changes are detected before neuronal cell loss and reflect metabolic changes that can be reversible [Rango et al.,1995]. Abnormal levels of hippocampal NAA/Cr ratio have also been found in MRI‐negative patients with TLE [Connelly et al.,1998]. And finally, abnormal preoperative levels of NAA/Cr have been shown to normalize in the contralateral hippocampus after successful epilepsy surgery [Cendes et al.,1997a; Hugg et al.,1996]. Another support of the functional nature of 1H MRS abnormalities in epilepsy may come from correlative studies. Even if earlier studies on the relationship between volumetry and 1H MRS in MTLE/HS patients found a significant correlation between hippocampal volumes and metabolic abnormalities [Sawrie et al.,2001], recent papers did not provide positive results. Hippocampal volumes did not correlate with Cr/NAA and NAA/(Cr + Cho) ratios in three recent studies [Duzel et al.,2004; Kuzniecky et al.,1998,2001].
Also in our study, which is, to our knowledge, the first one separately correlating GM concentrations and GM volumes with extensive 1H MRS data, neither local GMC nor local GMV correlated with any metabolic measures in the hippocampal regions. Positive correlations between structural and metabolic data that were found in the affected hippocampus in the subgroup of right‐sided MTLE/HS patients have to be interpreted very cautiously. The most important reason for this cautious interpretation is that these data arise from the analysis of a very limited sample of subjects (N = 6), and a simultaneous analysis of more numerous left‐sided MTLE/HS did not find similar relationship. Our data support the hypothesis that VBM (similarly to MR volumetry) and 1H MRS are measuring aspects of two related but distinct pathological hippocampal phenomena (neuronal loss vs. neuroglial dysfunction). This is also in agreement with recent histological evidence showing that volumetry correlated with neuroglial ratios measured in a resected hippocampal specimen whilst there was no such correlation for 1H MRS [Sawrie et al.,2001]. Our finding of significant correlations between structural and metabolic abnormalities within the ipsilateral thalamus might be viewed as an example of the possibility that sometimes and/or in some brain regions, structural and functional changes can be going on in connection with each other. As far as we are aware, this is the first volumetric/metabolic correlative analysis that also includes extra‐hippocampal gray matter measures in MTLE/HS patients. Parallel investigations of hippocampal and extra‐hippocampal regions may substantially contribute to the understanding of MTLE/HS complexity.
The only significant correlation between structural changes and disease duration was found for the same ipsilateral thalamus. The volume of this subcortical structure decreased with the longer duration of epilepsy. This finding, as the only one from this study, further supports the progressive nature of chronic temporal lobe epilepsy. However, such a relationship was observed neither for thalamic functional changes nor for hippocampal structural/functional abnormalities. The absence of significant correlations between volumetric or metabolic hippocampal abnormalities and the duration of epilepsy was also observed in some previous studies [Burneo et al.,2004; Duzel et al.,2004; Fojtikova et al.,2007; Garcia et al.,1997; Trenerry et al.,1993].
Probably, the most interesting finding in our study emerged from a separate analysis of the left‐ and right‐sided HS pathology. Apparently, distinct patterns of structural and metabolic changes within both hippocampal and thalamic regions were observed in two subgroups. Compared with the patients with left‐sided MTLE/HS, our patients with right‐sided pathology exhibited more pronounced changes in almost all the investigated MRI data from the contralateral hippocampi and thalami. Very likely due to the small sample size, the differences were significant for the local GMC and GMV in the contralateral thalamus only, but borderline significance was also found in the contralateral hippocampus (P = 0.065 for local GMV; P = 0.067 for NAA). These differences can hardly be explained by different clinical characteristics of patients in both subgroups; they did not significantly differ in any of the investigated variables (age of seizure onset, duration of epilepsy, seizure frequency, and interictal EEG pattern). Additionally, in favor of distinct functional properties of right‐ and left‐sided MTLE/HS, significant correlations between neuroanatomical and functional changes were found exclusively in the subgroup of right‐sided MTLE/HS patients. On the other hand, the serious limitation of these findings due to the small sample size in the right‐sided HS group must be stressed. Interestingly, some previous VBM studies have also consistently noted that, despite the overall symmetry, the intensity of atrophy and regional distribution is not exactly the same for left‐ and right‐sided MTLE/HS [Bernasconi et al.,2004; Bonilha et al.,2004,2007; Keller et al.,2002]. Differences between left‐ and right‐sided MTLE/HS cannot be accurately evaluated from our data. Further extensive study focused on this issue seems to be promising.
Acknowledgements
The authors are grateful to J. Horký, F. Jírů, and A. Škoch for their neuroimaging contributions.
REFERENCES
- Arnold S,Schlaug G,Niemann H,Ebner A,Luders H,Witte OW,Seitz RJ ( 1996): Topography of interictal glucose hypometabolism in unilateral mesiotemporal epilepsy. Neurology 46: 1422–1430. [DOI] [PubMed] [Google Scholar]
- Ashburner J,Friston KJ ( 2000): Voxel‐based morphometry—The methods. Neuroimage 11(6,Part 1): 805–821. [DOI] [PubMed] [Google Scholar]
- Benedek K,Juhasz C,Muzik O,Chugani DC,Chugani HT ( 2004): Metabolic changes of subcortical structures in intractable focal epilepsy. Epilepsia 45: 1100–1105. [DOI] [PubMed] [Google Scholar]
- Bernasconi N,Bernasconi A,Caramanos Z,Andermann F,Dubeau F,Arnold DL ( 2000): Morphometric MRI analysis of the parahippocampal region in temporal lobe epilepsy. Ann NY Acad Sci 911: 495–500. [DOI] [PubMed] [Google Scholar]
- Bernasconi N,Andermann F,Arnold DL,Bernasconi A ( 2003): Entorhinal cortex MRI assessment in temporal, extratemporal, and idiopathic generalized epilepsy. Epilepsia 44: 1070–1074. [DOI] [PubMed] [Google Scholar]
- Bernasconi N,Duchesne S,Janke A,Lerch J,Collins DL,Bernasconi A ( 2004): Whole‐brain voxel‐based statistical analysis of gray matter and white matter in temporal lobe epilepsy. Neuroimage 23: 717–723. [DOI] [PubMed] [Google Scholar]
- Bonilha L,Kobayashi E,Rorden C,Cendes F,Li LM ( 2003): Medial temporal lobe atrophy in patients with refractory temporal lobe epilepsy. J Neurol Neurosurg Psychiatry 74: 1627–1630. [DOI] [PMC free article] [PubMed] [Google Scholar]
- Bonilha L,Rorden C,Castellano G,Pereira F,Rio PA,Cendes F,Li LM ( 2004): Voxel‐based morphometry reveals gray matter network atrophy in refractory medial temporal lobe epilepsy. Arch Neurol 61: 1379–1384. [DOI] [PubMed] [Google Scholar]
- Bonilha L,Rorden C,Castellano G,Cendes F,Li LM ( 2005): Voxel‐based morphometry of the thalamus in patients with refractory medial temporal lobe epilepsy. Neuroimage 25: 1016–1021. [DOI] [PubMed] [Google Scholar]
- Bonilha L,Rorden C,Halford JJ,Eckert M,Appenzeller S,Cendes F,Li LM ( 2007): Asymmetrical extra‐hippocampal grey matter loss related to hippocampal atrophy in patients with medial temporal lobe epilepsy. J Neurol Neurosurg Psychiatry 78: 286–294. [DOI] [PMC free article] [PubMed] [Google Scholar]
- Burneo JG,Knowlton RC,Faught E,Martin R,Sawrie S,Kuzniecky RI ( 2004): Chronic temporal lobe epilepsy: Spatial extent and degree of metabolic dysfunction studied with magnetic resonance spectroscopy (MRS). Epilepsy Res 62: 119–124. [DOI] [PubMed] [Google Scholar]
- Cendes F,Andermann F,Dubeau F,Matthews PM,Arnold DL ( 1997a): Normalization of neuronal metabolic dysfunction after surgery for temporal lobe epilepsy. Evidence from proton MR spectroscopic imaging. Neurology 49: 1525–1533. [DOI] [PubMed] [Google Scholar]
- Cendes F,Caramanos Z,Andermann F,Dubeau F,Arnold DL ( 1997b): Proton magnetic resonance spectroscopic imaging and magnetic resonance imaging volumetry in the lateralization of temporal lobe epilepsy: A series of 100 patients. Ann Neurol 42: 737–746. [DOI] [PubMed] [Google Scholar]
- Christiansen P,Toft P,Larsson HB,Stubgaard M,Henriksen O ( 1993): The concentration of N‐acetyl aspartate, creatine + phosphocreatine, and choline in different parts of the brain in adulthood and senium. Magn Reson Imaging 11: 799–806. [DOI] [PubMed] [Google Scholar]
- Connelly A,Van PW,Porter DA,Johnson CL,Duncan JS,Gadian DG ( 1998): Proton magnetic resonance spectroscopy in MRI‐negative temporal lobe epilepsy. Neurology 51: 61–66. [DOI] [PubMed] [Google Scholar]
- Coste S,Ryvlin P,Hermier M,Ostrowsky K,Adeleine P,Froment JC,Mauguiere F ( 2002): Temporopolar changes in temporal lobe epilepsy: A quantitative MRI‐based study. Neurology 59: 855–861. [DOI] [PubMed] [Google Scholar]
- Deasy NP,Jarosz JM,Elwes RC,Polkey CE,Cox TC ( 2000): Thalamic changes with mesial temporal sclerosis: MRI. Neuroradiology 42: 346–351. [DOI] [PubMed] [Google Scholar]
- Dreifuss S,Vingerhoets FJ,Lazeyras F,Andino SG,Spinelli L,Delavelle J,Seeck M ( 2001): Volumetric measurements of subcortical nuclei in patients with temporal lobe epilepsy. Neurology 57: 1636–1641. [DOI] [PubMed] [Google Scholar]
- Duzel E,Kaufmann J,Guderian S,Szentkuti A,Schott B,Bodammer N,Hopf M,Kanowski M,Tempelmann C,Heinze HJ ( 2004): Measures of hippocampal volumes, diffusion and 1H MRS metabolic abnormalities in temporal lobe epilepsy provide partially complementary information. Eur J Neurol 11: 195–205. [DOI] [PubMed] [Google Scholar]
- Duzel E,Schiltz K,Solbach T,Peschel T,Baldeweg T,Kaufmann J,Szentkuti A,Heinze HJ ( 2006): Hippocampal atrophy in temporal lobe epilepsy is correlated with limbic systems atrophy. J Neurol 253: 294–300. [DOI] [PubMed] [Google Scholar]
- Fojtikova D,Brazdil M,Horky J,Mikl M,Kuba R,Krupa P,Rektor I ( 2006): Magnetic resonance spectroscopy of the thalamus in patients with typical absence epilepsy. Seizure 15: 533–540. [DOI] [PubMed] [Google Scholar]
- Fojtikova D,Brazdil M,Skoch A,Jiru F,Horky J,Marecek R,Mikl M,Krupa P ( 2007): Magnetic resonance spectroscopy of the thalamus in patients with mesial temporal lobe epilepsy and hippocampal sclerosis. Epileptic Disord 9( Suppl 1): S59–S67. [DOI] [PubMed] [Google Scholar]
- Frahm J,Bruhn H,Gyngell ML,Merboldt KD,Hanicke W,Sauter R ( 1989): Localized proton NMR spectroscopy in different regions of the human brain in vivo. Relaxation times and concentrations of cerebral metabolites. Magn Reson Med 11: 47–63. [DOI] [PubMed] [Google Scholar]
- Garcia PA,Laxer KD,van der GJ,Hugg JW,Matson GB,Weiner MW ( 1997): Correlation of seizure frequency with N‐acetyl‐aspartate levels determined by 1H magnetic resonance spectroscopic imaging. Magn Reson Imaging 15: 475–478. [DOI] [PubMed] [Google Scholar]
- Gasparovic C,Song T,Devier D,Bockholt HJ,Caprihan A,Mullins PG,Posse S,Jung RE,Morrison LA ( 2006): Use of tissue water as a concentration reference for proton spectroscopic imaging. Magn Reson Med 55: 1219–1226. [DOI] [PubMed] [Google Scholar]
- Good CD,Johnsrude I,Ashburner J,Henson RN,Friston KJ,Frackowiak RS ( 2001a): Cerebral asymmetry and the effects of sex and handedness on brain structure: A voxel‐based morphometric analysis of 465 normal adult human brains. Neuroimage 14: 685–700. [DOI] [PubMed] [Google Scholar]
- Good CD,Johnsrude IS,Ashburner J,Henson RN,Friston KJ,Frackowiak RS ( 2001b): A voxel‐based morphometric study of ageing in 465 normal adult human brains. Neuroimage 14(1, Part 1): 21–36. [DOI] [PubMed] [Google Scholar]
- Greenfield JG,Graham DI,Lantos PL ( 1997): Greenfield's Neuropathology, 6th ed. London: Arnold. [Google Scholar]
- Hagemann G,Lemieux L,Free SL,Krakow K,Everitt AD,Kendall BE,Stevens JM,Shorvon SD ( 2002): Cerebellar volumes in newly diagnosed and chronic epilepsy. J Neurol 249: 1651–1658. [DOI] [PubMed] [Google Scholar]
- Henry TR,Mazziotta JC,Engel J Jr,Christenson PD,Zhang JX,Phelps ME,Kuhl DE ( 1990): Quantifying interictal metabolic activity in human temporal lobe epilepsy. J Cereb Blood Flow Metab 10: 748–757. [DOI] [PubMed] [Google Scholar]
- Henry TR,Mazziotta JC,Engel J Jr ( 1993): Interictal metabolic anatomy of mesial temporal lobe epilepsy. Arch Neurol 50: 582–589. [DOI] [PubMed] [Google Scholar]
- Hugg JW,Kuzniecky RI,Gilliam FG,Morawetz RB,Fraught RE,Hetherington HP ( 1996): Normalization of contralateral metabolic function following temporal lobectomy demonstrated by 1H magnetic resonance spectroscopic imaging. Ann Neurol 40: 236–239. [DOI] [PubMed] [Google Scholar]
- Jackson GD,Berkovic SF,Duncan JS,Connelly A ( 1993): Optimizing the diagnosis of hippocampal sclerosis using MR imaging. AJNR Am J Neuroradiol 14: 753–762. [PMC free article] [PubMed] [Google Scholar]
- Juhasz C,Nagy F,Watson C,da Silva EA,Muzik O,Chugani DC,Shah J,Chugani HT ( 1999): Glucose and [11C]flumazenil positron emission tomography abnormalities of thalamic nuclei in temporal lobe epilepsy. Neurology 53: 2037–2045. [DOI] [PubMed] [Google Scholar]
- Jutila L,Ylinen A,Partanen K,Alafuzoff I,Mervaala E,Partanen J,Vapalahti M,Vainio P,Pitkanen A ( 2001): MR volumetry of the entorhinal, perirhinal, and temporopolar cortices in drug‐refractory temporal lobe epilepsy. AJNR Am J Neuroradiol 22: 1490–1501. [PMC free article] [PubMed] [Google Scholar]
- Keller SS,Wieshmann UC,Mackay CE,Denby CE,Webb J,Roberts N ( 2002): Voxel based morphometry of grey matter abnormalities in patients with medically intractable temporal lobe epilepsy: Effects of side of seizure onset and epilepsy duration. J Neurol Neurosurg Psychiatry 73: 648–655. [DOI] [PMC free article] [PubMed] [Google Scholar]
- Keller SS,Wilke M,Wieshmann UC,Sluming VA,Roberts N ( 2004): Comparison of standard and optimized voxel‐based morphometry for analysis of brain changes associated with temporal lobe epilepsy. Neuroimage 23: 860–868. [DOI] [PubMed] [Google Scholar]
- Keller SS,Roberts N ( 2007): Voxel‐based morphometry of temporal lobe epilepsy: An introduction and review of the literature. Epilepsia; doi: 10.1111/j. 1528–1167. 2007.01485.x. [DOI] [PubMed]
- Kuzniecky R,Hugg JW,Hetherington H,Butterworth E,Bilir E,Faught E,Gilliam F ( 1998): Relative utility of 1H spectroscopic imaging and hippocampal volumetry in the lateralization of mesial temporal lobe epilepsy. Neurology 51: 66–71. [DOI] [PubMed] [Google Scholar]
- Kuzniecky R,Palmer C,Hugg J,Martin R,Sawrie S,Morawetz R,Faught E,Knowlton R ( 2001): Magnetic resonance spectroscopic imaging in temporal lobe epilepsy: Neuronal dysfunction or cell loss? Arch Neurol 58: 2048–2053. [DOI] [PubMed] [Google Scholar]
- Moran NF,Lemieux L,Kitchen ND,Fish DR,Shorvon SD ( 2001): Extrahippocampal temporal lobe atrophy in temporal lobe epilepsy and mesial temporal sclerosis. Brain 124(Part 1): 167–175. [DOI] [PubMed] [Google Scholar]
- Mueller SG,Laxer KD,Cashdollar N,Buckley S,Paul C,Weiner MW ( 2006): Voxel‐based optimized morphometry (VBM) of gray and white matter in temporal lobe epilepsy (TLE) with and without mesial temporal sclerosis. Epilepsia 47: 900–907. [DOI] [PMC free article] [PubMed] [Google Scholar]
- Natsume J,Bernasconi N,Andermann F,Bernasconi A ( 2003): MRI volumetry of the thalamus in temporal, extratemporal, and idiopathic generalized epilepsy. Neurology 60: 1296–1300. [DOI] [PubMed] [Google Scholar]
- Newberg AB,Alavi A,Berlin J,Mozley PD,O'Connor M,Sperling M ( 2000): Ipsilateral and contralateral thalamic hypometabolism as a predictor of outcome after temporal lobectomy for seizures. Eur J Nucl Med 41: 1964–1968. [PubMed] [Google Scholar]
- Pan JW,Kim JH,Cohen‐Gadol A,Pan C,Spencer DD,Hetherington HP ( 2005): Regional energetic dysfunction in hippocampal epilepsy. Acta Neurol Scand 111: 218–224. [DOI] [PubMed] [Google Scholar]
- Provencher SW ( 1993): Estimation of metabolite concentrations from localized in vivo proton NMR spectra. Magn Reson Med 30: 672–679. [DOI] [PubMed] [Google Scholar]
- Rango M,Spagnoli D,Tomei G,Bamonti F,Scarlato G,Zetta L ( 1995): Central nervous system trans‐synaptic effects of acute axonal injury: A 1H magnetic resonance spectroscopy study. Magn Reson Med 33: 595–600. [DOI] [PubMed] [Google Scholar]
- Sawrie SM,Martin RC,Knowlton R,Faught E,Gilliam F,Kuzniecky R ( 2001): Relationships among hippocampal volumetry, proton magnetic resonance spectroscopy, and verbal memory in temporal lobe epilepsy. Epilepsia 42: 1403–1407. [DOI] [PubMed] [Google Scholar]
- Shin WC,Hong SB,Tae WS,Seo DW,Kim SE ( 2001): Ictal hyperperfusion of cerebellum and basal ganglia in temporal lobe epilepsy: SPECT subtraction with MRI coregistration. Eur J Nucl Med 42: 853–858. [PubMed] [Google Scholar]
- Tae WS,Joo EY,Kim JH,Han SJ,Suh YL,Kim BT,Hong SC,Hong SB ( 2005): Cerebral perfusion changes in mesial temporal lobe epilepsy: SPM analysis of ictal and interictal SPECT. Neuroimage 24: 101–110. [DOI] [PubMed] [Google Scholar]
- Trenerry MR,Jack CR Jr,Sharbrough FW,Cascino GD,Hirschorn KA,Marsh WR,Kelly PJ,Meyer FB ( 1993): Quantitative MRI hippocampal volumes: Association with onset and duration of epilepsy, and febrile convulsions in temporal lobectomy patients. Epilepsy Res 15: 247–252. [DOI] [PubMed] [Google Scholar]
- Yune MJ,Lee JD,Ryu YH,Kim DI,Lee BI,Kim SJ ( 1998): Ipsilateral thalamic hypoperfusion on interictal SPECT in temporal lobe epilepsy. Eur J Nucl Med 39: 281–285. [PubMed] [Google Scholar]