

Abstract
Multifocal functional magnetic resonance imaging has recently been introduced as an alternative method for retinotopic mapping, and it enables effective functional localization of multiple regions‐of‐interest in the visual cortex. In this study we characterized interactions in V1 with spatially and temporally identical stimuli presented alone, or as a part of a nine‐region multifocal stimulus. We compared stimuli at different contrasts, collinear and orthogonal orientations and spatial frequencies one octave apart. Results show clear attenuation of BOLD signal from the central region in the multifocal condition. The observed modulation in BOLD signal could be produced either by neural suppression resulting from stimulation of adjacent regions of visual field, or alternatively by hemodynamic saturation or stealing effects in V1. However, we find that attenuation of the central response persists through a range of contrasts, and that its strength varies with relative orientation and spatial frequency of the central and surrounding stimulus regions, indicating active suppression mechanisms of neural origin. Our results also demonstrate that the extent of the signal spreading is commensurate with the extent of the horizontal connections in primate V1. Hum Brain Mapp, 2008. © 2008 Wiley‐Liss, Inc.
Keywords: multifocal fMRI, V1, surround modulation, retinotopy
INTRODUCTION
Surround modulation is ubiquitous in vision. Electrophysiological recordings show that the response of a V1 neuron to a stimulus in its receptive field center is reduced in the presence of surrounding stimuli [Angelucci et al. 2002b; Blakemore and Tobin, 1972; Cavanaugh et al., 2002a; DeAngelis et al., 1994; Jones et al., 2001; Knierim and van Essen, 1992; Maffei and Fiorentini, 1976; Nelson and Frost, 1978; for a review, see Series et al., 2003], but also facilitatory interactions have been reported [Levitt and Lund, 1997; Maffei and Fiorentini, 1976; Mizobe et al., 2001]. Psychophysical experiments show both suppressive and facilitatory effects from surrounding regions in experiments measuring either detection [Chen and Tyler, 2001; Petrov et al., 2005; Polat and Sagi, 1993; Takahashi and Ejima, 1985; Yu et al., 2003] or apparent contrast [Cannon and Fullenkamp, 1991; Chubb et al., 1989; Ejima and Takahashi, 1985; Xing and Heeger, 2001] of the target. Suppression between adjacent parts of visual field has been demonstrated using functional magnetic resonance imaging (fMRI) [Harrison et al., 2007; Kastner et al., 2001; Williams et al., 2003; Zenger‐Landolt and Heeger, 2003] and magnetoencephalography (MEG) [Haynes et al., 2003; Ohtani et al., 2002]. Furthermore, reduced blood oxygenation level dependent (BOLD), [Zenger‐Landolt and Heeger, 2003], and neuromagnetic [Haynes et al., 2003] signals in V1 have been directly linked to psychophysical surround masking. Measuring the increase or decrease of neural activity as a function of neighboring visual stimulation and cortical activation is a basic question in the neuroscience of vision, and important for assessing theories addressing efficiency in stimulus encoding, and the integration of visual information across space [Felsen et al., 2005; Rao and Ballard, 1999; Vinje and Gallant, 2002].
Because the hemodynamic signal measured in fMRI is tightly coupled with neural activity [Logothetis et al., 2001; Mukamel et al., 2005; Shmuel et al., 2006], fMRI allows in principle a quantitative method for measuring surround modulation in humans. Traditional block and event‐related fMRI designs are inefficient for studying multiple visual field positions, because each location, and in a study of lateral interaction also each combination, must be measured in different time windows. In this study we show that multifocal fMRI (mffMRI) can detect and quantify lateral interactions of neural origin, and thus provide an easy, robust and efficient method to quantify surround modulation with fMRI. In mffMRI multiple fixed regions of the visual field are stimulated concurrently with independent stimulus sequences. The resulting compound response is decomposed using either cross‐correlation [Hansen et al., 2004] or multiple linear regression with the general linear model [Vanni et al., 2005]. This technique thus allows quantification of multiple local responses in short measurement time. Furthermore, as the local activity in the visual cortex is modulated by the stimulation of surrounding regions, we expect spatial interactions in the BOLD signal as well. In the case of visual stimulation, this corresponds to the extent of departure from spatial linearity of the BOLD signal. Specifically, does the BOLD signal in response to stimulation of adjacent visual field regions differ from the sum of signals when each is stimulated alone, and what are the physiological substrates of this difference?
In addition to studies of surround modulation, spatial linearity of BOLD response is relevant for retinotopic mapping of visual cortex. Retinotopic organization can be mapped with traveling‐wave (phase‐encoded) fMRI [DeYoe et al., 1996; Engel et al., 1994, 1997; Sereno et al., 1995; Warnking et al., 2002], and multifocal fMRI was introduced recently as an alternative method [Vanni et al., 2005]. Although mffMRI was efficient for mapping V1, activation of extrastriate cortical areas was less reliable. In a subsequent study, strong extrastriate responses emerged when only part of the visual field was stimulated at a time [Stenbacka and Vanni, 2007], which suggested suppression between adjacent regions in mffMRI. Here, we introduce a method combining mffMRI with parametric analysis [Buchel et al., 1998], providing a tool to quantify the surround modulation.Hansen et al. [2004] argued that spatial summation of BOLD response in human V1 is linear. They demonstrated that the responses of voxels in V1 to modulated wedges and rings were well predicted by linear summation of the responses to the individual components of the same stimuli. However, the responses to the components of the stimulus in their design were measured during multifocal stimulation, such that the amount of coactive surround stimulation was comparable in all conditions. In the present study, we directly compare V1 BOLD activation by stimulating a single component region in the visual field alone, and as a part of multifocal design, and find that the activation is significantly reduced in the presence of surround stimulation. We then apply a parametric model to quantify the contribution of individual surround regions to the suppression. Finally, we use checker board stimuli at different contrast levels and sinusoidal stimuli at different combinations of orientations and spatial frequencies between central and surrounding regions to show that the signal reduction has a predominantly neural origin.
MATERIALS AND METHODS
Subjects and Stimuli
Nine subjects (two females, aged 22–40) participated in Experiment 1, and eight subjects further participated in Experiments 2 and 3. All subjects had normal or corrected to normal vision and gave written informed consent to participate in the study. The study was approved by an ethical committee of the Hospital District of Helsinki and Uusimaa.
Stimulus images were created with Matlab™ (Mathworks), and their display during the functional runs was controlled with Presentation™ (Neurobehavioral Systems Inc.). A back projection system with data projector model Christie X3™ (Christie Digital Systems) was used to display the stimuli inside the scanner. Subjects fixated a point in the middle of the screen at 34‐cm viewing distance.
The stimulus in all experiments consisted of nine regions in the left hemifield (Fig. 1a,c). It extended radially from 1.7° to 6.7°, with borders at 3.1° and 4.5° eccentricity, and spanned 90° in polar angle, in 30° sectors, from 30° below to 60° above the horizon. The regions were scaled according to the human magnification factor [Duncan and Boynton, 2003], in order to stimulate comparable‐sized patches of primary visual cortex. Midpoints of the regions at different eccentricities were at 2.4°, 3.8°, and 5.6°.
Figure 1.

(a) Example of the 9‐region checkerboard stimulus used in Experiments 1 and 2. In Experiment 2, contrast of the checkerboard pattern was varied. (b) Sinusoidal stimuli used in Experiment 3. Multifocal conditions clockwise from top‐left: collinear surround with same spatial frequency, orthogonal surround with same spatial frequency, orthogonal surround with different spatial frequency, collinear surround with different spatial frequency. Note that both orientations and spatial frequencies were presented in all regions, and only the relative timing of their presentation varied between the conditions. For illustration purposes, spatial frequencies used in the figure are lower relative to the region size than the ones actually used in experiments. (c)Region numbering for the multifocal stimulus. We compared the activation elicited by the central region (number 5) in unifocal and multifocal conditions. (d) Design matrix for one run in Experiment 1. This run consists of three multifocal and two unifocal subsequences. Different types of subsequences were counterbalanced across runs.
Temporal sequences consisted of blocks lasting 7.3 s (4time points) each. During one block, each region was either active or inactive. One subsequence comprised 12 blocks and thus 4 × 12 = 48 time points. A subsequence could be either multifocal, with all nine regions modulated, or unifocal with only the central one of the nine regions modulated. Irrespective of the type of subsequence, the timing of the central region was always identical. In the multifocal condition each region was active 50% of time. Presentation of the two types of subsequences was balanced across runs.
The order of active/inactive blocks within a subsequence for each region was determined by shifted versions of 11‐step quadratic residue sequences, with a 12th step of only inactive regions appended, which made the temporal sequences of the regions exactly orthogonal [Vanni et al., 2005]. Two different shiftings were used within the subsequences of a run, giving an effective dimensionality of 22 for the estimation of effects. The number of stimulated regions in a multifocal design determines the length of the quadratic residue sequence required, thus the rationale behind using only a nine‐region subset of a larger 60‐region dartboard layout was to achieve a relatively short duration of each single subsequence, allowing balancing between different conditions.
In Experiment 1, the active state in each of the nine regions was a 4 × 4 checkerboard of 82% contrast (dark 4 Cd/m2, light 40 Cd/m2) with 8.3 contrast reversals per second. During the inactive state, the luminance was unmodulated at 22 Cd/m2. Each of the four experimental runs (240 time points, 7.4 min) contained five subsequences (Fig. 1a,d). This resulted altogether in 10 unifocal and 10 multifocal subsequences. Figure 1d summarizes the design for one run in Experiment 1.
In Experiment 2 we used checkerboard patterns of three contrasts (5, 40, and 80%). Multifocal and unifocal subsequences comparable to Experiment 1 were run at all contrasts. This resulted in six types of subsequences, which were balanced and pseudo‐randomized across runs and subjects. Each of the four experimental runs (288 time points, 8.7 min) contained six subsequences. This resulted in four multifocal and four unifocal subsequences at each contrast.
In Experiment 3, stimuli comprised sinusoidal gratings at 40% contrast. Stimulus regions were separated by a small gap, and the edges were smoothed with a Gaussian kernel. Gratings in different regions were always in phase, and their contrast reversed at 8.3 reversals per second. We used two spatial frequencies (1 and 2 cpd) at vertical and horizontal orientations, resulting in four different combinations of orientation and spatial frequency. During an active block (four time points), each of these combinations was presented for one time point in fixed order, resulting in four different states. In unifocal subsequences, only the central region was active. In multifocal subsequences, gratings in the surrounding regions were either collinear (Coll) or orthogonal (Orth), and had either same (SameSF) or different (DiffSF) spatial frequency relative to central region (Fig. 1b). This was achieved by keeping the stimulus sequence in the central region always the same, and changing the order of the four states in the surrounding regions. Note that in all conditions, each of the spatial frequency/orientation combinations was presented in every region, and only the relative order of presentation in center and surround was varied. All four experimental runs (240 time points, 7.4 min) contained five subsequences, which were balanced and pseudo‐randomized across runs and subjects. This resulted in four unifocal and four of the each type of multifocal (Coll‐SameSF, Ortht‐SameSF, Coll‐DiffSF, Orth‐DiffSF) subsequences.
MRI Data Acquisition and Analysis
Data were acquired with a 3T MR scanner (Signa EXCITE®, General Electrics Inc.) and eight‐channel receiver head coil for signal detection. A single shot gradient‐echo echo planar imaging sequence was used for functional data acquisition with parameters TR 1819 ms, TE 30 ms, acquisition matrix 64 × 64, FOV 160 mm × 160 mm and flip angle 60°. Altogether 24 slices with 2.5‐mm thickness were acquired without gap in interleaved order. Slices were oriented approximately perpendicular to the parieto‐occipital sulcus to cover the parietal and occipital visual areas. For each run, the first four volumes were discarded to allow the magnetization to reach a stable state. In Experiments 1 and 3, 4 × 240 and in Experiment 2, 4 × 288 volumes were included in the analysis. At the end of each experiment T1‐weighted anatomical images were acquired with a spoiled gradient‐echo sequence, acquisition matrix 128 × 128, FOV 230 mm and slice thickness 1.5 mm.
After reconstruction, functional data were analyzed with the SPM2 toolbox (The Wellcome Department of Imaging Neuroscience, London, England http://www.fil.ion.ucl.ac.uk/, see Frackowiak et al. [2003] for extensive review). The timing was corrected for interleaved slice acquisition, followed by a standard motion correction. Data was not smoothed in order to preserve exact spatial information. The general linear model was fitted to data with one regressor for each active region, after removing low‐frequency drift components. Regressors were constructed by convolving the stimulus function of active blocks with the standard SPM2 hemodynamic response function (HRF). A constant offset regressor was included for each of the four runs to account for the mean signal level. Autocorrelation in the noise was taken into account by modeling it as a first‐order autoregressive process, with hyperparameters estimated by the SPM2 restricted maximum likelihood (ReML) method, and the model was fitted by calculating the optimally weighted least squares coefficients for each regressor.
In Experiment 1, regressors were fitted corresponding to each of the nine active stimulus regions of the multifocal stimulus, with one regressor for the unifocal condition (Fig. 1d). In Experiment 2, nine regressors for the multifocal and one for the unifocal condition were estimated for each of the three contrasts (5, 40, and 80%), resulting in altogether 30 regressors. In Experiment 3, nine regressors were fitted for each of the four multifocal conditions and one for the unifocal condition, resulting in 37 regressors. Finally, we reanalyzed Experiment 1 with a parametric design [Buchel et al., 1998], where the second‐order effect of surround regions coactive with the central region was fitted by a second degree polynomial in the number of coactive neighboring regions of either border‐sharing or corner‐sharing types. See quantification of responses below for details of this analysis.
Regions‐of‐interest (ROI) from the cortex corresponding to the different stimulus regions were selected for further analysis based on the t‐statistics of each voxel. SPM(t) maps indicating the significance of activation were calculated for each stimulus region. Active clusters with the highest t‐value were consistently in V1, which is in line with earlier data [Vanni et al., 2005]. Clusters were grown around the voxel with the highest t‐value by including neighboring suprathreshold voxels, and their size was limited from three (threshold for the number of voxels in a cluster) to 10 voxels. The cluster for the central region was chosen from voxels that were significantly active in both multifocal and unifocal conditions. In Experiment 1, the location of activation was also analyzed on the cortical surface for four subjects by projecting SPM(t) maps to the unfolded cortical surface model of occipital lobes (Fig. 2) using the Brain à la Carte (BALC) toolbox [Warnking et al., 2002]. Selected ROIs were then checked against the borders of the visual areas derived from phase‐encoded retinotopic analysis [DeYoe et al., 1996; Sereno et al., 1995; Warnking et al., 2002], confirming that the chosen clusters were in V1. The cortical representations for the upper regions (1, 4, and 7 in Fig. 1c) are very close to the V1/V2 border derived from phase‐encoded analysis. This is evident especially for the Subject 5 in Figure 2, even though our stimulus does not reach the vertical meridian in the visual field. This seems to be due to the anisotropy of the visual field representation, where the horizontal meridian occupies relatively larger area of cortical surface than the representation near the vertical, especially upper vertical, meridian. This might be difficult to quantify from a phase‐encoded analysis, but is readily seen from the 60‐region multifocal data, where the representations for regions corresponding our 1, 4, and 7, and the regions next to the vertical meridian tend to almost overlap in a subset of subjects [see Vanni et al., 2005 for more details].
Figure 2.

ROIs for subjects 1 and 5 in Experiment 1 assigned to the unfolded surface model of right occipital lobe. Borders of visual areas are derived from phase encoded retinotopic analysis.
Quantification of Responses
The SPM software estimates a vector of regression coefficients, β, of the model for each voxel separately. These β‐estimates are saved as 3D volumes, which correspond to data volumes, one volume for each regressor in the design. We quantified the responses as percent signal change in the BOLD response. The mean signal level across the whole volume is normalized to 100 during the estimation, but the mean signal level in any single voxel is likely to deviate from the global mean. Thus the percent signal change is given by dividing the parameter value (of effect of interest) from each voxel by the parameter value of its constant term, and multiplying by 100. Finally, we averaged these percentages across the voxels that corresponded to the ROIs defined above. This measure was used in all three experiments, except the parametric analysis of Experiment 1, described below in more detail. We also calculated suppression indices for different multifocal conditions in Experiments 2 and 3, defined as 1 − (R Mf/R Uf), where R Mf and R Uf denote BOLD response in multifocal and unifocal conditions, respectively. Each index was first calculated separately for each subject, and then averaged across all subjects.
As far as the assumptions of linear model hold, orthogonality of the stimulus sequences in the different regions guarantees that the activation induced by the central stimulus region is fitted by the corresponding regressor. However, it is possible that there is nonlinear relationship either between neural activation and regional cerebral blood flow (rCBF), between rCBF and BOLD signal, or both [see Buxton et al., 2004]. In the case of a strong compressive nonlinearity saturating the BOLD signal faster than the neural activation, our model would underestimate the amount of neural activity. Thus the spreading activation from surrounding regions increasing the baseline level of BOLD activation could lead to flawed conclusions about the existence of actual suppression. We address this concern explicitly in Experiment 2 by using low contrast stimuli, which keep the net hemodynamic activation below the saturation level.
To characterize the interaction between central and surrounding stimulus regions in more detail, we recast the analysis in Experiment 1. Only one main‐effect regressor was used for the central region, which accounted for both unifocal and multifocal conditions. We then separated surrounding regions to two groups, depending on whether they shared a border or a corner with the central region. Two parametric regressors, x b for borders x c and for corners, were constructed, the parameter taking value 0 in the unifocal condition, and values 1–4 depending on how many border/corner sharing regions were coactive with the central region. Both parameter vectors were further expanded in orthogonalized polynomial basis functions up to second degree and convolved with the HRF [Buchel et al., 1998]. Thus, in the final design, the response of the central region after removing the constant term was modeled as
where R denotes the response, x is regressor for the central region, x b and x c are the expanded and orthogonalized parameter vectors (exponent stands for the expansion order) convolved with the HRF, and β is the estimate of the contribution of corresponding term in final response. Adjusting the β‐weights of the linear and quadratic basis functions for border and corner regressors, amounts to fitting a polynomial of second degree to the parameter values, and thus allows us to approximate arbitrary nonlinearities between parameter values and response in the linear model framework. Thus, we were able to quantify the modulation of central region response depending on the numbers of coactive border and corner regions. Estimated responses of the central region with different number of coactive border/corner regions were reconstructed according to the estimated β‐weights for the main effect, and the linear and quadratic terms of the parametric expansions. We again converted these response estimates to the units of percent signal change by normalizing with the constant coefficient within each voxel, multiplying by 100 and averaging these percentages over all voxels in a given ROI.
We tested the significance of the linear and quadratic coefficients for the second order effects from borders/corners at the cluster level. This was done by constructing a pooled T‐statistic for the cluster according to
where β is a vector of coefficients for the tested effect (e.g. linear interaction from borders) of all voxels in the central cluster, w is a vector with equal entries summing up to 1, C is the error covariance matrix between voxels after model estimation, X is the design matrix, W is the estimated whitening matrix to account for the temporal correlations in the data, and c is a contrast vector having one at location of effect of interest and zeros elsewhere.
For a given design, SPM automatically estimates the number of effective degrees of freedom (EDF) after the removal of low frequency components and correction of temporal non‐sphericity. Our pooled estimator is approximately T‐distributed with EDF—one degree of freedom, and was used to address the significance of interactions for each subject separately.
RESULTS
In Experiment 1 we compared the BOLD response elicited by the central region of the stimulus alone, with the response elicited by the same region as a part of multifocal sequence, to find out if the surrounding regions affect the central response. Figure 3 shows a direct comparison of percent signal change in the central region between unifocal and multifocal conditions. In both conditions, BOLD activation was measured from the ROI corresponding to the central region of the stimulus. The central response was clearly reduced in the multifocal, compared to the unifocal condition (Wilcoxon Signed Rank‐test, one‐tailed P = 0.008), and the effect was consistent over all nine subjects.
Figure 3.
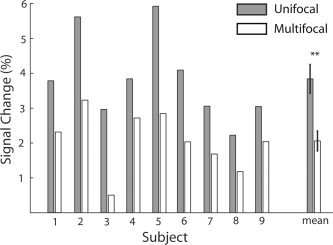
Percent signal change in BOLD response for the central region (Region 5) of the stimulus measured from V1 in Experiment 1. Gray bars correspond to the unifocal condition, with only the central region of the stimulus modulated. White bars correspond to the multifocal condition, with all the nine regions modulated independently. Data from all nine subjects is shown. The mean shows the same data pooled across subjects, error bars correspond to the standard error of the mean (SEM). Asterisks indicate statistically significant (P < 0.01) differences in BOLD signal change.
We further quantified the influence of the number and spatial configuration of surrounding regions on the strength of suppression with the parametric model. Contribution from different parts of surround may add linearly or nonlinearly, and can be described by using parametric regressors within the linear model framework. We first tested the significance of linear and quadratic components of the expansion of interaction regressors in the central cluster. For border sharing regions, the linear term was negative and significant (P < 0.05, Bonferroni corrected for the multiple comparisons over nine subjects and four conditions) for all nine subjects, which shows that the strength of suppression increases with the number of coactive border regions. The quadratic coefficient for borders effect was significantly positive for four out of nine subjects (subjects 2, 5, 6, and 8 in Fig. 4). For these subjects the suppression does not increase linearly, but rather saturates with two coactive border regions. Figure 4 illustrates the estimated BOLD response in the central cluster as a function of increasing number of coactive border regions for all nine subjects. We found that neither the linear, nor the quadratic coefficient for the effect of corners was significant in any subjects. This shows that the interaction is considerably stronger with bordering regions.
Figure 4.

Parametrically estimated responses of the central region from Experiment 1. BOLD signal change is plotted as a function of the number of coactive border regions. UF corresponds to the response in unifocal condition with no surround stimulation, and the 1, 2, and 3 correspond to the number of coactive border regions in multifocal condition. Responses are reconstructed from coefficient estimates of the parametric model (see Quantification of responses in the Methods section), and averaged over the voxels in the central region. Dashed lines denote the standard deviation of estimates within a cluster. Suppression is evident in all subjects as expected from the significant negative linear coefficient of border interactions. The positive quadratic coefficient was significant for subjects 2, 5, 6, and 8, and can be seen here as the saturation of the suppression strength after two coactive border regions.
In order to relate the hemodynamic signal to the underlying neural activity, we first looked at the extent to which the BOLD activation spreads during the stimulation of a single visual region. Figure 5 illustrates the magnitude and spreading of BOLD activation in the central region in unifocal and multifocal conditions of Experiment 1. The normalized BOLD‐response is shown for the same two subjects as in Figure 2. It is clear that both the magnitude of the response and the extent of spreading are larger when the central region alone is stimulated. However, the overall shape appears to be similar, suggesting homogenous suppression of the response in the multifocal condition.
Figure 5.

Normalized BOLD response to the stimulation of central region in unifocal and multifocal conditions of Experiment 1. Responses for subjects 1 and 5 are projected on the unfolded surface model and smoothed with Gaussian kernel (σ = 1.5 mm). Magnitude and extent of the response is evidently larger in unifocal condition. We also calculated the number of above‐threshold voxels forming the corresponding cluster in 3D space. For Subject 1, the cluster consisted of 217 voxels in unifocal condition and 53 voxels in multifocal condition. For Subject 5 the corresponding numbers were 146 voxels in unifocal, and 14 voxels in multifocal condition.
For unifocal condition in Experiment 1, we also calculated the average spreading of the response to the surrounding regions. We took the ROIs for these nine regions from the multifocal condition, which thus acted as a prior functional localizer for measuring the signal change. Responses in the surrounding ROIs were averaged over subjects, and were consistently smaller compared to the ROI for the stimulated central region, but still significantly present (Wilcoxon Signed Rank‐test, one‐tailed P < 0.05, Bonferroni corrected for multiple comparisons) on regions 2, 6, and 8, all sharing a border with the central region (Fig. 6). Relatively stronger spreading of response to these regions relative to corners might result from the amount of shared cortical border, as well as from the shorter mean distance between the regions in V1. This is in accordance with the fact that the suppression from the border regions was significantly stronger compared to the corner regions. Cortical distances between the center points of stimulated regions in Figure 6 are estimated according to human magnification factor with parameter values taken from the study by Duncan and Boynton [2003]. We did not estimate the magnification factor for each subject separately, so care must be taken while interpreting these results quantitatively, as there is substantial variability between subjects. However, as the estimated cortical distance between center points grows to 9 mm, the spreading of functional signal is minimal. This is also evident from the surface analysis of two subjects illustrated in Figure 5, and corresponds roughly to the long‐range horizontal connections on macaques projecting up to 5‐mm radius from a neuron in the center [Angelucci et al., 2002b], and recent fMRI results measuring the functional spread of electrical microstimulation up to 5.8‐mm radius [Tolias et al., 2005].
Figure 6.

Average spreading of activation to eight surrounding regions while only the central region was stimulated in Experiment 1. ROIs for surrounding regions are taken from the multifocal condition. Data is pooled across all participants with error bars corresponding to SEM. Numbers inside the squares correspond to regions, and the location in abscissa denotes the estimated cortical distance (mm) between the midpoints of cluster for Region 5 and the corresponding clusters for the surrounding regions, see text for details. Asterisks indicate statistically significant differences in BOLD signal change (P < 0.05, Bonferroni corrected for multiple comparisons). The spreading of activation is strongest for the regions sharing a border with the central region.
Experiment 2 tested the contribution of hemodynamic effects on the suppression. These could be either hemodynamic stealing by depleting the supply of blood to the central region [Harel et al., 2002], or conversely, spreading of activation (Figs. 6 and 7) from the surround to the central region could drive the rCBF to close to saturation in the multifocal condition [Nielsen and Lauritzen, 2001]. Thus, stimulation of the central region could have had a reduced impact to the BOLD signal, thus producing apparent suppression (see Methods). Increased baseline rCBF is also known to reduce stimulus‐induced BOLD activation [Stefanovic et al., 2006; Vazquez et al., 2006]. We probed the possible contribution of these nonlinearities by varying the stimulus contrast. It is well known that both neural [Albrecht and Hamilton, 1982] and hemodynamic [Goodyear and Menon, 1998; Logothetis et al., 2001] activity increase monotonically with the stimulus contrast. In reducing the contrast we assume that the magnitude of possible hemodynamic stealing is diminished, and the level of BOLD signal is kept below the saturation regime.
Figure 7.

Spreading of activation to surrounding regions in Experiment 2 during the unifocal condition. ROIs for surrounding regions were taken from the multifocal condition. Responses in four bordering and four cornering regions were pooled together for the ease of comparison. There is a significant difference in spreading (P < 0.05) at different stimulus contrasts to bordering regions. Data is pooled over all eight subjects, and error bars denote SEM.
As in Experiment 1, we first measured the spreading of activation to the surrounding regions during the unifocal condition at all three stimulus contrasts to confirm that the spreading of activation was reduced at lower contrasts (Fig. 7). For ease of visualization, we have averaged the responses over the regions sharing a border with the central one, and regions sharing a corner. The distribution of responses among the regions was comparable to that of Experiment 1 (Fig. 6) at all stimulus contrasts. We tested the difference in the spreading of response at different stimulus contrasts with the Friedman test, which is a non‐parametric alternative to repeated measures ANOVA. There was a significant difference (P = 0.04) in the absolute level response between different stimulus contrasts in regions sharing a border with the central one, confirming that the spreading of activation is weaker at lower contrasts. Even though we measure the spreading of activation from central to peripheral regions, we assume here symmetrical spreading from surround to central regions. If we take that each bordering cortical region activates the centre to the same degree as they are activated by the central region, the increase in the baseline rCBF at lower contrast multifocal conditions should be smaller. Note that we are measuring here the absolute level of response in surrounding regions instead of fractional response relative to central response, which is similar at all three contrasts. That is precisely because we are interested in the level of baseline activity induced by surrounding stimulation that might induce the saturation effects in the central region during the multifocal condition. We cannot totally exclude the possibility that the detectability of the central region induced BOLD activation would depend solely on the relative level of baseline activity (i.e., the fractional spreading of activation at different contrasts), but address this concern further in Experiment 3 by altering the stimulus characteristics known to modulate the strength of the neural suppression.
Figure 8 shows the percent signal change between multifocal and unifocal conditions and the corresponding suppression indices at three different contrast levels. Reduction of the BOLD response in the multifocal condition persists across the contrasts (Wilcoxon Signed Rank‐test, one‐tailed P < 0.05 Bonferroni corrected, for all stimulus contrasts), and there is a trend for stronger suppression at lower contrasts. This would not be expected if the suppression was due to hemodynamic stealing, as there should be increased demand and thus stronger effect from stealing in the high contrast condition. A representative time series from single run of the Experiment 2 is plotted in Figure 9. This illustrates the fact that the baseline level of activation is elevated in the multifocal condition due to the stimulation of the surround, while the modulation induced by central region stimulation is smaller relative to the unifocal condition. The elevation of the baseline activation and the absolute level of the BOLD‐signal are clearly lower at the lower stimulus contrasts, thus excluding the possibility that the reduction of the central region induced activation would be due to the saturation of the BOLD‐signal level. Taken together this indicates neural rather than hemodynamic origin for the suppression.
Figure 8.

Comparison of the strengths of suppression at different stimulus contrasts. Bars on the left indicate percent signal change in BOLD response for the central region of the stimulus at three different contrast levels in Experiment 2. Gray bars correspond to the unifocal, and white bars to the multifocal condition. Bars on the right are suppression indices for corresponding stimulus contrasts. Data is pooled over all eight subjects, and error bars denote SEM. Asterisks indicate statistically significant differences in BOLD signal change (P < 0.05).
Figure 9.

A representative time series from S5 in one run of Experiment 2. Data has been averaged over the voxels in the central cluster, and centered after removing the linear drift. One run includes unifocal (UF) and multifocal (MF) conditions at all three contrast levels (5, 40, and 80%). Arrows at the bottom denote the onsets of the central stimulus region, after which the region was active for the subsequent four time points.
In Experiment 3 we used sinusoidal gratings instead of checkerboards to further examine the neural contribution to the interaction effects. We expect that changing either relative orientation, spatial frequency or both, between the central and surrounding regions would reduce suppressive effects if they were of neural origin. Figure 10 shows the BOLD signal change in the unifocal condition, and the four multifocal conditions with different combinations of relative orientation and spatial frequencies (Coll‐SameSF, Ortht‐SameSF, Coll‐DiffSF, Orth‐DiffSF). As expected, reduction in BOLD response is strongest when both parameters are matched between central and surrounding regions. Changing the relative orientation or spatial frequency of the surround reduces the suppression, but there is practically no difference between one and two parameter‐change configurations. Thus we tested the mean response for these conditions against Coll‐SameSF, and found it significant (Wilcoxon Signed Rank‐test, one tailed P = 0.013), again indicating neural origin of suppression. Note that part of the suppression remains in all multifocal conditions, suggesting a non‐specific component of suppression.
Figure 10.

Comparison of the strength of suppression with different surround characteristics. Bars on the left indicate percent signal change in BOLD response for the central region of stimulus in the unifocal (gray) and the four different multifocal (white) conditions of Experiment 3. Bars on the right are corresponding suppression indices for different multifocal surround configurations relative to the unifocal condition. Data is pooled over all eight subjects, and error bars denote SEM. Asterisk indicates statistically significant difference in BOLD signal change (P < 0.05) when Coll‐SameSF is tested against the mean of other three multifocal conditions. Suppression is strongest when both orientation and spatial frequency of center and surround are matched.
DISCUSSION
The BOLD response to visual stimulus is reduced significantly if it is presented as a part of multifocal sequence compared to the condition where it is presented with similar time course, but without surrounding stimulation. This indicates nonlinear spatial interactions during mffMRI in V1. The effect is consistent through varying contrasts, and it is weaker when the stimulus characteristics of the center and surround differ in orientation and/or spatial frequency, indicating neural suppression rather than hemodynamic origin. However, the reduction in response cannot be fully eliminated with parametric variations of the surround. Quantification of the suppression indicates that there exists some individual variation in the linearity of the suppression mechanism itself (Fig. 4). In addition, we found that local cortical activation spreads to neighboring cortex, corresponding approximately to the length of long‐range horizontal projections in macaque V1 [Angelucci et al., 2002b].
Mechanism of Reduced BOLD Response
In earlier studies, reduction in underlying neural activity has been considered as a likely reason for negative BOLD responses [Shmuel et al., 2002, 2006; Smith et al., 2004; Stefanovic et al., 2004], and we believe that the suppression of neural activity is the most viable explanation of the present results as well. An alternative explanation for reduced response in the multifocal condition could be nonlinearities in the cortical vascular response. Stimulation of surrounding regions might induce hemodynamic stealing [Harel et al., 2002] reducing the amount of oxygenated blood available for the cortical region corresponding to the central part of the stimulus. This could result in reduced BOLD signal for the central region in the multifocal condition. Alternatively, surrounding regions in the high‐contrast multifocal condition might induce considerable baseline activity, and increase the CBF closer to saturation in the central cortical region, thus reducing the dynamic range of possible modulation from stimulation of the central region leading to flawed estimates of neural suppression. This kind of spreading of positive BOLD activity to nearby regions of cortex is evident in Figures 5 and 6. However, if the reduction in BOLD response were due to hemodynamic saturation, we would expect the difference between multifocal and unifocal conditions to vanish or at least decrease at low contrasts when neural and hemodynamic responses to surrounding stimuli are decreased (Fig. 9). Our results demonstrate that this is not the case, as the reduction in BOLD response persists also at low contrast (Figs. 8 and 9). Contrary to this, there is actually a trend towards stronger reduction of BOLD response at lower contrasts, indicating the presence of an active suppression mechanism. A Similar trend towards strengthening of the suppression at lower contrasts is also evident in psychophysics [Xing and Heeger, 2001, their Fig. 3].
The surround suppression is usually strongest when the stimulus attributes of the center and surround are matched [e.g. Cavanaugh et al., 2002b; DeAngelis et al., 1994; Petrov et al., 2005; Xing and Heeger, 2001]. Thus the reduced suppression with the different relative orientation and spatial frequency (Fig. 10) indicates neural origin of suppression. Figure 10 shows that part of the suppression remains at all multifocal conditions, irrespective of the stimulus characteristics of the center and surround. While this remaining suppression could be due to hemodynamic effects, we believe it emerges from broadly tuned neural interactions. Physiologically measured suppression can be broadly tuned to spatial frequency [DeAngelis et al., 1994], and making the surround orientation orthogonal does not necessarily abolish all of the suppression in electrophysiological [Cavanaugh et al., 2002b] or psychophysical [Xing and Heeger, 2001] experiments. Surround suppression from outside the neuron's classical receptive field has been demonstrated in LGN [Solomon et al., 2002], and even at the retinal ganglion cells [Solomon et al., 2006], and the broadly tuned component of suppression observed in cortical cells might be inherited from these mechanisms earlier in the visual pathway [but see Angelucci and Bressloff, 2006]. Alternatively, we can speculate that a cortical mechanism, different from the orientation‐tuned interaction, could induce the suppression. Further experiments, e.g. comparison of monocular vs. binocular interactions are necessary for separation of the two possibilities. Neural interpretation is also evident in Zenger‐Landolt and Heeger [2003], who measured surround suppression with sinusoidal gratings. They used two 750‐ms intervals separated by 375‐ms gap, and the center and surround were either both presented in the first (simultaneous) or in different intervals (lagging). Both psychophysical masking and suppression of the central BOLD response were abolished in the lagging condition. This time‐scale would be too fast for purely hemodynamic effects such as stealing to disappear.
Relating the current results to earlier physiological [Angelucci et al., 2002b; Cavanaugh et al., 2002a; DeAngelis et al., 1994; Jones et al., 2001; Knierim and van Essen, 1992; Levitt and Lund, 1997; Maffei and Fiorentini, 1976] and psychophysical [Chubb et al., 1989; Ejima and Takahashi, 1985; Petrov et al., 2005; Xing and Heeger, 2001] literature on surround suppression, two aspects of our stimuli are worth noting. First, in the current study we used equal contrast on the center and surround regions, which is often the case in the electrophysiological recordings reporting surround suppression [e.g. Angelucci et al., 2002b; Cavanaugh et al., 2002a; DeAngelis et al., 1994]. In addition, several psychophysical studies have used matched center and surround contrasts [Cannon and Fullenkamp, 1991; Meese and Hess, 2004; Xing and Heeger, 2001], at the range of contrasts comparable to our Experiment 2 [Xing and Heeger, 2001]. Second, in our stimulus, one mini‐block during which the region could be active or inactive, lasted 7.3 s. In physiological experiments the stimulation typically lasts at least several seconds, during which the firing rate of neuron is suppressed [e.g. Cavanaugh et al., 2002a; Shmuel et al., 2006]. In contrast, psychophysical experiments typically use transient stimuli, so we cannot make a direct comparison between earlier studies and our results in this respect. However, psychophysical suppression has been related to the reduced BOLD response in a study using more rapid stimulation paradigm [Zenger‐Landolt and Heeger, 2003], allowing us to conclude that the present results are in line with the earlier electrophysiological and psychophysical reports on surround suppression.
Precise physiological substrates of surround suppression are still debated, and might include lateral inhibitory connections within V1 [DeAngelis et al., 1994; Knierim and van Essen, 1992], or feedback from higher cortical areas [Angelucci et al., 2002b; Cavanaugh et al., 2002a; Knierim and van Essen, 1992]. Also the suppressive fields in LGN could decrease the excitatory input to V1 [Ozeki et al., 2004; Solomon et al., 2002] and reduce the recurrent excitatory activation in cortical networks [Ozeki et al., 2004; Wielaard and Sajda, 2005]. With the increasing understanding of these network mechanisms in future, we will be able to apply more accurate models and thus better probe the network mechanisms of individual subjects. Similar results showing surround modulation in V1 BOLD response have been reported earlier [Harrison et al., 2007; Williams et al., 2003; Zenger‐Landolt and Heeger, 2003], although with stimuli of larger size. Our work adds a quantitative method with finer spatial scale, and further evidence in favor of neural rather than hemodynamic origin of the surround suppression in BOLD response. In contrast, our results are inconsistent with results of Hansen et al. [2004], who reported spatial linearity of summation in V1 with a comparable technique. However their conclusion was based on comparisons between either whole wedges/rings or smaller regions (parts of whole wedges/rings) governed by shifted versions of a binary M‐sequence. In their stimulus a single region was never presented alone, but in general had four bordering neighbors coactive 50% of the time. This would be a comparable amount of surround suppression to having the two bordering neighbors in a wedge or ring coactive 100% of the time. That study thus indicates equivalence of these two forms of surround coactivation, but does not provide direct evidence for the spatial additivity of the BOLD response.
Spread of BOLD‐Signal Is Determined by Neural Activity
In retinotopic mapping, it is important to consider the extent of the cortical point spread of given stimulus, which depends on the method used to measure the activation. With optical imaging of intrinsic signals Das and Gilbert [1995] demonstrated that the diameter of point spread was on average 3.8 mm for 1 mm × 1 mm area of spiking cortex in cat, being independent of the cortical location, and thus receptive field size. This vascular response is likely to result from increased metabolic demands due to extensive spreading of subthreshold synaptic activity via horizontal connections [Das and Gilbert, 1995; Grinvald et al., 1994]. Correspondingly, results from optical imaging with voltage sensitive dyes in monkeys show that the region of sub threshold activation on the cortex is considerably larger than the region of spiking activity [Grinvald et al., 1994]. Grinvald et al. modeled the spreading of neural activation with exponentially decaying function and found that the space constant was up to 3 mm. More recently, the spreading of BOLD activation resulting from directly injected current to monkey V1 was found to be from 2 to 5.8 mm depending on the current amplitude [Tolias et al., 2005], and their chronaxie measurements indicated that the excitability of the stimulated elements yielding the BOLD signal was well matched with the excitability of pyramidal neurons. Our results are in agreement with these studies, as seen from Figures 5 and 6. The spreading of activation to neighboring regions is evident, and diminishes close to baseline, as the estimated distance between the midpoints of cortical presentation increases.
Should the spatial summation of BOLD response be linear, we would expect equal response strength and spreading in the unifocal and multifocal conditions. Yet, as we demonstrated, adding the surround suppresses the central response. These results correspond with Grinvald et al. [1994], who demonstrated symmetry in the spread and suppression between a centre and a surround. The spreading of their excitatory surround signal to the central region was evident when only the surround was stimulated, but the activation measured for center and surround stimulus together was clearly reduced compared to central stimulus alone [Grinvald et al., 1994]. This suggests that the spreading is coupled with suppressive neural interactions, which can be observed only when the central region is stimulated above some threshold.
Angelucci et al. [2002a] and Schwabe et al. [2006] have proposed a mechanism in which the suppression is mediated by inhibitory interneurons. The local network receives thalamic feedforward, lateral and extrastriate feedback input, and the inhibitory interneurons have high activation thresholds relative to the local excitatory pyramidal cells. In their model, the excitatory connections are able to drive a neuron's response while the input to inhibitory interneurons is low, but are masked by inhibition when the strong input drives the inhibitory interneuron over its activation threshold. In this model the surround suppression is explained by the overall network activity, including feedback from extrastriate neurons with large receptive fields, driving the inhibitory interneurons. This type of mechanism operating at the population level could explain our current results of spreading activation (Figs. 5 and 6) turning into suppression (Figs. 3, 4, 5).
BOLD Signal Enables a Unique Viewpoint on Neural Activation
Functional MRI cannot match the spatial or temporal resolution of single unit electrophysiology, but might offer a somewhat unique perspective on the functioning of neural systems. Responses in single unit recordings are typically characterized as firing rates, while the BOLD signal is linked particularly to local field potentials (LFPs) arising from dendritic input and local processing rather than spiking output [Lauritzen, 2001; Logothetis et al., 2001]. However, recently Mukamel et al. [2005] demonstrated that multi‐unit recordings from human auditory cortex predicted the BOLD response as well as LFPs, and in particular negative BOLD effects seem to be coupled with reductions in both LFPs and spiking activity [Shmuel et al., 2006]. Thus most of the time, the net synaptic activity in a given cortical region is likely to be proportional to the spiking output, and justifies the comparison between the present results and earlier electrophysiological studies on surround modulation. Furthermore, the stimulus visibility can be more strongly correlated with the low frequency LFP components than with the multiunit spiking activity in early visual cortical areas [Wilke et al., 2006], suggesting that accurate quantification of the BOLD response is valuable tool for the study of early visual processing.
CONCLUSIONS
This study demonstrates nonlinear spatial interactions in the V1 BOLD signal measured with multifocal fMRI. The origin of these nonlinearities is most likely neural suppression rather than hemodynamic stealing or saturation of CBF. In future studies, these interactions must be considered and fully characterized, if the method is to be used for quantifying the response in multiple cortical loci instead of just mapping the representations. For example, Thirion et al. [2006] recently used an explicit model of V1 receptive fields to infer the stimulus shape from BOLD activity in primary visual cortex. However, their model assumed linearity, and could greatly benefit from explicitly accounting for the nonlinearities described in this work. Moreover, the ubiquity of modulatory surround interactions in the visual system suggests that they have an important role in cortical information processing [Rao and Ballard, 1999; Vinje and Gallant, 2002]. By using different stimulus patterns in central and surrounding regions and the strength of interaction as a response variable, it might be possible to characterize the relevant dimensions in the stimulus space for each functional area in the visual system. Furthermore, the parametric modeling used here opens a variety of possibilities to test the behavior of the suppression mechanism under different stimulus configurations. This line of thinking will turn the reported nonlinearity into a valuable tool instead of a nuisance to be avoided in mapping experiments.
Acknowledgements
We thank Marita Kattelus for help in the measurements and Antti Tarkiainen for technical support. Linda Stenbacka segmented the anatomical MR images and did the phase‐encoded analysis of retinotopic areas. Lauri Nurminen gave insightful comments on the manuscript and more than once pointed us to the relevant literature. We are most grateful for unite mixte INSERM/Université Joseph Fourier 549, who provided the Brain á la Carte toolbox for surface oriented analysis.
REFERENCES
- Albrecht DG,Hamilton DB ( 1982): Striate cortex of monkey and cat: Contrast response function. J Neurophysiol 48: 217–237. [DOI] [PubMed] [Google Scholar]
- Angelucci A,Bressloff PC ( 2006): Contribution of feedforward, lateral and feedback connections to the classical receptive field center and extra‐classical receptive field surround of primate V1 neurons. Prog Brain Res 154: 93–120. [DOI] [PubMed] [Google Scholar]
- Angelucci A,Levitt JB,Lund JS ( 2002a): Anatomical origins of the classical receptive field and modulatory surround field of single neurons in macaque visual cortical area V1. Prog Brain Res 136: 373–388. [DOI] [PubMed] [Google Scholar]
- Angelucci A,Levitt JB,Walton EJ,Hupe JM,Bullier J,Lund JS ( 2002b): Circuits for local and global signal integration in primary visual cortex. J Neurosci 22: 8633–8646. [DOI] [PMC free article] [PubMed] [Google Scholar]
- Blakemore C,Tobin EA ( 1972): Lateral inhibition between orientation detectors in the cat's visual cortex. Exp Brain Res 15: 439–440. [DOI] [PubMed] [Google Scholar]
- Buchel C,Holmes AP,Rees G,Friston KJ ( 1998): Characterizing stimulus‐response functions using nonlinear regressors in parametric fMRI experiments. Neuroimage 8: 140–148. [DOI] [PubMed] [Google Scholar]
- Buxton RB,Uludag K,Dubowitz DJ,Liu TT ( 2004): Modeling the hemodynamic response to brain activation. Neuroimage 23 ( Suppl 1): S220–S233. [DOI] [PubMed] [Google Scholar]
- Cannon MW,Fullenkamp SC ( 1991): Spatial interactions in apparent contrast: Inhibitory effects among grating patterns of different spatial frequencies, spatial positions and orientations. Vis Res 31: 1985–1998. [DOI] [PubMed] [Google Scholar]
- Cavanaugh JR,Bair W,Movshon JA ( 2002a): Nature and interaction of signals from the receptive field center and surround in macaque V1 neurons. J Neurophysiol 88: 2530–2546. [DOI] [PubMed] [Google Scholar]
- Cavanaugh JR,Bair W,Movshon JA ( 2002b): Selectivity and spatial distribution of signals from the receptive field surround in macaque V1 neurons. J Neurophysiol 88: 2547–2556. [DOI] [PubMed] [Google Scholar]
- Chen CC,Tyler CW ( 2001): Lateral sensitivity modulation explains the flanker effect in contrast discrimination. Proc Biol Sci 268: 509–516. [DOI] [PMC free article] [PubMed] [Google Scholar]
- Chubb C,Sperling G,Solomon JA ( 1989): Texture interactions determine perceived contrast. Proc Natl Acad Sci USA 86: 9631–9635. [DOI] [PMC free article] [PubMed] [Google Scholar]
- Das A,Gilbert CD ( 1995): Long‐range horizontal connections and their role in cortical reorganization revealed by optical recording of cat primary visual cortex. Nature 375: 780–784. [DOI] [PubMed] [Google Scholar]
- DeAngelis GC,Freeman RD,Ohzawa I ( 1994): Length and width tuning of neurons in the cat's primary visual cortex. J Neurophysiol 71: 347–374. [DOI] [PubMed] [Google Scholar]
- DeYoe EA,Carman GJ,Bandettini P,Glickman S,Wieser J,Cox R,Miller D,Neitz J ( 1996): Mapping striate and extrastriate visual areas in human cerebral cortex. Proc Natl Acad Sci USA 93: 2382–2386. [DOI] [PMC free article] [PubMed] [Google Scholar]
- Duncan RO,Boynton GM ( 2003): Cortical magnification within human primary visual cortex correlates with acuity thresholds. Neuron 38: 659–671. [DOI] [PubMed] [Google Scholar]
- Ejima Y,Takahashi S ( 1985): Apparent contrast of a sinusoidal grating in the simultaneous presence of peripheral gratings. Vis Res 25: 1223–1232. [DOI] [PubMed] [Google Scholar]
- Engel SA,Glover GH,Wandell BA ( 1997): Retinotopic organization in human visual cortex and the spatial precision of functional MRI. Cereb Cortex 7: 181–192. [DOI] [PubMed] [Google Scholar]
- Engel SA,Rumelhart DE,Wandell BA,Lee AT,Glover GH,Chichilnisky EJ,Shadlen MN ( 1994): fMRI of human visual cortex. Nature 369: 525. [DOI] [PubMed] [Google Scholar]
- Felsen G,Touryan J,Han F,Dan Y ( 2005): Cortical sensitivity to visual features in natural scenes. PLoS Biol 3: e342. [DOI] [PMC free article] [PubMed] [Google Scholar]
- Frackowiak R,Friston K,Frith C,Dolan R,Price C,Zeki S,Ashburner J,Penny W ( 2003): Human Brain Function. New York: Academic Press. [Google Scholar]
- Goodyear BG,Menon RS ( 1998): Effect of luminance contrast on BOLD fMRI response in human primary visual areas. J Neurophysiol 79: 2204–2207. [DOI] [PubMed] [Google Scholar]
- Grinvald A,Lieke EE,Frostig RD,Hildesheim R ( 1994): Cortical point‐spread function and long‐range lateral interactions revealed by real‐time optical imaging of macaque monkey primary visual cortex. J Neurosci 14(5, Part 1): 2545–2568. [DOI] [PMC free article] [PubMed] [Google Scholar]
- Hansen KA,David SV,Gallant JL ( 2004): Parametric reverse correlation reveals spatial linearity of retinotopic human V1 BOLD response. Neuroimage 23: 233–241. [DOI] [PubMed] [Google Scholar]
- Harel N,Lee SP,Nagaoka T,Kim DS,Kim SG ( 2002): Origin of negative blood oxygenation level‐dependent fMRI signals. J Cereb Blood Flow Metab 22: 908–917. [DOI] [PubMed] [Google Scholar]
- Harrison LM,Stephan KE,Rees G,Friston KJ ( 2007): Extra‐classical receptive field effects measured in striate cortex with fMRI. Neuroimage 34: 1199–1208. [DOI] [PMC free article] [PubMed] [Google Scholar]
- Haynes JD,Roth G,Stadler M,Heinze HJ ( 2003): Neuromagnetic correlates of perceived contrast in primary visual cortex. J Neurophysiol 89: 2655–2666. [DOI] [PubMed] [Google Scholar]
- Jones HE,Grieve KL,Wang W,Sillito AM ( 2001): Surround suppression in primate V1. J Neurophysiol 86: 2011–2028. [DOI] [PubMed] [Google Scholar]
- Kastner S,De Weerd P,Pinsk MA,Elizondo MI,Desimone R,Ungerleider LG ( 2001): Modulation of sensory suppression: Implications for receptive field sizes in the human visual cortex. J Neurophysiol 86: 1398–1411. [DOI] [PubMed] [Google Scholar]
- Knierim JJ,van Essen DC ( 1992): Neuronal responses to static texture patterns in area V1 of the alert macaque monkey. J Neurophysiol 67: 961–980. [DOI] [PubMed] [Google Scholar]
- Lauritzen M ( 2001): Relationship of spikes, synaptic activity, and local changes of cerebral blood flow. J Cereb Blood Flow Metab 21: 1367–1383. [DOI] [PubMed] [Google Scholar]
- Levitt JB,Lund JS ( 1997): Contrast dependence of contextual effects in primate visual cortex. Nature 387: 73–76. [DOI] [PubMed] [Google Scholar]
- Logothetis NK,Pauls J,Augath M,Trinath T,Oeltermann A ( 2001): Neurophysiological investigation of the basis of the fMRI signal. Nature 412: 150–157. [DOI] [PubMed] [Google Scholar]
- Maffei L,Fiorentini A ( 1976): The unresponsive regions of visual cortical receptive fields. Vis Res 16: 1131–1139. [DOI] [PubMed] [Google Scholar]
- Meese TS,Hess RF ( 2004): Low spatial frequencies are suppressively masked across spatial scale, orientation, field position, and eye of origin. J Vis 4: 843–859. [DOI] [PubMed] [Google Scholar]
- Mizobe K,Polat U,Pettet MW,Kasamatsu T ( 2001): Facilitation and suppression of single striate‐cell activity by spatially discrete pattern stimuli presented beyond the receptive field. Vis Neurosci 18: 377–391. [DOI] [PubMed] [Google Scholar]
- Mukamel R,Gelbard H,Arieli A,Hasson U,Fried I,Malach R ( 2005): Coupling between neuronal firing, field potentials, and FMRI in human auditory cortex. Science 309: 951–954. [DOI] [PubMed] [Google Scholar]
- Nelson JI,Frost BJ ( 1978): Orientation‐selective inhibition from beyond the classic visual receptive field. Brain Res 139: 359–365. [DOI] [PubMed] [Google Scholar]
- Nielsen A,Lauritzen M ( 2001): Coupling and uncoupling of activity‐dependent increases of neuronal activity and blood flow in rat somatosensory cortex. J Physiol 533 (Part 3): 773–785. [DOI] [PMC free article] [PubMed] [Google Scholar]
- Ohtani Y,Okamura S,Yoshida Y,Toyama K,Ejima Y ( 2002): Surround suppression in the human visual cortex: An analysis using magnetoencephalography. Vision Res 42: 1825–1835. [DOI] [PubMed] [Google Scholar]
- Ozeki H,Sadakane O,Akasaki T,Naito T,Shimegi S,Sato H ( 2004): Relationship between excitation and inhibition underlying size tuning and contextual response modulation in the cat primary visual cortex. J Neurosci 24: 1428–1438. [DOI] [PMC free article] [PubMed] [Google Scholar]
- Petrov Y,Carandini M,McKee S ( 2005): Two distinct mechanisms of suppression in human vision. J Neurosci 25: 8704–8707. [DOI] [PMC free article] [PubMed] [Google Scholar]
- Polat U,Sagi D ( 1993): Lateral interactions between spatial channels: Suppression and facilitation revealed by lateral masking experiments. Vis Res 33: 993–999. [DOI] [PubMed] [Google Scholar]
- Rao RP,Ballard DH ( 1999): Predictive coding in the visual cortex: A functional interpretation of some extra‐classical receptive‐field effects. Nat Neurosci 2: 79–87. [DOI] [PubMed] [Google Scholar]
- Schwabe L,Obermayer K,Angelucci A,Bressloff PC ( 2006): The role of feedback in shaping the extra‐classical receptive field of cortical neurons: A recurrent network model. J Neurosci 26: 9117–9129. [DOI] [PMC free article] [PubMed] [Google Scholar]
- Sereno MI,Dale AM,Reppas JB,Kwong KK,Belliveau JW,Brady TJ,Rosen BR,Tootell RB ( 1995): Borders of multiple visual areas in humans revealed by functional magnetic resonance imaging. Science 268: 889–893. [DOI] [PubMed] [Google Scholar]
- Series P,Lorenceau J,Fregnac Y ( 2003): The “silent” surround of V1 receptive fields: Theory and experiments. J Physiol Paris 97(4–6): 453–474. [DOI] [PubMed] [Google Scholar]
- Shmuel A,Augath M,Oeltermann A,Logothetis NK ( 2006): Negative functional MRI response correlates with decreases in neuronal activity in monkey visual area V1. Nat Neurosci 9: 569–577. [DOI] [PubMed] [Google Scholar]
- Shmuel A,Yacoub E,Pfeuffer J,Van de Moortele PF,Adriany G,Hu X,Ugurbil K ( 2002): Sustained negative BOLD, blood flow and oxygen consumption response and its coupling to the positive response in the human brain. Neuron 36: 1195–1210. [DOI] [PubMed] [Google Scholar]
- Smith AT,Williams AL,Singh KD ( 2004): Negative BOLD in the visual cortex: Evidence against blood stealing. Hum Brain Mapp 21: 213–220. [DOI] [PMC free article] [PubMed] [Google Scholar]
- Solomon SG,Lee BB,Sun H ( 2006): Suppressive surrounds and contrast gain in magnocellular‐pathway retinal ganglion cells of macaque. J Neurosci 26: 8715–8726. [DOI] [PMC free article] [PubMed] [Google Scholar]
- Solomon SG,White AJ,Martin PR ( 2002): Extraclassical receptive field properties of parvocellular, magnocellular, and koniocellular cells in the primate lateral geniculate nucleus. J Neurosci 22: 338–349. [DOI] [PMC free article] [PubMed] [Google Scholar]
- Stefanovic B,Warnking JM,Pike GB ( 2004): Hemodynamic and metabolic responses to neuronal inhibition. Neuroimage 22: 771–778. [DOI] [PubMed] [Google Scholar]
- Stefanovic B,Warnking JM,Rylander KM,Pike GB ( 2006): The effect of global cerebral vasodilation on focal activation hemodynamics. Neuroimage 30: 726–734. [DOI] [PubMed] [Google Scholar]
- Stenbacka L,Vanni S ( 2007): fMRI of peripheral visual field representation. Clin Neurophysiol 118: 1303–1314. [DOI] [PubMed] [Google Scholar]
- Takahashi S,Ejima Y ( 1985): Effects on grating detection of vertically displaced peripheral gratings. Vis Res 25: 129–136. [DOI] [PubMed] [Google Scholar]
- Thirion B,Duchesnay E,Hubbard E,Dubois J,Poline JB,Lebihan D,Dehaene S ( 2006): Inverse retinotopy: Inferring the visual content of images from brain activation patterns. Neuroimage 33: 1104–1116. [DOI] [PubMed] [Google Scholar]
- Tolias AS,Sultan F,Augath M,Oeltermann A,Tehovnik EJ,Schiller PH,Logothetis NK ( 2005): Mapping cortical activity elicited with electrical microstimulation using FMRI in the macaque. Neuron 48: 901–911. [DOI] [PubMed] [Google Scholar]
- Vanni S,Henriksson L,James AC ( 2005): Multifocal fMRI mapping of visual cortical areas. Neuroimage 27: 95–105. [DOI] [PubMed] [Google Scholar]
- Warnking J,Dojat M,Guerin‐Dugue A,Delon‐Martin C,Olympieff S,Richard N,Chehikian A,Segebarth C ( 2002): fMRI retinotopic mapping—Step by step. Neuroimage 17: 1665–1683. [DOI] [PubMed] [Google Scholar]
- Vazquez AL,Cohen ER,Gulani V,Hernandez‐Garcia L,Zheng Y,Lee GR,Kim SG,Grotberg JB,Noll DC ( 2006): Vascular dynamics and BOLD fMRI: CBF level effects and analysis considerations. Neuroimage 32: 1642–1655. [DOI] [PubMed] [Google Scholar]
- Wielaard J,Sajda P ( 2006): Extraclassical receptive field phenomena and short‐range connectivity in V1. Cereb Cortex 16: 1531–1545. [DOI] [PubMed] [Google Scholar]
- Wilke M,Logothetis NK,Leopold DA ( 2006): Local field potential reflects perceptual suppression in monkey visual cortex. Proc Natl Acad Sci USA 103: 17507–17512. [DOI] [PMC free article] [PubMed] [Google Scholar]
- Williams AL,Singh KD,Smith AT ( 2003): Surround modulation measured with functional MRI in the human visual cortex. J Neurophysiol 89: 525–533. [DOI] [PubMed] [Google Scholar]
- Vinje WE,Gallant JL ( 2002): Natural stimulation of the nonclassical receptive field increases information transmission efficiency in V1. J Neurosci 22: 2904–2915. [DOI] [PMC free article] [PubMed] [Google Scholar]
- Xing J,Heeger DJ ( 2001): Measurement and modeling of center‐surround suppression and enhancement. Vis Res 41: 571–583. [DOI] [PubMed] [Google Scholar]
- Yu C,Klein SA,Levi DM ( 2003): Cross‐ and iso‐ oriented surrounds modulate the contrast response function: The effect of surround contrast. J Vis 3: 527–540. [DOI] [PubMed] [Google Scholar]
- Zenger‐Landolt B,Heeger DJ ( 2003): Response suppression in V1 agrees with psychophysics of surround masking. J Neurosci 23: 6884–6893. [DOI] [PMC free article] [PubMed] [Google Scholar]