

Abstract
Multi‐voxel pattern analysis (MVPA) was used to analyze blood–oxygen level dependent functional magnetic resonance imaging (BOLD fMRI) data, which were acquired as human subjects received brief vibrotactile stimulation of their hands and feet. Support vector machines trained and tested on the whole brain fMRI data were able to accurately decode the body site of single touches, with mean performance of 92% in a two‐way discrimination task (chance performance 50%) and 70% in a four‐way discrimination task (chance performance 25%). Primary and secondary somatosensory areas (S1 and S2) alone decoded the touched body site with high accuracy. S1 was more accurate at decoding touches closely spaced on the body surface (different fingers of the same hand) whereas S2 and S1 were equally accurate at decoding widely spaced touches (hand vs. foot). The hand and foot regions of S1 (S1hand and S1foot) were separately examined in a two‐way classification task. S1hand was better able to decode the hand of stimulation (left vs. right), and S1foot was better able to decode the foot of stimulation. In addition to S1 and S2, vibrotactile responses were observed in a region of visual cortex, areas MST and STP (MST/STP) in lateral occipito‐temporal lobe. MST/STP was able to accurately decode the hand but not the foot of stimulation, supporting the idea of a role for MST/STP in eye‐hand coordination. Hum Brain Mapp 2009. © 2009 Wiley‐Liss, Inc.
Keywords: touch, somatosensory, multi‐voxel pattern analysis
INTRODUCTION
Traditional neuroimaging analyses use information about the sensory stimulus or behavioral state of the subject to calculate a measure of activation in a single brain voxel at a time. Recently, techniques have been developed to measure distributed patterns of activity across the brain, referred to as multi‐voxel pattern analysis (MVPA) (Norman et al.,2006). With MVPA, the traditional analysis is reversed and measurements of brain activity are used to decode the sensory stimulus presented to the subject or the mental or behavioral state of the subject (Cox and Savoy,2003; Haynes and Rees,2006; Kamitani and Tong,2005; Kriegeskorte et al.,2006; LaConte et al.,2005).
Most distributed pattern analysis studies have focused on decoding visually‐presented stimuli. Visual cortex is anatomically the largest of the early sensory cortices, and even simple visual stimuli evoke activity in many visual areas (Grill‐Spector and Malach,2004). This distributed representation makes visual cortex an ideal laboratory for MVPA, because it provides many active voxels across which to pool information. However, it raises the question of whether other sensory modalities whose cortical representations are smaller or less distributed than visual cortex are amenable to MVPA. We performed two experiments to investigate whether MVPA could be used to decode individual stimuli presented in a different sensory modality, namely the somatosensory system.
In both experiments, a simple vibrotactile somatosensory stimulus (touch) was delivered to different locations on the body surface. In the first experiment, widely separated touches were delivered to the left or right hand or foot of the subject. In the second experiment, closely spaced touches were delivered to three fingers on the right hand and to the right foot. Our analyses focused on three regions of the somatosensory network: primary somatosensory cortex (S1), secondary somatosensory cortex (S2), and a region of lateral occipital‐temporal cortex, MST/STP, that has traditionally been labeled as visual association cortex but also responds to touch (Beauchamp et al.,2007;2008; Blake et al.,2004; Hagen et al.,2002; Ricciardi et al.,2007).
Most MVPA studies have used blocked designs, in which stimuli from the same category are grouped. Block designs are problematic in the somatosensory system, where adaptation is pronounced both peripherally and centrally (Leung et al.,2005; Tommerdahl et al.,2005). Rapid event‐related designs are an efficient way to present many different stimuli while minimizing adaptation. We developed a simple technique to analyze single trials of somatosensory stimulation presented in a rapid event‐related design using support vector machines (SVMs), a supervised learning method that performs efficiently at high‐dimensional classification tasks like those found in fMRI (Cox and Savoy,2003; LaConte et al.,2005).
METHODS
Subjects were recruited and informed consent was obtained in accordance with the University of Texas Committee for the Protection of Human Subjects. Subjects were scanned using a 3 tesla whole‐body MR scanner (Phillips Medical Systems, Bothell, WA). Seven subjects participated in experiment 1, and eight subjects participated in experiment 2. In both experiments, vibrotactile somatosensory stimuli were delivered by five piezoelectric benders. In experiment 1, the five benders were attached to the left palm, the right palm, the sole of the left foot, the sole of the right foot, and the right hip (Fig. 1 A). In experiment 2, the benders were attached to the thumb (D1), the third (middle) finger (D3), and the fifth (pinky) finger (D5) of the right hand (adjacent fingers were not stimulated because of mechanical constraints introduced by the benders); the right foot; and the right hip (Fig. 1 B). A similar rapid event‐related design was used for both experiments (Fig. 1 C). Each 5‐min scan series contained 150 two‐second trials (corresponding to the MRI repetition time, TR, of 2 sec) with 10 hip target trials, 40 fixation baseline trials with no somatosensory stimulus, and 25 of each of the other four benders. Trial ordering was counter‐balanced so that each trial type was equally likely to be preceded by any other trial type, and experimental power was maximized by jittering (randomizing) the interval between two trials of the same type (Dale,1999). Six scan series were collected from each subject. There was no task during hand or foot stimulation, other than to maintain visual fixation on central crosshairs. During hip stimulation trials, subjects were required to make an eye movement to a visually presented target. This ensured that subjects remained alert and attentive throughout the experiment. Because hip trials were analyzed separately (and not used for the classification analysis) any brain activity related to the eye movement responses could not contribute to classification performance.
Figure 1.
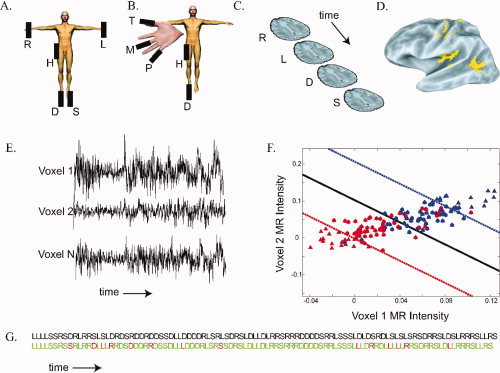
Methods used for somatosensory multivoxel pattern analysis. A. Somatosensory stimuli were delivered by five piezoelectric benders. In experiment 1, the benders were located on the palm of the right hand (R), the palm of the left hand (L), the sole of the right foot (D), the sole of the left foot (S), and the right hip (H). B. In experiment 2, the benders were located on the right thumb (T), the right middle finger (M), the right fifth pinky finger (P), the right hip (H), and the right foot (D). C. During the course of an MRI scan series, brain volumes were acquired (shown schematically by single brain slices) every 2 sec. Each acquisition corresponded to a single stimulation trial in which a single body site was stimulated, shown by a letter corresponding to the body plan shown in (A). Some trials (not shown) contained target bender stimulation or fixation baseline with no somatosensory stimulation. D. Using the MR data, an activation map was constructed of voxels responding significantly more (P < 10−6) to somatosensory stimulation than to fixation baseline. A lateral view of a partially inflated left hemisphere is shown, yellow color shows active areas (Argall et al.,2006). E. Over the course of a scan series, 150 brain volumes were acquired. The three black traces show the image intensity over the course of a scan series in three active voxels selected from the yellow voxels in (C). F. The time series from all active voxels (E) and the stimulus ordering (C) were used to train an N‐dimensional support vector machine. For illustration, a simplified training dataset is shown, with only two voxels and two stimulus categories (right hand and left hand). Each symbol shows the normalized MR image intensity during a single trial. The red triangles show the MR image intensity in all right hand stimulation trials and the blue triangles show the intensity in all left hand stimulation trials. The solid line shows the separating hyperplane W T X i + w 0 = 0 calculated by the classifier. The dashed lines show the margin boundaries W T X i + w 0 = ±1. Trials falling between the margin boundaries were used as support vectors (indicated by circles). An unknown test trial is classified as “right hand” if it falls below the solid line and “left hand” if it lies above the solid line. G. Result of the experiment 1 classifier when tested on a different scan series not used for training. The actual stimulus ordering presented to the subject is shown in the top row in all black, body part abbreviations as in (A). The classifier prediction of the stimulus ordering is shown in the bottom row: green for correct classification, red for incorrect classification. Performance of the classifier in this scan series was 86% correct (P < 10−38). [Color figure can be viewed in the online issue, which is available at www.interscience.wiley.com.]
A finite impulse response model was used to fit the MR time series in the context of the general linear model using the AFNI program 3dDeconvolve (Cox,1996). The average response to each trial type in each voxel was determined with nine individual tent functions that modeled the entire BOLD response from 0 to 16 sec post‐stimulus, accounting for overlapping responses from consecutive trials without any assumptions about the shape of the hemodynamic response (Glover,1999). An F‐test was used to find active voxels, defined as those in which the tent functions for the hand and foot stimulation trials accounted for a significant fraction (P < 10−6) of the variance.
Classifier Training and Testing
Separate classifiers, as implemented in SVMlight (Joachims,1999) were constructed for each subject using the 3dsvm command in AFNI. Complementary analyses with a different package, LibSVM (Chang and Lin,2001), gave very similar results. Within each subject, the SVM was trained using one set of data from the subject. Then, the SVM was tested on additional data not used for training.
The input to the SVM consisted of a matrix of pattern vectors, X y,i. X had N rows corresponding to the number of active voxels, with y corresponding to the trial type and i corresponding to the trial index of that trial type. Because the feature dimension N was high, a linear kernel was used to lower the computation time (LaConte et al.,2005;2007). Separate classifiers were constructed for each pair of stimuli and combined using a decision directed acyclic graph (Platt et al.,2000).
In each subject, six scan series were collected, each containing a random sequence of somatosensory stimuli. This allowed the use of leave‐one‐out cross‐validation to assess classification performance. Within each subject, six different SVMs were constructed, each trained on a different set of five scan series collected from the subject. Then, each SVM was tested on the single left‐out scan series not used for training. Arranging the samples in this way avoids splitting samples from one run into both training and test sets which may be problematic due to dependency among successive samples within each run (Haxby et al.,2001).
Because the BOLD response to brief somatosensory stimulation was relatively punctate (Fig. 6 A), to estimate the response to individual trials we made the simplifying assumption that the image intensity in a voxel at a given time reflected only the somatosensory stimulus delivered two TRs (4 sec) previously; this meant that the estimated response to a single trial contained small contributions from previous trials. This did not introduce bias into the classifier for two reasons. Most importantly, all training trials were from different five‐minute scan series (separated by 30 sec–30 min) from the trial being classified, preventing BOLD spillover between testing and training trials. Any BOLD response spillover could only hurt classification performance (by providing a less accurate estimate of the true response), and not help classification performance (by introducing a classification signal into neighboring trials, as would occur if training and testing was performed within a single scan series). Second, first order counterbalancing was used when designing the stimulus sequence, and the stimulus sequence for each scan series was randomized independently, ensuring that there were no systematic order effects that could help classification performance.
Figure 6.
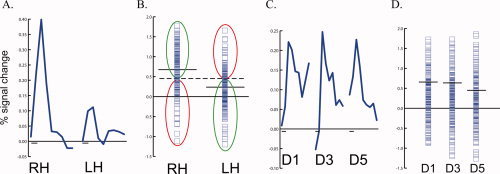
Classification performance with univariate analysis. A. The solid blue line shows the BOLD response averaged across all trials to right hand (RH) and left hand (LH) touch in the left hemisphere S2 of an individual subject in experiment 1. The duration of each response is 16 sec; the small black bar on the x‐axis shows the stimulus duration of 2 sec. B. Each blue symbol show the BOLD response in a single trial of right hand (RH) touch (left column of symbols) and left hand (LH) touch (right column) in left S2 (same subject as A). The solid black lines show the mean response to RH and LH touch. The optimal classification boundary is midway between the two means (dashed line). This boundary correctly classifies all RH trials above it and all LH trials below it (66%, green ellipses) and incorrectly classifies all RH trials below it and all LH trials above it (34%, red ellipses). C. The BOLD response, averaged across all trials, to thumb (D1), middle finger (D3), and pinky finger (D5) touch in the left hemisphere S2 of an individual subject in experiment 2. D. Individual trial responses (blue squares) and means (black lines) in S2 to single finger touch. [Color figure can be viewed in the online issue, which is available at www.interscience.wiley.com.]
The image intensity used for classification was obtained from the adjusted MR time series, which had regressors of no interest removed to reduce temporal variation. The regressors of no interest included a mean and linear trend for each scan series (accounting for slow drifts in the MR time series); head motion estimates from the image registration algorithm; and the estimated hip trial responses. For two‐way classification, estimates of the response to the unclassified trial types were also considered to be regressors of no interest. To the extent that noise from the regressors of no interest remained in the MR time series, classification performance will be impaired, resulting in an underestimate of classifier performance.
Additional Analyses
To identify voxels for classification, a leave‐one‐out procedure was used to identify voxels that responded to somatosensory stimulation (P < 10−6) in the five scan series used for training each classifier. Data in the left‐out scan series was not used to construct the activation map for the corresponding classifier to avoid introducing bias. For further analysis, the active voxels were grouped into different regions of interest (ROIs) based on anatomical and functional criteria using the same leave‐one‐out procedure (see Fig. 2). The primary somatosensory cortex (S1) ROI was created from all active voxels in and near the central sulcus, postcentral gyrus and postcentral sulcus. The secondary somatosensory cortex (S2) ROI was created from all active voxels in and near the parietal operculum. A visual association ROI was created from all active voxels in and near posterior superior temporal sulcus, middle temporal gyrus, and inferior temporal sulcus. Because this brain region contains the medial superior temporal area (MST) and the superior temporal polysensory (STP) areas, we labeled it the MST/STP ROI. Two additional ROIs were created from subsets of voxels in S1. The S1foot ROI was created from all contiguous voxels on the vertex and medial face of the hemisphere that showed a significantly greater response to foot than to hand stimulation (P < 0.05). The S1hand ROI was created from all contiguous voxels near the so‐called hand knob (Yousry et al.,1997) that showed a significantly greater response to hand than to foot stimulation (P < 0.05). To study the effect of ROI size on classification performance, permutation testing was used (Haynes and Rees,2005b). For a given ROI size s, s voxels were randomly selected from the ROI and used to train and test a classifier. This process was repeated 100 times (with different pools of s randomly selected voxels) to give the average performance of the ROI at size s. Across subjects, the performance was averaged at size s and the between‐subjects variance was used to calculate the SD. This process was then repeated across values of s.
Figure 2.
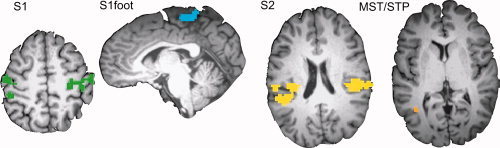
Regions of interest (ROIs). Regions of interest were defined individually in each subject. Colored voxels responded significantly more to somatosensory stimulation on the hands and feet than to fixation baseline (P < 10−6). Different colors indicate different ROIs. S1 (green), primary somatosensory cortex; S1foot (blue), foot sub‐region of S1; S2 (yellow), secondary somatosensory cortex and associated areas; MST/STP (orange), areas MST and STP. [Color figure can be viewed in the online issue, which is available at www.interscience.wiley.com.]
RESULTS
In each subject, somatosensory stimulation activated somatosensory cortex in the postcentral gyrus and parietal operculum and regions of visual association cortex in lateral occipitotemporal lobe (Fig. 1 D). The response in these areas was used to train a classifier, which in turn was used to decode the body site of somatosensory stimulation for individual trials not used for training. The classifier prediction across all trials in a single scan series is shown in Figure 1 F. The classifier successfully predicted the correct body site for stimulation for 85% of the trials (shown in green) and incorrectly classified 15% of the trials (shown in red). Because classification was performed on each trial separately, this level of prediction accuracy was highly unlikely to be due to chance. For 100 hand and foot trials in the example scan series, the chance likelihood under the binomial distribution of at least 85 correct trials was P < 10−38 (success probability per trial of 25%). For the same subject, five additional classifiers were trained and tested, producing a total classification across six scan series of 462 correct and 138 incorrect (77%); the chance likelihood of this performance was vanishingly small (P < 10−99). In every one of seven subjects, decoding performance was much greater than chance, with a mean of 68 ± 3% SEM across subjects. Changing the ratio of training to testing data (from five scan series for training and one scan series for testing to three scan series for training and three scan series for testing) did not change classification accuracy.
We also examined the ability of separate sets of classifiers to perform two‐way discriminations between the left and right hand of stimulation, and the left and right foot of stimulation. Across subjects, the mean classification performance was 91 ± 2% SEM for two‐way hand decoding and 85 ± 1% for two‐way foot decoding (both P < 10−99 under the binomial distribution with success probability per trial of 50%).
Having shown that MVPA across all active areas could successfully decode the body site of stimulation, we wished to determine if different brain areas differed in their decoding ability. Classifiers were separately trained and tested using only the voxels in each of three ROIs: S1, S2, and MST/STP. The four‐way decoding performance across subjects was 60 ± 1% for the S1 ROI; 60 ± 1% for the S2 ROI; and 30 ± 0.4% for the MST/STP ROI (Fig. 3 A). The scores of the S1, S2, and MST/STP ROIs were entered into a one‐factor ANOVA, which revealed a significant effect of area (F(2,18) = 51, P < 10−7).
Figure 3.
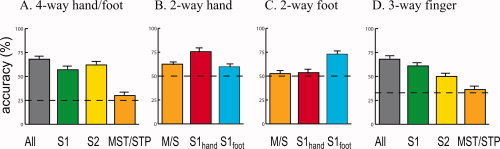
Classification performance. A. Performance for four‐way classification (right hand, left hand, right foot, and left foot). The mean performance of the classifier when classifying single trials in a scan series not used for training, averaged across eight subjects (error bars shows the SEM). The gray bar shows the performance when the classifier was trained and tested on voxels in all ROIs; colored bars show performance when classifier was trained and tested only on voxels in a single ROI (S1, S2, MST/STP). Chance performance was 25% (dashed line). B. Accuracy of two‐way classification (left hand vs. right) in three ROIs. C. Accuracy of two‐way classification (left foot vs. right foot) in three ROIs. D. Accuracy of three‐way classification in experiment 2 (thumb vs. middle finger vs. pinky finger). [Color figure can be viewed in the online issue, which is available at www.interscience.wiley.com.]
To study distributed representations in somatosensory cortex, we created two additional ROIs consisting of voxels in the foot region of S1 (S1foot) and voxels in the hand region of S1 (S1hand), as determined by their anatomical location and preference for foot vs. hand stimulation. The ability of both ROIs to perform two‐way classification (left vs. right) was tested (Fig. 3 B,C). S1hand was better at predicting side of hand stimulation than side of foot stimulation (75 vs. 54%, P < 0.001). S1foot was significantly better at predicting side of foot stimulation than side of hand stimulation (73 vs. 60%, P < 10−4).
In a previous study, MST significantly preferred hand stimulation to foot stimulation, perhaps because of a role in eye‐hand coordination (Beauchamp et al.,2007). We hypothesized that the relatively poor MST/STP performance in 4‐way classification might reflect differential performance on hand and foot classification. Therefore, the ability of MST/STP to classify hand stimuli (left vs. right) and foot stimuli (left vs. right) was also separately tested. MST/STP classification performance was significantly greater for hand classification than for foot classification (62 vs. 53%, P < 0.001).
To avoid assumptions introduced by predefining regions of interest, we trained additional classifiers with whole brain data. Because a linear SVM was used, the decision boundary can be mapped directly to image space (LaConte et al.,2007). This provides an assumptions‐free map (without predefined ROIs) of voxels that contain significant information about the body site of stimulation. As shown in Fig. 4, voxels with high feature space weights were found in S1, S1foot, and S2, similar to the functional activation maps obtained from the traditional univariate methods.
Figure 4.
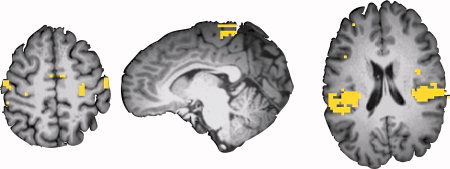
Support vector weight maps. Map of the support vector weights (|weights|>10 colored yellow) assigned to each voxel in an ROI‐free analysis, for the same subject as shown in Figure 2. Note the high weights for voxels in S1 (left), S1foot (middle), and S2 (right). [Color figure can be viewed in the online issue, which is available at www.interscience.wiley.com.]
To study how classification performance changed with ROI size across all subjects, classifiers were trained and tested with sub‐ROIs consisting of from 1 to 70 voxels randomly selected from S1, S2, and MST/STP (Fig. 5
A–C, respectively). The accuracy with one voxel was low but performance increased as more voxels were added to the ROI. The increase had a rapid initial phase followed by a slow, nearly linear component, which was fit with a sum of two exponential functions y = ae
bx + ce
dx. The function produced a good fit (mean, r
2 = 0.996), with the slow linear component fit by the first exponential and the rapid initial phase fit by the second exponential. The number of voxels required to reach 75% of the rapid initial maximum was calculated as  . Averaged across subjects, 8.3 voxels was required to reach 75% of the initial maximum, with no significant difference between areas according to an ANOVA (F(2,21) = 0.9, P = 0.4).
Figure 5.
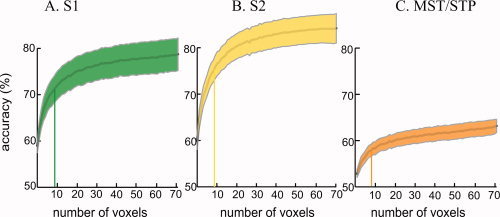
Relationship between region of interest size and classification performance. A. Classification accuracy for subsets of voxels from S1. Two‐way classification (left hand vs. right hand) was performed using randomly selected subsets of voxels. The y‐axis shows the classification accuracy for an ROI containing the number of voxels shown on the x‐axis. The center gray line shows the mean performance across subjects, the shaded area shows ±1 SEM across subjects (the color of the shaded area corresponds to the color used to illustrate the corresponding ROI in Fig. 2). The initial rise in the accuracy curve was fit with an exponential function. The vertical bar in each curve shows the number of voxels required to reach 75% of the peak of the exponential function. B. Classification accuracy for subsets of voxels from S2. C. Classification accuracy for subsets of voxels from MST/STP [Color figure can be viewed in the online issue, which is available at www.interscience.wiley.com.].
The results of experiment 1 demonstrated that MVPA could be used to decode somatosensory stimuli widely separated on the body surface (left and right hand and foot). To determine whether MVPA could also be successful in a more difficult somatosensory classification task, in experiment 2 touches were delivered to closely spaced locations on the body surface (different digits on the same hand and the foot).
In every one of eight subjects, decoding performance was much greater than chance, with a mean of 56 ± 4% SEM across subjects (chance performance of 25% for 4‐way decoding). As a more rigorous test, we measured decoding performance for 3‐way decoding of different fingers on the same hand. Performance was good for finger decoding, with a mean of 68 ± 3% SEM across subjects (chance performance of 33%). Subdividing the active voxels revealed significant differences in decoding performance between ROIs (Fig. 3 D; F(4,39) = 7.3, P = 0.0002). The best performance was found in S1 (61 ± 4% for the S1 ROI) and S2 (50 ± 3%).
The MVPA analysis used multivariate information from many voxels to successfully classify individual stimulation trials. Traditional univariate methods examine the average BOLD response to different trial types averaged across voxels in an ROI. Could classification be performed with the BOLD response to individual trials in an ROI? First, we examined the easier classification task of experiment 1. Figure 6 A shows the average response to left hand and right hand touches in left hemisphere S2 of a single subject. The response, averaged across all trials, was significantly greater for right hand than left hand touches. Next, we measured the response to each individual trial in left hemisphere S2 (Fig. 6 B). Although on average the BOLD signal change was greater in right hand than left hand trials, the distributions of the signal changes were largely overlapping. The optimal classification boundary was calculated as the average of the contralateral and ipsilateral response means, weighted by their variance. Because of the large variance in the individual trial responses, many trials were wrongly classified by the boundary. The univariate classification performance was calculated by creating a boundary from training runs, and then measuring accuracy on testing runs, to ensure an unbiased comparison with the equivalent leave‐one‐out analysis used for MVPA. The univariate S2 classification performance was 66%, much less than the 95% accuracy achieved with multivariate analysis for left S2 in this subject. A similar analysis for left S1 showed univariate accuracy of 66%, less than the 92% accuracy for MVPA in the same ROI. Next, we examined the more difficult classification task of experiment 2. In left S2 of a single subject the average response to D1, D3, and D5 touches was similar in amplitude (Fig. 6 C) and the distributions of the individual trial responses were almost completely overlapping (Fig. 6 D); a similar pattern was seen in S1. Classification accuracy for the univariate analysis was 43% for left S2 in this subject and 47% for S1, much less than the MVPA accuracy of 55% for S2 and 69% for S1.
DISCUSSION
For single, two‐second trials of somatosensory stimulation, MVPA was able to decode the body site of somatosensory stimulation at levels far above chance performance. Two‐way decoding performance of hand stimulation was particularly accurate, with a mean of 92% performance, similar to performance levels reported in two‐way decoding tasks with visual stimulation (e.g., 80% accuracy for an orthogonal orientation decoding task in (Haynes and Rees,2005a)). As in visual studies, increasing the difficulty of the classification task decreased classifier performance (Kay et al.,2008). However, even for closely spaced touches on the same hand, performance was still well above chance (68% compared with 33% chance performance). Also similar to MVPA studies of visual decoding, accuracy increased sharply as more voxels were included in the analysis, with the increase slowing as the number of voxels increased beyond 10 to twenty (Haynes and Rees,2005a).
In a visual MVPA study, V1 and V2 were both able to accurately decode stimulus orientation (Kamitani and Tong,2005). In the present study, S1 and S2 were able to decode the body site of stimulation with high levels of accuracy. Receptive fields in S1 are small and highly somatotopic, whereas receptive fields in S2 are much larger and less well‐organized (Nelson et al.,1980). This may correspond to the dissociation in classification accuracy observed between the experiments. In experiment 1, in which the stimuli were widely separated on the body surface, S2 and S1 classified the stimuli with similar accuracy (both 60%). In contrast, in the 3‐way finger decoding task of experiment 2, the stimuli were closely spaced on the body surface and S1 was more accurate than S2 (61 vs. 50%, P = 0.01). S1 and S2 both contain multiple subdivisions (Eickhoff et al.,2006; Kaas et al.,1979) and in future experiments at higher resolution it will be important to study the ability of these subdivisions to discriminate somatosensory stimuli.
Previous studies have reported responses to somatosensory stimuli in “visual” cortex (Amedi et al.,2001; Sathian et al.,1997). In particular, tactile responses have been reported in a region of lateral occipital‐temporal cortex that contains area MST and the possible human homolog of area STP (Beauchamp,2005; Beauchamp et al.,2007;2008; Blake et al.,2004; Hagen et al.,2002; Ricciardi et al.,2007). Previous MVPA studies have shown that MST and nearby areas can decode the direction of motion, but not the orientation, of visual stimuli (Kamitani and Tong,2005; Kamitani and Tong,2006). Here, we extend these findings by showing that fMRI activation patterns in MST/STP are able to decode information about the hand of somatosensory stimulation. Inactivation of monkey MST interferes with visually‐guided hand movements (Ilg and Schumann,2007) and transcranial magnetic stimulation of human MT/MST reduces reaching accuracy (Whitney et al.,2007). Although visual signals provide an accurate initial targeting signal during reaching movements, determining whether a target has actually been touched is most easily accomplished by the somatosensory system. Consistent with this idea, MVPA of area MST/STP was able to determine the location of hand stimulation (left vs. right) with performance far above chance. However, MST/STP was not able to decode the finger of touch for fingers on the same hand, suggesting that tactile inputs into MST/STP are not highly specific, perhaps signaling only that a touch has occurred. Decoding performance in MST/STP was also poor for foot touches, consistent with a role in eye‐hand coordination. Although eye‐foot coordination is important in some tasks, such as directing a ball with the foot, these tasks may be subserved by other brain areas.
Building on the previous literature (Haynes and Rees,2006; Kamitani and Tong,2005; Kriegeskorte et al.,2006; LaConte et al.,2005; Norman et al.,2006), we performed MVPA on individual trials presented in a rapid event‐related somatosensory stimulation design. The ability to classify single trials has several important advantages. First, it results in a large testing and training set, important for good classification performance (Mitchell et al.,2004). Second, it allows for real‐time designs that provide feedback to the subject or make adjustments in the task difficulty (LaConte et al.,2007). Third, it is a necessity for correlating behavior and information content on a trial‐by‐trial basis (Wagner et al.,1998). In the somatosensory modality, event‐related designs are particularly critical because there is a great amount of adaptation both peripherally and centrally (Deuchert et al.,2002). Taken together, these studies illustrate how MVPA allows a closer investigation of the function of different cortical areas by examining their information content, above and beyond simple fMRI activation maps of single voxels responding to a sensory stimulus (Kriegeskorte and Bandettini,2007).
REFERENCES
- Amedi A,Malach R,Hendler T,Peled S,Zohary E ( 2001): Visuo‐haptic object‐related activation in the ventral visual pathway. Nat Neurosci 4: 324–330. [DOI] [PubMed] [Google Scholar]
- Argall BD,Saad ZS,Beauchamp MS ( 2006): Simplified intersubject averaging on the cortical surface using SUMA. Hum Brain Mapp 27: 14–27. [DOI] [PMC free article] [PubMed] [Google Scholar]
- Beauchamp MS ( 2005): See me, hear me, touch me: multisensory integration in lateral occipital‐temporal cortex. Curr Opin Neurobiol 15: 145–153. [DOI] [PubMed] [Google Scholar]
- Beauchamp MS,Yasar NE,Kishan N,Ro T ( 2007): Human MST but not MT responds to tactile stimulation. J Neurosci 27: 8261–8267. [DOI] [PMC free article] [PubMed] [Google Scholar]
- Beauchamp MS,Yasar NE,Frye RE,Ro T ( 2008): Touch, sound and vision in human superior temporal sulcus. Neuroimage 41: 1011–1020. [DOI] [PMC free article] [PubMed] [Google Scholar]
- Blake R,Sobel KV,James TW ( 2004): Neural synergy between kinetic vision and touch. Psychol Sci 15: 397–402. [DOI] [PubMed] [Google Scholar]
- Chang C‐C,Lin C‐J ( 2001):LIBSVM: a library for support vector machines , 2001. Software available at http://www.csie.ntu.edu.tw/~cjlin/libsvm.
- Cox DD,Savoy RL ( 2003): Functional magnetic resonance imaging (fMRI) “brain reading”: detecting and classifying distributed patterns of fMRI activity in human visual cortex. Neuroimage 19(2 Part 1): 261–270. [DOI] [PubMed] [Google Scholar]
- Cox RW ( 1996): AFNI: Software for analysis and visualization of functional magnetic resonance neuroimages. Comput Biomed Res 29: 162–173. [DOI] [PubMed] [Google Scholar]
- Dale AM ( 1999): Optimal experimental design for event‐related fMRI. Hum Brain Mapp 8: 109–114. [DOI] [PMC free article] [PubMed] [Google Scholar]
- Deuchert M,Ruben J,Schwiemann J,Meyer R,Thees S,Krause T,Blankenburg F,Villringer K,Kurth R,Curio G,Villringer A. ( 2002): Event‐related fMRI of the somatosensory system using electrical finger stimulation. Neuroreport 13: 365–369. [DOI] [PubMed] [Google Scholar]
- Eickhoff SB,Amunts K,Mohlberg H,Zilles K ( 2006): The human parietal operculum. II. Stereotaxic maps and correlation with functional imaging results Cereb Cortex 16: 268–279. [DOI] [PubMed] [Google Scholar]
- Glover GH ( 1999): Deconvolution of impulse response in event‐related BOLD fMRI. Neuroimage 9: 416–429. [DOI] [PubMed] [Google Scholar]
- Grill‐Spector K,Malach R ( 2004): The human visual cortex. Annu Rev Neurosci 27: 649–677. [DOI] [PubMed] [Google Scholar]
- Hagen MC,Franzen O,McGlone F,Essick G,Dancer C,Pardo JV ( 2002): Tactile motion activates the human middle temporal/V5 (MT/V5) complex. Eur J Neurosci 16: 957–964. [DOI] [PubMed] [Google Scholar]
- Haxby JV,Gobbini MI,Furey ML,Ishai A,Schouten JL,Pietrini P ( 2001): Distributed and overlapping representations of faces and objects in ventral temporal cortex. Science 293: 2425–2430. [DOI] [PubMed] [Google Scholar]
- Haynes JD,Rees G ( 2005a) Predicting the orientation of invisible stimuli from activity in human primary visual cortex. Nat Neurosci 8: 686–691. [DOI] [PubMed] [Google Scholar]
- Haynes JD,Rees G ( 2005b) Predicting the stream of consciousness from activity in human visual cortex. Curr Biol 15: 1301–1307. [DOI] [PubMed] [Google Scholar]
- Haynes JD,Rees G ( 2006): Decoding mental states from brain activity in humans. Nat Rev Neurosci 7: 523–534. [DOI] [PubMed] [Google Scholar]
- Ilg UJ,Schumann S ( 2007): Primate area MST‐l is involved in the generation of goal‐directed eye and hand movements. J Neurophysiol 97: 761–771. [DOI] [PubMed] [Google Scholar]
- Joachims T. 1999. Maing large‐scale SVM learning practical In: Scholkopf B,Burges C, Smola A, editors. Advances in Kernel Methods–Support Vector Learning. Cambridge, MA: MIT Press. [Google Scholar]
- Kaas JH,Nelson RJ,Sur M,Lin CS,Merzenich MM ( 1979): Multiple representations of the body within the primary somatosensory cortex of primates. Science 204: 521–523. [DOI] [PubMed] [Google Scholar]
- Kamitani Y,Tong F ( 2005): Decoding the visual and subjective contents of the human brain. Nat Neurosci 8: 679–685. [DOI] [PMC free article] [PubMed] [Google Scholar]
- Kamitani Y,Tong F ( 2006): Decoding seen and attended motion directions from activity in the human visual cortex. Curr Biol 16: 1096–1102. [DOI] [PMC free article] [PubMed] [Google Scholar]
- Kay KN,Naselaris T,Prenger RJ,Gallant JL ( 2008): Identifying natural images from human brain activity. Nature 452: 352–355. [DOI] [PMC free article] [PubMed] [Google Scholar]
- Kriegeskorte N,Bandettini P ( 2007): Combining the tools: activation‐ and information‐based fMRI analysis. Neuroimage 38: 666–668. [DOI] [PubMed] [Google Scholar]
- Kriegeskorte N,Goebel R,Bandettini P ( 2006): Information‐based functional brain mapping. Proc Natl Acad Sci U S A 103: 3863–3868. [DOI] [PMC free article] [PubMed] [Google Scholar]
- LaConte S,Strother S,Cherkassky V,Anderson J,Hu X ( 2005): Support vector machines for temporal classification of block design fMRI data. Neuroimage 26: 317–329. [DOI] [PubMed] [Google Scholar]
- LaConte SM,Peltier SJ,Hu XP ( 2007): Real‐time fMRI using brain‐state classification. Hum Brain Mapp 28: 1033–1044. [DOI] [PMC free article] [PubMed] [Google Scholar]
- Leung YY,Bensmaia SJ,Hsiao SS,Johnson KO ( 2005): Time‐course of vibratory adaptation and recovery in cutaneous mechanoreceptive afferents. J Neurophysiol 94: 3037–3045. [DOI] [PMC free article] [PubMed] [Google Scholar]
- Mitchell TM,Hutchinson R,Niculescu RS,Pereira F,Wang X ( 2004): Learning to decode cognitive states from brain images. Machine Learn 57: 145–175. [Google Scholar]
- Nelson RJ,Sur M,Felleman DJ,Kaas JH ( 1980): Representations of the body surface in postcentral parietal cortex of Macaca fascicularis . J Comp Neurol 192: 611–643. [DOI] [PubMed] [Google Scholar]
- Norman KA,Polyn SM,Detre GJ,Haxby JV ( 2006): Beyond mind‐reading: multi‐voxel pattern analysis of fMRI data. Trends Cogn Sci 10: 424–430. [DOI] [PubMed] [Google Scholar]
- Platt JC,Cristiani N,Shawe‐Taylor J ( 2000): Large margin DAGs for multiclass classification In: Solla SA,Leen TK, Muller K‐R, editors. Advances in neural information processing. Cambridge, MA: MIT Press; pp 547–553. [Google Scholar]
- Ricciardi E,Vanello N,Sani L,Gentili C,Scilingo EP,Landini L,Guazzelli M,Bicchi A,Haxby JV,Pietrini P ( 2007): The Effect of visual experience on the development of functional architecture in hMT+. Cereb Cortex 17: 2933–2939 [DOI] [PubMed] [Google Scholar]
- Sathian K,Zangaladze A,Hoffman JM,Grafton ST ( 1997): Feeling with the mind's eye. Neuroreport 8: 3877–3881. [DOI] [PubMed] [Google Scholar]
- Tommerdahl M,Hester KD,Felix ER,Hollins M,Favorov OV,Quibrera PM,Whitsel BL ( 2005): Human vibrotactile frequency discriminative capacity after adaptation to 25 Hz or 200 Hz stimulation. Brain Res 1057: 1–9. [DOI] [PubMed] [Google Scholar]
- Wagner AD,Schacter DL,Rotte M,Koutstaal W,Maril A,Dale AM,Rosen BR,Buckner RL ( 1998): Building memories: remembering and forgetting of verbal experiences as predicted by brain activity. Science 281: 1188–1191. [DOI] [PubMed] [Google Scholar]
- Whitney D,Ellison A,Rice NJ,Arnold D,Goodale M,Walsh V,Milner D ( 2007): Visually guided reaching depends on motion area MT+. Cereb Cortex 17: 2644–2649 [DOI] [PMC free article] [PubMed] [Google Scholar]
- Yousry TA,Schmid UD,Alkadhi H,Schmidt D,Peraud A,Buettner A,Winkler P ( 1997): Localization of the motor hand area to a knob on the precentral gyrus. A new landmark. Brain 120(Part 1): 141–157. [DOI] [PubMed] [Google Scholar]