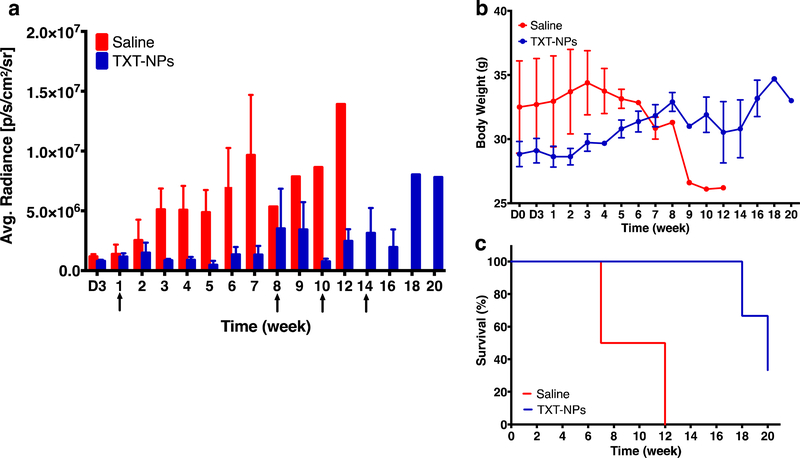
Figure 2: Effect of treatment with TXT-NPs on tumor regression.
Animals were treated with TXT-NPs (12 mg/kg TXT dose equivalent NPs) to determine the effect of first dosing. The subsequent dosing was administered when tumor began to grow. Arrows indicate dosing schedule. Changes in a) bioluminance signal in TXT-NPs treated vs. saline control groups, p=0.008; b) body weight in treated vs. saline group, p=NS; and c) survival of treated vs. saline control, p=0.04. Data are expressed as the mean ± s.e.m., n= 3 to 4. Median survival for saline group = 9.5 wks vs. 20 wks for treated group. X-axis abbreviation: D is for days, whereas other time points are in weeks.

