

Abstract
Previous studies on working memory (WM) function in adults with attention‐deficit/hyperactivity disorder (ADHD) suggested aberrant activation of the prefrontal cortex and the cerebellum. Although it has been hypothesized that activation differences in these regions most likely reflect aberrant frontocerebellar circuits, the functional coupling of these brain networks during cognitive performance has not been investigated so far. In this study, functional magnetic resonance imaging (fMRI) and both univariate and multivariate analytic techniques were used to investigate regional activation changes and functional connectivity differences during cognitive processing in healthy controls (n = 12) and ADHD adults (n = 12). Behavioral performance during a parametric verbal WM paradigm did not significantly differ between adults with ADHD and healthy controls. During the delay period of the activation task, however, ADHD patients showed significantly less activation in the left ventrolateral prefrontal cortex (VLPFC), as well as in cerebellar and occipital regions compared with healthy control subjects. In both groups, independent component analyses revealed a functional network comprising bilateral lateral prefrontal, striatal, and cingulate regions. ADHD adults had significantly lower connectivity in the bilateral VLPFC, the anterior cingulate cortex, the superior parietal lobule, and the cerebellum compared with healthy controls. Increased connectivity in ADHD adults was found in right prefrontal regions, the left dorsal cingulate cortex and the left cuneus. These findings suggest both regional brain activation deficits and functional connectivity changes of the VLPFC and the cerebellum as well as functional connectivity abnormalities of the anterior cingulate and the parietal cortex in ADHD adults during WM processing. Hum Brain Mapp, 2009. © 2008 Wiley‐Liss, Inc.
Keywords: working memory, prefrontal cortex, cerebellum, independent component analysis, functional connectivity, functional magnetic resonance imaging
INTRODUCTION
Deficits in executive function, behavioral inhibition, and working memory (WM) are considered as one of the key neuropsychological features in children and adolescents with attention‐deficit/hyperactivity disorder (ADHD) [Martinussen et al., 2005; Willcutt et al., 2005]. In fact, several authors have hypothesized that symptoms of ADHD arise from a primary deficit in specific domains of executive function, most notably in those cognitive domains associated with cognitive control [Arnsten and Li, 2005; Barkley, 1997]. For instance, impaired response inhibition has been repeatedly found in childhood ADHD [Barkley, 1997; Lijfijt et al., 2005] and ADHD adults [Clark et al., 2007; Lijfijt et al., 2005]. On the other hand, WM function has been widely studied on the behavioral level in children and adults with ADHD, showing both verbal and spatial WM deficits in affected individuals [Dowson et al., 2004; Lui and Tannock, 2007; Martinussen et al., 2005]. The concept of WM refers to the ability to transiently store and manipulate information held online for further behavioral guidance [Baddeley, 2003], and distinct WM subprocesses have been shown to be mediated by frontoparietal, striatal and cerebellar regions [Baddeley, 2003; Owen et al., 2005; Postle and D'Esposito, 2000]. It is less clear, however, if impaired inhibitory control and WM dysfunction represent distinct deficits in ADHD patients, or if these impaired cognitive domains share a common neurobiological substrate [Castellanos and Tannock, 2002].
Recently, it has been suggested that both response inhibition and WM deficits in ADHD may stem from a common pathologic process involving the inferior frontal cortex, rather than being manifestations of a distinct neuropathological mechanism [Clark et al., 2007]. In addition to the inferior frontal cortex, frontoparietal, striatal, and cerebellar activation abnormalities have been frequently reported during tasks that tap executive function including response inhibition and WM [Castellanos and Tannock, 2002; Clark et al., 2007; Dickstein et al., 2006]. Specifically, brain activation abnormalities of the ventrolateral prefrontal cortex (VLPFC), the anterior cingulate, and the cerebellum in children with ADHD have been associated with a deficit in inhibitory control [Durston et al., 2006; Schulz et al., 2004; Tauscher et al., 2002]. With regard to the VLPFC, functional activation changes of this region have been associated with ADHD symptom persistence [Schulz et al., 2005] and genetic vulnerability for ADHD [Durston et al., 2006]. However, functional brain imaging research on cognitive processes involving spatial or verbal WM function in children and adolescents with ADHD has been relatively sparse compared with studies conducted on inhibitory control [Sheridan et al., 2007; Stevens et al., 2007; Vance et al., 2007]. Moreover, despite the increased recognition of ADHD in adults [Faraone et al., 2000], research on executive function in adults with ADHD has been less extensive compared with the extant child and adolescent literature [Seidman et al., 2005]. Although WM dysfunction is recognized as an important cognitive correlate of the disorder, only a few functional imaging studies have attempted to examine the functional neuroanatomy underlying WM function in ADHD adults [Hale et al., 2007; Schweitzer et al., 2000; Valera et al., 2005], yielding ambiguous results with regard to prefrontal and cerebellar activation abnormalities: using positron emission tomography (PET) and a paced auditory serial addition task, Schweitzer et al. found that task‐related changes in regional cerebral blood flow (rCBF) in men without ADHD were more prominent in prefrontal and temporal regions [Schweitzer et al., 2000]. In ADHD adults, increased activation in prefrontal areas associated with language processing was found in a recent functional magnetic resonance imaging (fMRI) study using the forward and backward digit span [Hale et al., 2007]. In contrast, Valera et al. reported no activation differences in an a priori identified right prefrontal region and decreased activation in cerebellar regions during n‐back task performance in a relatively large sample of ADHD adults [Valera et al., 2005]. Although it has been previously hypothesized that regional brain activation abnormalities in ADHD adults likely reflect aberrant connectivity of a prefrontocerebellar network [Valera et al., 2005], the functional coupling of brain regions associated with cognitive performance in ADHD adults has not been investigated so far.
In this study, we used event‐related fMRI [Josephs and Henson, 1999] and a previously validated parametric verbal WM task [Wolf and Walter, 2005; Wolf et al., 2006] to investigate WM‐related brain activation in adults with ADHD compared with healthy controls. To address the issues of regional brain activation abnormalities and changes in functional connectivity during WM processing, we used both univariate and multivariate statistical approaches. Regional activation changes between healthy controls and ADHD adults were investigated within the framework of the General Linear Model (GLM). Parametric activation effects during dissociable WM subprocesses [D'Esposito et al., 2000; Postle and D'Esposito, 2000] were separately analyzed for three different task periods involving encoding, manipulation/maintenance, and retrieval of verbal stimuli. Changes in the functional coupling of the VLPFC were investigated using a multivariate statistical approach, i.e. independent component analysis (ICA). ICA is a statistical technique that maximizes the independence between the output components [Calhoun et al., 2001, 2004], thus identifying a set of spatially nonoverlapping and temporally synchronous brain networks. In its application to fMRI data, ICA has been demonstrated to be a viable method for revealing functionally related brain regions in healthy controls and patients with neuropsychiatric disorders [Celone et al., 2006; Garrity et al., 2007; Sambataro et al., 2008]. The combination of both univariate (GLM) and multivariate (ICA) statistical methods has been previously shown to explore different aspects of brain activity [Esposito et al., 2006], where GLM‐based methods are thought to be more sensitive to detect functional specificity, while an ICA approach is better suited to define aspects of functional connectivity [Esposito et al., 2006; Sambataro et al., 2008 ].
We were particularly interested in regional activation differences and the network involving the VLPFC and the cerebellum, since a dysfunction of this circuit has been recognized to play a pivotal role in the pathophysiology of ADHD [Arnsten and Li, 2005; Bush et al., 2005; Faraone and Biederman, 1998; Seidman et al., 2006]. As predicted by neurobiological models of prefrontal dysfunction in ADHD [Arnsten and Li, 2005; Dickstein et al., 2006; Durston et al., 2006], we hypothesized that compared with healthy controls, ADHD adults would show lower activation of the lateral prefrontal cortex and the cerebellum during WM processing. Furthermore, we hypothesized that apart from regional brain activation changes in the lateral prefrontal cortex and the cerebellum, ADHD adults would exhibit an aberrant connectivity pattern in a functionally related prefrontocerebellar network.
MATERIALS AND METHODS
Subjects
A total of 13 right‐handed adult males with a diagnosis of ADHD according to DSM‐IV criteria (combined type, n = 9; predominantly inattentive type n = 2, predominantly hyperactive‐impulsive type, n = 2) were recruited from among the outpatients treated at the Department of Psychiatry at the University of Würzburg, Germany. One patient's task fMRI performance data set was lost due to technical difficulties, thus reducing the number of patients included in all subsequent analyses to n = 12 (combined type, n = 8; predominantly inattentive type n = 2, predominantly hyperactive‐impulsive type, n = 2); see Table I for details on demographics and psychopathology. All patients were diagnosed by an experienced consultant in psychiatry (C.J.). The diagnosis of childhood manifestation of ADHD was retrospectively assessed with the DSM‐IV symptom list for ADHD (17 items) and by means of the 61‐item Wender Utah Rating Scale (WURS) [Ward et al., 1993]. To ensure diagnostic validity, additional information was collected from partners, relatives, friends, and from school report certificates. Adult manifestations of ADHD were assessed with the DSM‐IV symptom list for ADHD.
Table I.
Demographics and ADHD symptom scale scores
| Healthy controls (n = 12) | ADHD adults (n = 12) | P value | |||
|---|---|---|---|---|---|
| Mean | SD | Mean | SD | ||
| Age (years) | 21.6 | 4.7 | 22.2 | 4.4 | 0.76 |
| Education (years) | 13.6 | 2.6 | 12.3 | 1.6 | 0.17 |
| IQ | 106.8a | 5.8 | 108.9a | 3.8 | 0.31 |
| Age range (years) | 18–34 | 18–32 | |||
| Education range (years) | 10–19 | 9–15 | |||
| IQ range | 100–115a | 100–115a | |||
| Laterality score b | 91.8 | 13.4 | 88.7 | 9.8 | 0.52 |
| Adult Self Report Scale (ASRS): global score | 41.2 | 13.3 | |||
| Adult Self Report Scale (ASRS): attention deficit | 21.7 | 7.8 | |||
| Adult Self Report Scale (ASRS): hyperactivity | 19.5 | 7.7 | |||
| Wender Utah Rating Scale (WURS) | 100.1 | 26.1 | |||
| Barratt Impulsiveness Scale (BIS) | 75.8 | 10.9 | |||
| Eysenck Impulsiveness Questionnaire (EIQ) | 11.9 | 3.9 | |||
ADHD patients were excluded from participation if they (1) had a current axis‐I mood, substance‐related, psychotic, or anxiety disorder and/or a concurrent axis‐II disorder according to DSM‐IV (following a structured clinical interview (SCID I and II for DSM‐IV) conducted by C.J.), (2) had a history of dependence on illicit drugs or alcohol, (3) were currently taking any psychotropic medication other than psychostimulants, and (4) had sensorimotor deficits or other neurological disorders. Further general exclusion criteria were manifest reading disabilities (as indicated by subjective complaints, information from parents, relatives, and by school reports) and an IQ level below 80. All patients had a history of methylphenidate (MPH) treatment. At the time of the fMRI scanning, six patients were removed from medication for at least 6 weeks, whereas the remaining six patients discontinued their treatment with MPH at least 3 days prior to the scanning procedure. ADHD psychopathology was rated by means of the Adult Self Report Scale (ASRS) [Kessler et al., 2005; Reuter et al., 2006]. Impulsiveness was assessed by the Barratt Impulsiveness Scale (BIS) [Patton et al., 1995] and the Eysenck Impulsiveness Questionnaire (EIQ) [Gross et al., 1999].
The healthy control group was recruited from the University of Ulm campus and consisted of 12 right‐handed males matched for age, education and intelligence. Fluid intelligence in patients and controls was measured using a subroutine from the “Leistungspruefsystem” [Horn, 1983]. Controls were excluded from participation if they (1) had a current axis‐I and/or a concurrent axis‐II disorder according to DSM‐IV (following a structured clinical interview (SCID I and II for DSM‐IV) conducted by R.C.W. and N.V.), (2) had a first‐degree relative with a neurologic or psychiatric disorder, (3) had a history of dependence on illicit drugs or alcohol, (4) were currently taking any psychotropic medication, and (5) had sensorimotor deficits or other neurological disorders.
All participants received monetary compensation for their participation. The project was approved by the local Institutional Review Board. Written informed consent according to the Declaration of Helsinki was obtained from all subjects following a complete description of the purposes and risks of the study.
Neuropsychological Tests
To provide additional information on cognitive function in this patient sample, a neuropsychological test battery assessing verbal and spatial WM, executive function and behavioral inhibition was administered to each subject. Verbal and spatial WM tests included the digit span [Wechsler, 1981] and the Corsi block [Milner, 1971]. WM maintenance was assessed by forward testing, and WM manipulation processes were determined by backward testing (12 verbal and 9 spatial items, respectively, presented at 1 Hz). Executive function was measured using a computerized version of the Wisconsin Card Sorting Test, WCST [Nelson, 1976]. This WCST variant consisted of 48 cards and a maximum of five category switches. Inhibition was tested by a computerized version of the Stroop Word‐Color Interference Test [Perlstein et al., 1998] based on randomized single trials (20 trials per color and condition).
Cognitive Activation Task for fMRI
The cognitive activation task has been described elsewhere in full detail [Wolf and Walter, 2005; Wolf et al., 2006]; see also Figure 1. For each single trial, three capital gray letters appeared on a black screen during an initial stimulus period of 1,500 ms. One, two, or three of these letters were highlighted at the end of the stimulus period for 500 ms. Subjects were instructed to focus only on those letters which were highlighted and to memorize the letter(s) which followed them next in the alphabet (i.e. manipulated set). By emphasizing a shift of memoranda toward other letters of the alphabet, a manipulation component during the delay period was introduced. Low manipulation demand (i.e. WM “load level” 1) was characterized by one letter which had to be identified as the one which followed next in the alphabet and had to be maintained for 6,000 ms. Intermediate and high manipulation demand were characterized by two and three letters, respectively (i.e. load levels 2 and 3). In the probe period of 2,000 ms, subjects had to indicate whether a lower‐case letter was or was not part of the manipulated set. The control condition displayed three gray “X”s and required a stereotype button press in response to the presentation of a small “x” during the probe period, thus forming a motor task without WM requirements.
Figure 1.
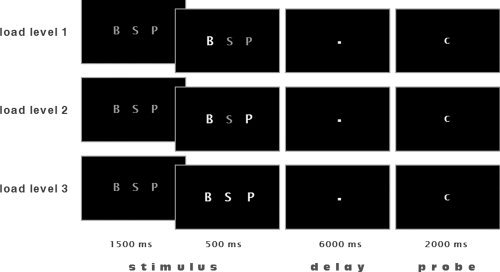
Activation paradigm. During a stimulus period of 1,500 ms, three capital gray letters appeared on a black screen. One, two, or three of these letters would then become highlighted for 500 ms. Subjects were instructed that during a subsequent 6,000 ms delay period they were to focus only on those letters which were highlighted and to memorize the letters which followed them in the alphabet (manipulated set). Low‐working memory demand was characterized by one letter which had to be identified as the one which followed next in the alphabet and had to be maintained for a short period of time (load level 1). Intermediate and high working memory demand was characterized by the processing of two and three “next” letters, respectively (load levels 2 and 3). In the probe period of 2,000 ms a lower case letter was presented, and subjects had to indicate whether this letter was or was not part of the manipulated set. The control condition displayed three gray “X”s and required a button press (right middle finger) in response to the presentation of a small “x” during the probe period. In this example, the probe (c) was always part of the manipulated set.
Functional Data Acquisition
The functional data were acquired using a 3T Magnetom ALLEGRA (Siemens, Erlangen, Germany) head MRI system. T2*‐weighted images were obtained using echo‐planar imaging in an axial orientation (TR = 2,400 ms, TE = 40 ms, FoV 192 mm, 64 × 64 matrix, 28 slices, slice thickness 3 mm, gap 1 mm). Stimuli were presented via LCD video goggles (Resonance Technologies, Northridge, CA) and both reaction times (RT) and accuracy indices were recorded. Head movement was minimized using padded ear phones. The fMRI protocol was an event‐related design with a pseudorandomized time jitter of 1.5 ± 0.5 TR intertrial‐interval (single trial duration = 10 s ± 2.4–4.8 s). The stimuli were pseudorandomized and counterbalanced for the relative frequency of each letter per WM load, position, and probe. The appearance of probes from the two immediately preceding trials was avoided in order to prevent proactive interference from preceding stimuli [Jonides et al., 1998]. All subjects performed three sessions in total, each including 28 trials, comprising 164 volumes. The first eight volumes of each session were discarded to allow for equilibration effects.
Data Analysis
Behavioral data analysis
Performance measures on the neuropsychological test battery were recorded as follows: (1) digit span, forward and backward condition: number of correctly retrieved items; (2) spatial span, forward and backward condition: number of correctly retrieved items; (3) WCST: number of perseverative errors and adjusted switch costs [Spitzer et al., 2001]; (4) Stroop test: mean RT of correctly identified targets and error differences between the incongruent and congruent conditions. Differences between controls and ADHD patients were assessed by calculating eight separate t tests (P < 0.05). In order to avoid α‐error accumulation, all t tests were Bonferroni‐corrected (P < 0.0064).
Task performance during fMRI was recorded as percentage of correct responses (accuracy) and RT of correctly performed trials. Between group differences in task accuracy and RT with increasing load were assessed separately using repeated‐measures analysis of variance (ANOVA; P < 0.05) with the factors group and load for accuracy and RT. Additionally, we performed directed t tests for RT and accuracy during all WM conditions (P < 0.05) between controls and patients.
Analysis of functional MRI data
Data preprocessing
Preprocessing of the functional data was performed using SPM5 (Wellcome Department of Cognitive Neurology, London) and MATLAB 7.2 (MathWorks, Natick, MA). The functional images were corrected for slice timing differences and for motion artifacts, then spatially normalized to the MNI template with a final voxel resolution of 3 mm × 3 mm × 3 mm voxels. All images were spatially smoothed with a 9 mm full width at half maximum (FWHM) isotropic Gaussian kernel.
Group‐level general linear model (GLM) analysis
To investigate parametrically varied local changes in brain activation, i.e. linear brain activation responses with linearly increasing WM load, single subject analyses and group comparisons were performed within a GLM framework [Friston et al., 1995a] using the “canonical‐hrf” function as a predictor to estimate the hemodynamic response function. A parametric design matrix was computed for each subject using SPM5. The stimulus, delay, and target periods were modeled as events occurring at the beginning of the respective phase, lasting 2,000 ms, 6,000 ms, and 2,000 ms, respectively. To assess linear brain activation responses with linearly increasing WM load, the stimulus, the delay, and the target period were separately modeled using a linear modulation of the respective regressor. Incorrectly performed trials and the individual head movement parameters were used as regressors of no interest. All images were entered into a fixed‐effects model for each subject [Friston et al., 1995b] and adjusted for global effects. Low‐frequency drifts were removed via a highpass filter using low‐frequency cosine functions with a cutoff of 137 s. For each subject regionally specific parametric responses were calculated for the stimulus, the delay, and the probe period using linear contrasts. These analyses yielded individual activation maps of linearly increasing brain activation with linearly increasing WM processing for the stimulus, the delay, and the probe phase.
To account for interindividual variance and in order to generalize inferences, random‐effects analyses were computed on the 2nd level [Holmes and Friston, 1998]. For within‐group analyses, voxelwise one‐sample t tests (P < 0.001, uncorrected) were used to calculate parametric within‐group maps for each task period (stimulus, delay and probe). For between‐group analyses, a two‐sample t test, masked by a combination of the main effects maps of both groups for each task period (i.e. the stimulus, delay and target phase, P < 0.001, uncorrected) was used to compare spatial maps between healthy controls and ADHD individuals. Being a priori driven, the statistical threshold for this between‐group comparison was set at P < 0.005, and a spatial contiguity criterion of 25 adjacent voxels [Forman et al., 1995].
Independent component analysis (ICA)
To investigate the functional coupling of the VLPFC and the cerebellum, a spatial ICA was performed using a group ICA for fMRI toolbox (GIFT; http://icatb.sourceforge.net); [Correa et al., 2005]. The dimensionality of the functional data for each subject was reduced using three consecutive steps of a Principal Component Analysis alternated with data concatenation, resulting in one aggregate mixing matrix for all subjects. The fMRI data were first concatenated per subject and then across all subjects. An ICA decomposition using the Infomax algorithm was used to extract 19 independent components (ICs), consisting of group spatial maps and related timecourses. The minimum description length criteria as implemented in GIFT were used to estimate the order selection, i.e. the number of ICs [Calhoun et al., 2001] from the smoothed data sets after taking into account the spatial and temporal correlation of the fMRI data. First, a set of effectively independent and identically distributed data samples was estimated for each subject through a subsampling algorithm. Second, the median of these values across the whole sample was used for order selection. The estimation of the number of the ICs performed directly on the data has been proven to effectively reduce the occurrence of over/underfitting the data [Li et al., 2007]. Eventually, the estimated ICs were used for a back reconstruction into individual ICs using the aggregate mixing matrix created during the dimensionality data reduction steps.
To identify a task‐related prefrontocerebellar network of interest, the individual ICs consisting of individual spatial independent maps and time‐courses were spatially sorted using a mask comprising the left VLPFC (BA 47) and the right cerebellum. Using MarsBar 0.41 [Brett et al., 2002], this mask was created from the between‐group differences on the 2nd level (healthy controls > ADHD adults, see also GLM analysis: between‐group comparisons section) and thus included the left VLPFC and right cerebellum as well as the right insula, the right middle occipital gyrus, and the right medial frontal gyrus. The component of interest (COI) that showed the highest positive spatial correlation with this mask across all three sessions was chosen for subsequent 2nd level within‐ and between‐group analyses.
The voxel weights across all sessions for each subject's spatial COI were used as random effects variables and analyzed on the 2nd level using SPM5. For within‐group analyses, voxelwise one‐sample t tests against the null hypothesis of zero magnitude were used to calculate within‐group maps (P < 0.001, uncorrected). For between‐group analyses, two‐sample t tests were used to compare spatial maps between healthy controls and ADHD adults. These analyses were masked by a combination of the main effects maps of both groups for the respective COI (P < 0.001, uncorrected). The statistical threshold for these comparisons was set at P < 0.05 corrected for multiple comparisons using the false discovery rate (qFDR) [Genovese et al., 2002; Storey and Tibshirani, 2003]. For all analyses, all anatomical regions and denominations are reported according to the atlases of Talairach and Tournoux [1988] and Duvernoy [1999]. Coordinates are maxima in a given cluster according to the MNI template.
Correlation analyses
Exploratory correlation analyses (P < 0.05, uncorrected for multiple comparisons) were calculated in order to investigate the relationship between brain function, ADHD symptoms, and WM task accuracy during fMRI. A nonparametric analysis was chosen in order to minimize potential effects of data outliers and of a non‐Gaussian distribution of the data. Spearman correlations were computed using the appropriate clinical variables, the accuracy measures for all WM load levels (levels 1–3) and the extracted beta parameter at the most significantly activated clusters emerging from the between‐group analyses (Figs. 2b and 3b). The beta parameters were extracted from both the parametric analysis (corresponding to the percent signal change) and the ICA (corresponding to the mean voxel weights of the COI). All correlation analyses were performed using the Statistica software package (Version 6.0, StatSoft Inc., Tulsa, OK).
Figure 2.
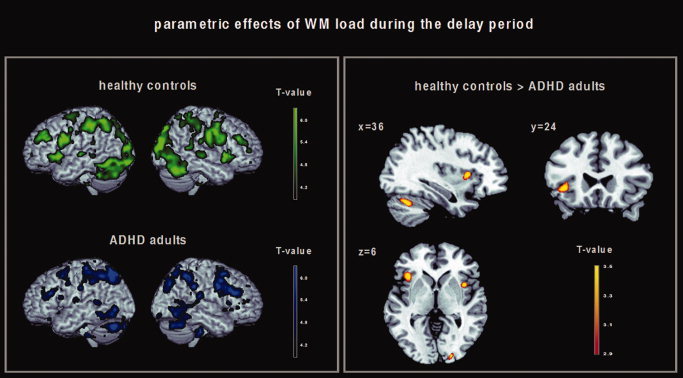
Left: Brain regions in which healthy controls (green) and ADHD adults (blue) showed a linear increase in brain activation with linearly increasing WM load during the delay period. Results of the 2nd level within‐group analysis, P < 0.001 (uncorrected at the voxel level, P < 0.05 cluster corrected). Right: Brain regions in which healthy controls showed a greater linear increase in brain activation with linearly increasing WM load during the delay period compared with ADHD adults. Results of the 2nd level between‐group analysis, P < 0.005 (uncorrected).
Figure 3.
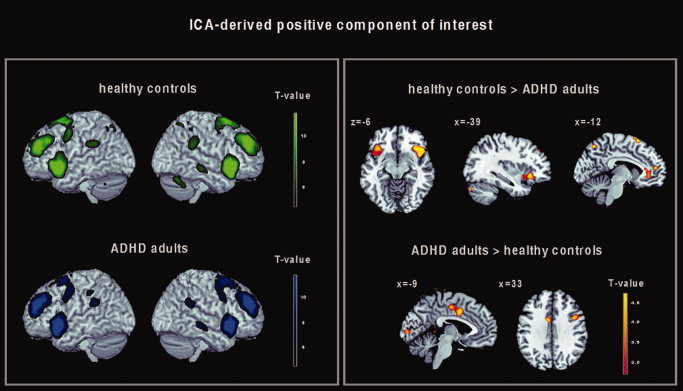
Left: ICA‐derived spatial pattern of a component‐of‐interest (COI) which was positively correlated with the prefrontocerebellar mask derived from the parametric GLM analysis and with the delay regressor of the fMRI task design matrix in healthy controls (green) and ADHD adults (blue). Results of the 2nd level within‐group analysis, P < 0.001 (uncorrected at the voxel level, P < 0.05 cluster corrected). Right: Brain regions within the ICA‐derived positive delay‐related COI showing significant differences in functional connectivity between healthy controls and ADHD adults. Results of the 2nd level between‐group analysis, P < 0.05 FDR corrected.
RESULTS
Behavioral Results
Neuropsychological results (Table II)
Table II.
Results of the neuropsychological assessment (two sample t test, P < 0.05)
| Test | Healthy controls (n = 12) | ADHD adults (n = 12) | Analysis | |||
|---|---|---|---|---|---|---|
| Mean | SD | Mean | SD | T value | uncorr. P value | |
| DS‐f | 9.9 | 1.5 | 8.3 | 1.2 | 2.98 | 0.007a |
| DS‐b | 8.1 | 2.0 | 6.3 | 2.0 | 2.12 | 0.045a |
| SS‐f | 7.1 | 1.4 | 8.1 | 1.2 | −1.87 | 0.075 |
| SS‐b | 6.3 | 1.3 | 6.5 | 2.2 | −0.34 | 0.737 |
| WCST‐P | 0.8 | 1.0 | 1.3 | 2.0 | −1.30 | 0.208 |
| WCST‐sc | 2.0 s | 1.3 | 1.4 s | 1.4 | 1.01 | 0.321 |
| Stroop‐RT | 106.9 ms | 61.5 | 105.9 ms | 100.1 | 0.03 | 0.977 |
| Stroop‐err | 0.8 | 1.2 | 1.3 | 2.1 | −0.84 | 0.407 |
DS‐f, digit span, forward condition; DS‐b, digit span, backward condition; SS‐f, spatial span, forward condition; SS‐b, spatial span, backward condition; WCST‐P, number of perseverative errors; WCST‐sc, switch costs; Stroop‐RT, Stroop‐effect, reaction time; Stroop‐Err, Stroop‐effect, number of errors. See also Neuropsychological results and Neuropsychological tests sections for a detailed description of the cognitive tasks, the statistical analysis and significance levels.
This difference did not survive the Bonferroni correction for multiple comparisons (P < 0.0064).
Compared with healthy controls, ADHD patients' task performance was worse during the digit span (both forward and backward testing; P < 0.05, uncorrected). However, this difference did not survive the Bonferroni correction for multiple comparisons (P < 0.0064). No significant differences were found for variables measuring spatial WM, executive function and behavioral inhibition.
Task Performance During fMRI (Table III)
Table III.
Task performance (means and SD) of healthy subjects and ADHD adults
| Task condition | Healthy controls (n = 12) | ADHD adults (n = 12) | ||||||
|---|---|---|---|---|---|---|---|---|
| Reaction time | Accuracy | Reaction time | Accuracy | |||||
| Mean | SD | Mean | SD | Mean | SD | Mean | SD | |
| Control condition | 521.8 | 166.5 | 100.0 | 0.0 | 437.8 | 133.0 | 98.8 | 4.1 |
| Load level 1 | 706.4 | 143.8 | 97.6 | 3.2 | 675.4 | 142.9 | 95.6 | 3.2 |
| Load level 2 | 820.5 | 154.3 | 91.7 | 5.8 | 852.1 | 148.6 | 88.9 | 7.1 |
| Load level 3 | 965.5 | 239.9 | 90.1 | 8.7 | 1004.1 | 184.4 | 87.3 | 11.7 |
The reaction time (RT) of correctly performed trials is given in ms; task accuracy is given in percent of correct answers.
In both groups, we found increasing reaction times (RTs) with increasing WM load (F (3, 66) = 150.01, P = 0.0001). A significant group effect was not found (F (1, 22) = 0.334, P = 0.857). There was no significant group‐by‐load interaction (F (3, 66) = 2.701, P = 0.053).
For accuracy measures, we observed a significant linear decline with increasing WM load in both groups (F (3, 66) = 19.594, P = 0.0001). A significant group effect was not found (F (1, 22) = 1.583, P = 0.222). There was no group‐by‐load interaction (F (3, 66) = 0.109, P = 0.955). Directed t tests for RT and accuracy did not show any significant differences at any WM load level at the chosen significance threshold of P < 0.05.
Functional Imaging Results
GLM analysis: Parametric effects of WM load within‐group
Encoding period
In healthy controls, linearly increasing activation with increasing stimulus load (1–3 highlighted stimuli) was found in the left VLPFC (inferior frontal gyrus, BA 47), the right middle frontal gyrus (BA 11), the right insula, the left middle temporal gyrus (BA 21), the left superior frontal gyrus (BA 9), the left dorsal cingulate cortex, and the bilateral inferior parietal lobule (BA 40). A similar parametric activation pattern was found in ADHD adults; see also Supporting Information Figure S1a.
Delay period
Both groups showed a linearly increasing activation pattern with increasing WM processing in bilateral brain regions including the VLPFC (BA 44, 45, 47), the dorsolateral prefrontal cortex (DLPFC; BA 9, 46, 10), the cingulate gyrus (BA 24/32, 31), the premotor cortex, the supplementary motor area, the insula, the superior and inferior parietal lobule (BA 7 and 40), the precuneus, the middle and inferior temporal gyrus (BA 21 and 22), the middle occipital gyrus (BA 18, 19), the fusiform gyrus, the striatum (putamen and caudate), the thalamus, the cerebellum and the brainstem; Figure 2 (left), see Supporting Information Table SI for detailed stereotaxic coordinates and Z‐scores.
Probe period
In healthy controls, linearly increasing activation with increasing retrieval load was found in the bilateral middle frontal gyrus (BA 9), the right inferior frontal gyrus (BA 44), and the bilateral inferior parietal lobule. ADHD adults showed a parametric increase in activation in the right inferior frontal gyrus (BA 9), the right superior frontal gyrus (BA 8), and the left superior parietal lobule (BA 7); see also Supporting Information Figure S1b.
GLM analysis: Between‐group comparisons
Encoding and probe period
No significant results were found when computing the contrasts (controls > patients) and vice versa (P < 0.005).
Delay period
Compared with healthy controls, ADHD adults showed lower activation of the left VLPFC (inferior frontal gyrus, BA 47), the right insula, the right middle occipital gyrus (BA 18), the right medial frontal gyrus (BA 6), and the right cerebellum; Figure 2 (right), see also Table IV for detailed stereotaxic coordinates and Z‐scores. The contrast (patients > controls) did not yield any activation differences.
Table IV.
Brain regions in which healthy controls showed a greater parametric activation response with increasing WM load during the delay period compared with ADHD adults
| Anatomical Region | x | y | z | Z | No. of activated voxels | |
|---|---|---|---|---|---|---|
| Healthy controls > ADHD adults | Left inferior frontal gyrus (BA 47) | −39 | 24 | −3 | 3.23 | 64 |
| Right insula | 39 | 12 | 6 | 3.73 | 59 | |
| Right middle occipital gyrus (BA 18) | 18 | −96 | 6 | 3.70 | 46 | |
| Right medial frontal gyrus (BA 6) | 9 | 3 | 60 | 3.51 | 110 | |
| Right cerebellum | 36 | −63 | −30 | 3.24 | 67 |
Results of the 2nd level between‐group analysis, P < 0.005 (uncorrected).
ICA: Within‐group effects
In both healthy controls and ADHD adults, one COI was identified that showed the greatest positive spatial correlation with the prefrontocerebellar mask derived from the GLM between‐group analysis (r = 0.287). The timecourse of this COI also showed a positive temporal correlation with the delay regressor of the task design matrix (r = 0.356). The COI revealed a pattern of functional connectivity comprising the bilateral VLPFC (bilateral inferior frontal gyrus 47 and left BA 44), the DLPFC (superior and middle frontal gyrus, BA 9), the frontopolar cortex (middle frontal gyrus, BA 10), the cingulate cortex (BA 24 and 32), the superior frontal cortex (BA 6 and 8), the inferior parietal lobule (BA 40), the precuneus, the striatum (putamen and caudate), the right thalamus and the right middle temporal gyrus (BA 21). Activation of the superior parietal lobule (BA 7) and the cerebellum was found in healthy controls only; Figure 3 (left), see Supporting Information Table SII for detailed stereotaxic coordinates and Z‐scores.
ICA: Between‐group comparisons
Compared with healthy controls, ADHD adults showed lower connectivity of the bilateral VLPFC (inferior frontal gyrus, BA 47), the left anterior cingulate cortex (BA 32), the superior medial frontal gyrus (BA 10), the bilateral superior frontal gyrus (BA 6), the bilateral superior parietal lobule (BA 7), and the bilateral cerebellum. Compared with healthy controls, ADHD adults showed a higher degree of functional connectivity of the left dorsal cingulate cortex (BA 24), the right inferior frontal gyrus (BA 44), the right superior frontal gyrus (BA 6), and the left cuneus (BA 17); Figure 3 (right), see also Table V for detailed stereotaxic coordinates and Z‐scores.
Table V.
Brain regions showing significant differences in functional connectivity between healthy controls and ADHD adults
| Anatomical region | x | y | z | Z | No. of activated voxels | |
|---|---|---|---|---|---|---|
| Healthy controls > ADHD adults | Left inferior frontal gyrus (BA 47) | −39 | 24 | −6 | 5.02 | 90 |
| Right inferior frontal gyrus (BA 47) | 39 | 24 | −6 | 4.25 | 226 | |
| Left anterior cingulate (BA 32) | −9 | 36 | −6 | 3.07 | 50 | |
| Medial frontal gyrus (BA 10) | 0 | 51 | 12 | 4.29 | 65 | |
| Left superior frontal gyrus (BA 6) | −3 | 18 | 66 | 4.05 | 80 | |
| Right superior frontal gyrus (BA 6) | 6 | 27 | 66 | 3.43 | 80 | |
| Left superior parietal lobule (BA 7) | −12 | −69 | 54 | 3.90 | 243 | |
| Right superior parietal lobule (BA 7) | 12 | −57 | 60 | 5.13 | 243 | |
| Left cerebellum | −39 | −81 | −30 | 4.51 | 29 | |
| Right cerebellum | 6 | −57 | −39 | 5.34 | 179 | |
| ADHD adults > healthy controls | Left dorsal cingulate (BA 24) | −9 | 3 | 39 | 5.27 | 116 |
| Right inferior frontal gyrus (BA 44) | 39 | 6 | 33 | 4.59 | 27 | |
| Right superior frontal gyrus (BA 6) | 27 | 15 | 60 | 4.80 | 53 | |
| Left cuneus (BA 17) | −6 | −93 | 3 | 3.87 | 39 |
Results of the 2nd level between‐group analysis, P < 0.05 FDR corrected. x, y, and z are Talairach coordinates of the most significant center of activation within an activated cluster. Z, Z‐value; BA, Brodmann Area.
Correlation of brain function with ADHD symptoms and task accuracy
A negative correlation between brain function and ADHD symptoms, as rated by the WURS was found in the right cerebellum (x = 6, y = −57, z = −39; r = −0.71, P < 0.05, uncorrected). No significant correlations between regional brain activation, functional connectivity measures, and ADHD psychopathology were found when correlating the ASRS, BIS, and WURS scores with the VLPFC, the superior frontal and parietal cortex, the insula and the anterior cingulate cortex.
A positive correlation between task performance and brain function in the ADHD group was found between task accuracy at load level 3 and functional connectivity indices in the right inferior frontal gyrus (BA 44, x = 39, y = 6, z = 33; r = 0.66, P < 0.05, uncorrected) only.
DISCUSSION
In this study, we used fMRI and a parametric WM activation paradigm to investigate both regional changes in brain activation and functional connectivity differences in brain networks underlying WM processing in adults with ADHD. Our data revealed three main findings: first, although behavioral performance did not significantly differ between healthy controls and ADHD adults, the latter showed lower parametrically modulated activation in distinct cortical and subcortical areas compared with healthy subjects. Regional activation differences were confined to the delay period of the activation task and were not detected during the encoding or during the probe phase. As predicted, lower activation in ADHD adults was found in the left VLPFC (BA 47) and the right cerebellum. Second, connectivity abnormalities were detected by means of ICA within a functionally related network comprising bilateral ventro‐ and dorsolateral prefrontal regions, the anterior cingulate cortex, the bilateral parietal cortex, and the cerebellum. Specifically, ADHD adults showed a decreased functional connectivity pattern in cortical and subcortical network nodes comprising the bilateral VLPFC (BA 47), the left anterior cingulate cortex (BA 32), the bilateral superior parietal lobule (left BA 7), and the bilateral cerebellum compared with healthy subjects. Third, within the same functional network, ADHD adults exhibited a pattern of increased connectivity in the right inferior frontal gyrus (BA 44), the left dorsal cingulate cortex (BA 24), the right superior frontal gyrus (BA 6), and the left cuneus (BA 17).
Our functional imaging findings are consistent with the hypothesis of prefronto‐parietal, anterior cingulate, and cerebellar dysfunction in ADHD [Bush et al., 2005; Castellanos and Tannock, 2002; Dickstein et al., 2006; Faraone and Biederman, 1998; Valera et al., 2005] suggesting both regional and functional connectivity deficits in multimodal cortical and subcortical regions associated with WM processing, inhibitory control and attention. In particular, parametrically modulated regional brain activation changes were found in the left VLPFC (BA 47) and the right cerebellum during the delay period of the cognitive activation task, where manipulation and maintenance of stimuli were required. In contrast, no regional changes in brain activation were observed during the stimulus and probe period, in accordance with the notion of impaired verbal storage and executive processes in ADHD patients during WM processing [Martinussen et al., 2005]. Evidence from functional neuroimaging studies of memory processes in humans have suggested that the implementation of an intended act or plan to recall or remember a specific stimulus set may be the lowest common denominator of VLPFC activation [Courtney et al., 1997; Henson et al., 1999; Owen, 2000]. Consistent with this notion, VLPFC activation in healthy subjects has been demonstrated to occur during tasks that require the active comparison of stimuli held in both WM and long‐term memory [Owen et al., 2005; Petrides, 1994; Wolf et al., 2006], stimulus selection [Rushworth et al., 1997], and holding online of both spatial and nonspatial information [Goldman‐Rakic, 1990, 1996].
The finding of lower cerebellar activation during the delay period in ADHD adults, as in our study, is consistent with functional neuroimaging findings in the child and adolescent literature [Bush et al., 2005; Faraone and Biederman, 1998]. In addition, a recent fMRI study investigating verbal WM in adults with ADHD reported decreased activity in cerebellar regions as one of its major findings [Valera et al., 2005]. Furthermore, regional activation changes in both the VLPFC and the cerebellum have been linked to familial vulnerability to ADHD [Durston et al., 2006; Mulder et al., 2008]. Cerebellar contributions to cognition have been linked to the representation of precise temporal relationships and timing processes during sensory anticipation [Castellanos and Tannock, 2002], and the role of the cerebellum during WM has been increasingly recognized [Owen et al., 2005]. In conjunction with previous findings in healthy controls and ADHD patients, the regional activation abnormalities in ADHD adults, as shown by our GLM‐based approach, suggest that with increasing demand on manipulation of verbal stimuli during the delay period, impaired ventrolateral prefrontal and cerebellar regions in ADHD might be particularly sensitive to cognitive load. Thus, lower prefrontocerebellar activation in ADHD adults could mirror deficient processes of stimulus monitoring and timing as well as deficits during comparison of “to be manipulated” stimuli representing transiently relevant information (i.e. verbal stimuli presented prior to manipulation during the delay period). Although we cannot exclude the possibility of impaired encoding and retrieval processes in ADHD adults, the regionally abnormal pattern of brain activation during the delay phase at least suggests that abnormal activation in ADHD during WM processing is related to cognitive subprocesses required during the delay period to a greater extent than during the other two dissociable phases.
In addition to regional activation abnormalities, ADHD adults showed a pattern of lower functional connectivity in the bilateral VLPFC (BA 47), the left anterior cingulate cortex (BA 32), the bilateral superior parietal lobule (left BA 7), and the bilateral cerebellum compared with healthy subjects. These results complement the GLM‐based findings of lower activation found in the left VLPFC and the right cerebellum by showing that connectivity abnormalities in ADHD involve more widespread lateral and medial prefrontal, parietal and cerebellar regions, which are not evident using a GLM‐based approach only. There is abundant evidence from functional neuroimaging studies suggesting that inhibitory control is associated with an activation pattern including the VLPFC, the anterior cingulate and the parietal cortex, e.g. [Durston et al., 2002, 2006; Konishi et al., 1999; Smith et al., 2006], and that these functionally heterogeneous regions also subserve WM processes [Owen et al., 2005; Wolf and Walter, 2005]. Moreover, previous studies in children and adults with ADHD have reported abnormal activation of the VLPFC and the anterior cingulate cortex during response inhibition [Bush et al., 1999; Durston et al., 2006] and WM [Schweitzer et al., 2000], as well as hypoactivation of the parietal cortex associated with task switching [Smith et al., 2006]. Indeed, inferior frontal and cingulate cortex hypoactivity in ADHD patients has been shown to be a robust finding considering the extant functional neuroimaging literature [Dickstein et al., 2006]. Our ICA‐derived results support the notion of aberrant ventrolateral prefrontal, cingulate, parietal, and cerebellar connectivity in ADHD [Castellanos and Tannock, 2002; Dickstein et al., 2006; Valera et al., 2005], and provide evidence for a common pathophysiologic mechanism underlying commonly observed deficits in cognitive and inhibitory control in ADHD patients. Specifically, we hypothesize that within a neural network subserving WM, attention and inhibition processes, distinct network nodes might be differentially affected with regard to the requirements of a given cognitive activation task, e.g., during WM or behavioral inhibition. Indeed, a common neural mechanism for both WM and response inhibition deficits in ADHD adults has been suggested previously given common behavioral deficits during WM and inhibition processes in ADHD adults and patients with damage to the right inferior prefrontal cortex [Clark et al., 2007]. Our functional connectivity results support this notion by showing that in addition to regional activation abnormalities in the left VLPFC, a functional decoupling of right hemisphere VLPFC regions is also present during WM processing. However, given methodological limitations inherent to an ICA approach, we cannot parse out the relative contribution of the right VLPFC, the anterior cingulate, the bilateral parietal cortex and the cerebellum to distinct cognitive subprocesses during WM. Although the pattern of functional connectivity was positively correlated with the delay period, differential contributions of these brain areas could be also linked to several task‐inherent processes other than WM, e.g., to the allocation of attentional resources or to monitoring processes.
Of note, ADHD adults also exhibited a pattern of increased connectivity in the right inferior frontal gyrus (BA 44), the left dorsal cingulate (BA 24), the right superior frontal gyrus (BA 6), and the left cuneus (BA 17). The possibility that neural reorganization or other compensatory mechanisms could compensate for regions deficient during manipulation and maintenance of memoranda in patients with ADHD has been previously discussed against the background of observations of increased cortical activation [Bush et al., 1999, 2005; Epstein et al., 2007; Hale et al., 2007; Schweitzer et al., 2000; Sheridan et al., 2007]. Although less robust and consistent compared with findings of functional hypoactivation in patients with ADHD, currently available neuroimaging studies of cognitive function in ADHD provide accumulating evidence for the notion that neural dysfunction in general in ADHD patients might be characterized by both decreased and increased activation [Dickstein et al., 2006]. For instance, it has been suggested that individuals with ADHD may be less able to recruit networks engaged in executive processing in order to fulfill the requirements of the increasing task demand [Fassbender and Schweitzer, 2006; Sheridan et al., 2007], i.e. show a less efficient prefrontal function [Sheridan et al., 2007]. Alternatively, the possibility of abnormally increased activation that interferes with brain activation typically elicited by a given task has been proposed [Dickstein et al., 2006]. It has been hypothesized that increased activation in ADHD could relate to compensatory brain and behavioral function due to increased cognitive effort [Fassbender and Schweitzer, 2006; Sheridan et al., 2007] or due to symptom remission [Schulz et al., 2005].
Given our findings of increased functional connectivity in the inferior frontal and the dorsal cingulate cortex, a compensatory recruitment of these regions during WM processing seems one plausible explanation. Indeed, measures of task accuracy were positively correlated with indices of functional connectivity strength in the right inferior frontal cortex (BA 44), at least suggesting a relationship between increasing connectivity in this brain region and task performance. However, inferior frontal and cingulate regions have also been associated with attentional processes within the so called “default‐mode” network [Raichle et al., 2001; Weissman et al., 2006]. Recently, a decoupling between the anterior cingulate and the precuneus/posterior cingulate cortex during the brain's resting state has been proposed as a new candidate locus of dysfunction in ADHD adults [Castellanos et al., 2008], complementing a prior report showing aberrant resting‐state connectivity in the dorsal cingulate cortex in ADHD patients [Tian et al., 2006]. However, since both increased [Tian et al., 2006, 2008] and decreased [Castellanos et al., 2008; Uddin et al., 2008] resting‐state connectivity of posterior cortical regions has been reported in ADHD patients, it is unclear if a pattern of task‐related increased connectivity as shown in this study actually reflects compensatory activation related to cognitive demand or increased baseline activity. Thus, although our study may suggest performance‐related compensatory cortical processes in ADHD adults, the issue of functional hyperactivation in ADHD clearly necessitates further research.
It is important to note that the between‐group activation differences found in this study are unlikely to be a secondary effect of academic achievement, IQ, or impaired cognitive performance. The ADHD adults included in this study did not differ from healthy controls with regard to IQ, years of education, and behavioral performance during a broad range of cognitive domains, indicating well‐preserved cognitive function and academic achievement similar to healthy controls as demonstrated by the fact that verbal and spatial WM, card sorting, and inhibition during the Stroop task were not significantly impaired in the patient group compared with healthy controls. With regard to task performance during fMRI, ADHD adults did not significantly differ from healthy controls with respect to both RT and accuracy at higher WM load levels, in accordance with previous behavioral findings in adult ADHD patients during verbal WM performance [Hale et al., 2007; Valera et al., 2005]. Eventually, as we included only correctly performed trials in the functional analyses based on the GLM, we sought to minimize the potentially relevant activation bias resulting from decreased task accuracy in both groups. In addition, although IQ measures did not significantly differ between ADHD patients and healthy controls (P < 0.31), all 2nd level analyses were nevertheless recalculated including the individual IQ values as a nuisance variable. These analyses did not significantly alter the functional results on both the regional and on the functional connectivity level, being in line with the notion that WM impairment in ADHD is not sufficiently explained by differences in overall intellectual ability [Martinussen et al., 2005; Willcutt et al., 2005]. However, the behavioral results are potentially limited by the relatively small sample size included in this study and by the fact that the patient group consisted of highly motivated ADHD patients, who received monetary compensation for their participation in this project. As such, we cannot rule out a motivational bias which may have additionally contributed to negative group effects in cognitive performance.
Although the functional data are consistent with the notion of a disrupted circuitry involving the ventrolateral prefrontal cortex, the anterior cingulate, the parietal cortex, and the cerebellum in ADHD patients [Dickstein et al., 2006; Valera et al., 2005], the functional results derived from this study are nevertheless limited by the relatively small sample size (n = 12), and, thus, have to be replicated in a larger patient cohort. Moreover, all ADHD patients included in this study had a history of MPH medication. WM dysfunction in both children and adolescents with ADHD is remediated by MPH treatment [Kempton et al., 1999; Mehta et al., 2004], and the administration of MPH in ADHD patients has been shown to be associated with increased activation in fronto‐striatal and cerebellar regions [Epstein et al., 2007; Vaidya et al., 1998]. However, a substantial proportion of our main findings, namely regional activation abnormalities of ventrolateral prefrontal and cerebellar areas and aberrant connectivity of the bilateral VLPFC, the anterior cingulate, the parietal cortex, and the cerebellum in ADHD adults indicate corticosubcortical hypoactivation in patients compared with healthy controls, consistent with models of hypofrontality in ADHD [Dickstein et al., 2006]. Moreover, a recent statistically based metaanalysis of functional neuroimaging studies in ADHD failed to support the notion that functional activation changes in this patient population reflect the impact of psychotropic medication as opposed to ADHD pathology [Dickstein et al., 2006]. Nevertheless, although all patients investigated in this study were removed from medication at least three days prior to scanning, the long‐term effects of medication on brain function are not yet well known [Langleben et al., 2002], and may have had an impact on cerebral activation and connectivity differences observed in the ADHD group. Thus, the results of this study should be cautiously interpreted from this perspective. Another potential limitation of this study is that although patients with manifest subjective reading disability were excluded from participation, reading disability was not formally tested in the patient group. However, we sought to exclude manifest reading disability in the patient sample not only by assessing subjective complaints but also by obtaining independent information from parents, relatives, and school reports and thus additionally minimizing potential inclusion bias. Furthermore, verbal WM performance in children and adolescents with ADHD has been shown to be independent of comorbidity with language learning disorders [Martinussen et al., 2005], whereas the impact of comorbid language learning disorders on WM performance and WM‐related brain function in ADHD adults is yet not clear [Samuelsson et al., 2004] and merits further investigation.
Keeping these limitations in mind, this study suggests both regional brain activation deficits and functional connectivity changes of ventrolateral prefrontal and cerebellar regions in ADHD adults during cognitive processing. Moreover, functional connectivity analyses provide preliminary evidence for a disrupted corticosubcortical network including ventrolateral prefrontal, anterior cingulate, parietal, and cerebellar regions in ADHD adults, supporting the notion of a common aberrant network for attention, inhibitory control, and WM dysfunction. Further research will be conducted in a larger patient population in order to investigate the association of clinically and genetically characterized ADHD subtypes with these patterns of regional brain dysfunction and disrupted prefrontal connectivity.
Supporting information
Additional Supporting Information may be found in the online version of this article.
Supporting Information Table 1. Brain regions in which healthy controls and ADHD patients showed a linear increase in brain activation with linearly increasing WM load during the delay period. Results of the second level within‐group analysis, P < 0.001 (;uncorrected at the voxel level, P < 0.05 cluster corrected). X, y, and z are Talairach coordinates of the most significant center of activation within an activated cluster or an anatomically dissociable subcluster. Z, Z‐value; BA, Brodmann Area.
Supporting Information Table 2. ICA‐derived functional connectivity pattern in healthy controls and ADHD patients. Results of the second level within‐group analysis, P < 0.05 cluster corrected. X, y, and z are Talairach coordinates of the most significant center within an activated cluster. Z = Z‐value; BA = Brodmann Area.
Supporting Information Figure 1. Brain regions in which healthy controls (;green) and ADHD adults (;blue) showed a linearly increasing response in cerebral activation during the stimulus (;left) and the probe (;right) period. Results of the second level within‐group analysis, P < 0.001 (;uncorrected at the voxel level, P < 0.05 cluster corrected).
Acknowledgements
The authors would like to thank Alexander Lin, California Institute of Technology, Pasadena, CA, for insightful comments on a previous version of this manuscript.
REFERENCES
- Arnsten AF,Li B ( 2005): Neurobiology of executive functions: Catecholamine influences on prefrontal cortical functions. Biol Psychiatry 57: 1377–1384. [DOI] [PubMed] [Google Scholar]
- Baddeley A ( 2003): Working memory: Looking back and looking forward. Nat Rev Neurosci 4: 829–839. [DOI] [PubMed] [Google Scholar]
- Barkley R ( 1997): Behavioral inhibition, sustained attention, and executive functions: Constructing a unifying theory of ADHD. Psychol Bull 1221: 65–94. [DOI] [PubMed] [Google Scholar]
- Brett M,Anton J‐L,Valabregue R,Poline JB ( 2002): Region of interest analysis using an SPM toolbox (abstract),Vol. 16, No. 2. Sendai, Japan. Available on CD‐ROM in NeuroImage. [Google Scholar]
- Bush G,Frazier JA,Rauch SL,Seidman LJ,Whalen PJ,Jenike MA,Rosen BR,Biederman J ( 1999): Anterior cingulate cortex dysfunction in attention‐deficit/hyperactivity disorder revealed by fMRI and the Counting Stroop. Biol Psychiatry 45: 1542–1552. [DOI] [PubMed] [Google Scholar]
- Bush G,Valera EM,Seidman LJ ( 2005): Functional neuroimaging of attention‐deficit/hyperactivity disorder: A review and suggested future directions. Biol Psychiatry 57: 1273–1284. [DOI] [PubMed] [Google Scholar]
- Calhoun VD,Adali T,Pearlson GD,Pekar JJ ( 2001): A method for making group inferences from functional MRI data using independent component analysis. Hum Brain Mapp 14: 140–151. [DOI] [PMC free article] [PubMed] [Google Scholar]
- Calhoun VD,Adali T,Pekar JJ ( 2004): A method for comparing group fMRI data using independent component analysis: Application to visual, motor and visuomotor tasks. Magn Reson Imag 22: 1181–1191. [DOI] [PubMed] [Google Scholar]
- Castellanos FX,Tannock R ( 2002): Neuroscience of attention‐ deficit/hyperactivity disorder: The search for endophenotypes. Nat Rev Neurosci 3: 617–628. [DOI] [PubMed] [Google Scholar]
- Castellanos FX,Margulies DS,Kelly C,Uddin LQ,Ghaffari M,Kirsch A,Shaw D,Shehzad Z,Di Martino A,Biswal B,Sonuga‐Barke EJ,Rotrosen J,Adler LA,Milham MP ( 2008): Cingulate‐precuneus interactions: A new locus of dysfunction in adult attention‐deficit/hyperactivity disorder. Biol Psychiatry 63: 332–337. [DOI] [PMC free article] [PubMed] [Google Scholar]
- Celone KA,Calhoun VD,Dickerson BC,Atri A,Chua EF,Miller SL,DePeau K,Rentz DM,Selkoe DJ,Blacker D,Albert MS,Sperling RA ( 2006): Alterations in memory networks in mild cognitive impairment and Alzheimer's disease: An independent component analysis. J Neurosci 26: 10222–10231. [DOI] [PMC free article] [PubMed] [Google Scholar]
- Clark L,Blackwell AD,Aron AR,Turner DC,Dowson J,Robbins TW,Sahakian BJ ( 2007): Association between response inhibition and working memory in adult ADHD: A link to right frontal cortex pathology? Biol Psychiatry 61: 1395–1401. [DOI] [PubMed] [Google Scholar]
- Correa N,Adali T,Yi‐Ou L,Calhoun VD ( 2005): Comparison of blind source separation algorithms for FMRI using a new Matlab toolbox: GIFT. Proc IEEE Int Conf Acoustics Speech Signal Process 5: 401–404. [Google Scholar]
- Courtney SM,Ungerleider LG,Keil K,Haxby JV ( 1997): Transient and sustained activity in a distributed neural system for human working memory (see comments). Nature 386: 608–611. [DOI] [PubMed] [Google Scholar]
- D'Esposito M,Postle BR,Rypma B ( 2000): Prefrontal cortical contributions to working memory: Evidence from event‐related fMRI studies. Exp Brain Res 133: 3–11. [DOI] [PubMed] [Google Scholar]
- Dickstein SG,Bannon K,Castellanos FX,Milham MP ( 2006): The neural correlates of attention deficit hyperactivity disorder: An ALE meta‐analysis. J Child Psychol Psychiatry 47: 1051–1062. [DOI] [PubMed] [Google Scholar]
- Dowson JH,McLean A,Bazanis E,Toone B,Young S,Robbins TW,Sahakian BJ ( 2004): Impaired spatial working memory in adults with attention deficit/hyperactiviyt disorder: Comparisons with performance in adults with borderline personality disorder and in control subjects. Acta Psychiatr Scand 110: 45–54. [DOI] [PubMed] [Google Scholar]
- Durston S,Thomas KM,Worden MS,Yang Y,Casey BJ ( 2002): The effect of preceding context on inhibition: An event‐related fMRI study. Neuroimage 16: 449–453. [DOI] [PubMed] [Google Scholar]
- Durston S,Mulder M,Casey BJ,Ziermans T,van Engeland H ( 2006): Activation in ventral prefrontal cortex is sensitive to genetic vulnerability for attention‐deficit hyperactivity disorder. Biol Psychiatry 60: 1062–1070. [DOI] [PubMed] [Google Scholar]
- Duvernoy HM ( 1999). The Human Brain. Wien, New York: Springer. [Google Scholar]
- Epstein JN,Casey BJ,Tonev ST,Davidson MC,Reiss AL,Garrett A,Hinshaw SP,Greenhill LL,Glover G,Shafritz KM,Vitolo A,Kotler LA,Jarrett MA,Spicer J ( 2007): ADHD‐ and medication‐related brain activation effects in concordantly affected parent‐child dyads with ADHD. J Child Psychol Psychiatry 48: 899–913. [DOI] [PubMed] [Google Scholar]
- Esposito F,Bertolino A,Scarabino T,Latorre V,Blasi G,Popolizio T,Tedeschi G,Cirillo S,Goebel R,Di Salle F ( 2006): Independent component model of the default‐mode brain function: Assessing the impact of active thinking. Brain Res Bull 70: 263–269. [DOI] [PubMed] [Google Scholar]
- Faraone SV,Biederman J ( 1998): Neurobiology of attention‐deficit hyperactivity disorder. Biol Psychiatry 44: 951–958. [DOI] [PubMed] [Google Scholar]
- Faraone SV,Biederman J,Spencer T,Wilens T,Seidman LJ,Mick E,Doyle AE ( 2000): Attention deficit hyperactivity disorder in adults: An overview. Biol Psychiatry 48: 9–20. [DOI] [PubMed] [Google Scholar]
- Fassbender C,Schweitzer JB ( 2006): Is there evidence for neural compensation in attention deficit hyperctivity disorder? A review of the functional neuroimaging literature. Clin Psychol Rev 26: 445–465. [DOI] [PMC free article] [PubMed] [Google Scholar]
- Forman SD,Cohen JD,Fitzgerald M,Eddy WF,Mintun MA,Noll DC ( 1995): Improved assessment of significant activation in functional magnetic resonance imaging (fMRI): Use of cluster‐size threshold. Magn Reson Med 33: 636–647. [DOI] [PubMed] [Google Scholar]
- Friston KJ,Holmes A,Worsley KJ,Poline JB,Frith CD,Frackowiak RSJ ( 1995a): Statistical parametric maps in functional imaging: A general linear approach. Hum Brain Mapp 2: 189–210. [Google Scholar]
- Friston KJ,Holmes AP,Poline JB,Grasby PJ,Williams SC,Frackowiak RS,Turner R ( 1995b): Analysis of fMRI time‐series revisited. Neuroimage 2: 45–53. [DOI] [PubMed] [Google Scholar]
- Garrity AG,Pearlson GD,McKiernan K,Lloyd D,Kiehl KA,Calhoun VD ( 2007): Aberrant “default mode” functional connectivity in schizophrenia. Am J Psychiatry 164: 450–457. [DOI] [PubMed] [Google Scholar]
- Genovese CR,Lazar NA,Nichols T ( 2002): Thresholding of statistical maps in functional neuroimaging using the false discovery rate. Neuroimage 15: 870–878. [DOI] [PubMed] [Google Scholar]
- Goldman‐Rakic PS ( 1990): Cellular and circuit basis of working memory in prefrontal cortex of nonhuman primates. Prog Brain Res 85: 325–335; discussion, 335–336. [DOI] [PubMed] [Google Scholar]
- Goldman‐Rakic PS ( 1996): The prefrontal landscape: Implications of functional architecture for understanding human mentation and the central executive. Philos Trans R Soc London B Biol Sci 351: 1445–1453. [DOI] [PubMed] [Google Scholar]
- Gross J,Blocher D,Trott GE,Rosler M ( 1999): Assessment of the attention‐deficit hyperactivity disorder in adults. Nervenarzt 70: 20–25. [DOI] [PubMed] [Google Scholar]
- Hale ST,Bookheimer SY,McGough JJ,Phillips JM,McCracken JT ( 2007): Atypical brain activation during simple and complex levels of processing in adult ADHD. J Atten Disord 11: 125–140. [DOI] [PubMed] [Google Scholar]
- Henson RN,Shallice T,Dolan RJ ( 1999): Right prefrontal cortex and episodic memory retrieval: A functional MRI test of the monitoring hypothesis. Brain 122: 1367–1381. [DOI] [PubMed] [Google Scholar]
- Holmes AP,Friston KJ ( 1998): Generalisability, random effects and population inference. NeuroImage 4: 754. [Google Scholar]
- Horn W ( 1983). Leistungsprüfsystem (LPS). Göttingen: Hogrefe. [Google Scholar]
- Jonides J,Smith EE,Marshuetz C,Koeppe RA,Reuter‐Lorenz PA ( 1998): Inhibition in verbal working memory revealed by brain activation. Proc Natl Acad Sci USA 95: 8410–8413. [DOI] [PMC free article] [PubMed] [Google Scholar]
- Josephs O,Henson RN ( 1999): Event‐related functional magnetic resonance imaging: Modelling, inference and optimization. Philos Trans R Soc Lond B Biol Sci 354: 1215–1228. [DOI] [PMC free article] [PubMed] [Google Scholar]
- Kempton S,Vance A,Maruff P,Luk E,Costin J,Pantelis C ( 1999): Executive function and attention deficit hyperactivity disorder: Stimulant medication and better executive function performance in children. Psychol Med 29: 527–538. [DOI] [PubMed] [Google Scholar]
- Kessler RC,Adler L,Ames M,Demler O, S. F.,Hiripi E ( 2005): The World Health Organization Adult ADHD Self‐Report Scale (ASRS): A short screening scale for use in the general population. Psychol Med 35: 245–256. [DOI] [PubMed] [Google Scholar]
- Konishi S,Nakajima K,Uchida I,Kikyo H,Kameyama M,Miyashita Y ( 1999): Common inhibitory mechanism in human inferior prefrontal cortex revealed by event‐related functional MRI. Brain 122: 981–991. [DOI] [PubMed] [Google Scholar]
- Langleben DD,Acton PD,Austin G,Elman I,Krikorian G,Monterosso JR,Portnoy O,Ridlehuber HW,Strauss HW ( 2002): Effects of methylphenidate discontinuation on cerebral blood flow in prepubescent boys with attention deficit hyperactivity disorder. J Nucl Med 43: 1624–1629. [PubMed] [Google Scholar]
- Li YO,Adali T,Calhoun VD ( 2007): Estimating the number of independent components for functional magnetic resonance imaging data. Hum Brain Mapp 28: 1251–1266. [DOI] [PMC free article] [PubMed] [Google Scholar]
- Lijfijt M,Kenemans JL,Verbaten MN,van Engeland H ( 2005): A meta‐analytic review of stopping performance in attention‐ deficit/hyperactivity disorder: Deficient inhibitory control? J Abnorm Psychol 114: 216–222. [DOI] [PubMed] [Google Scholar]
- Lui M,Tannock R ( 2007): Working memory and inattentive behaviour in a community sample of children. Behav Brain Funct 23: 3–12. [DOI] [PMC free article] [PubMed] [Google Scholar]
- Martinussen R,Hayden J,Hogg‐Johnson S,Tannock R ( 2005): A meta‐analysis of working memory impairments in children with attention‐deficit/hyperactivity disorder. J Am Acad Child Adolesc Psychiatry 44: 377–384. [DOI] [PubMed] [Google Scholar]
- Mehta MA,Goodyer IM,Sahakian BJ ( 2004): Methylphenidate improves working memory and set‐shifting in AD/HD: Relationships to baseline memory capacity. J Child Psychol Psychiatry 45: 293–305. [DOI] [PubMed] [Google Scholar]
- Milner B ( 1971): Inter‐hemispheric differences in the localisation of psychological processes in man. Br Med Bull 27: 272–277. [DOI] [PubMed] [Google Scholar]
- Mulder MJ,Baeyens D,Davidson MC,Casey BJ,van den Ban E,van Engeland H,Durston S ( 2008): Familial vulnerability to ADHD affects activity in the cerebellum in addition to the prefrontal systems. J Am Acad Child Adolesc Psychiatry 47: 68–75. [DOI] [PubMed] [Google Scholar]
- Nelson HE ( 1976): A modified card sorting test sensitive to frontal lobe defects. Cortex 12: 313–324. [DOI] [PubMed] [Google Scholar]
- Oldfield RC ( 1971): The assessment and analysis of handedness: The Edinburgh inventory. Neuropsychologia 9: 97–113. [DOI] [PubMed] [Google Scholar]
- Owen AM ( 2000): The role of the lateral frontal cortex in mnemonic processing: The contribution of functional neuroimaging. Exp Brain Res 133: 33–43. [DOI] [PubMed] [Google Scholar]
- Owen AM,McMillan KM,Laird AR,Bullmore E ( 2005): N‐back working memory paradigm: A meta‐analysis of normative functional neuroimaging studies. Hum Brain Mapp 25: 46–59. [DOI] [PMC free article] [PubMed] [Google Scholar]
- Patton JH,S. SM,Barratt ES ( 1995): Factor structure of the Barratt impulsiveness scale. J Clin Psychol 51: 768–774. [DOI] [PubMed] [Google Scholar]
- Perlstein WM,Carter CS,Barch DM,Baird JW ( 1998): The Stroop task and attention deficits in schizophrenia: A critical evaluation of card and single‐trial Stroop methodologies. Neuropsychology 12: 414–425. [DOI] [PubMed] [Google Scholar]
- Petrides M ( 1994). Frontal lobes and working memory: Evidence from investigations of the effects of cortical excisions in nonhuman primates In: Boller F,Grafman J, editors. Handbook of Neuropsychology. Amsterdam: Elsevier; pp 59–82. [Google Scholar]
- Postle BR,D'Esposito M ( 2000): Evaluating models of the topographical organization of working memory function in frontal cortex with event‐related FMRI. Psychobiology 28: 132–145. [Google Scholar]
- Raichle ME,MacLeod AM,Snyder AZ,Powers WJ,Gusnard DA,Shulman GL ( 2001): A default mode of brain function. Proc Natl Acad Sci USA 98: 676–682. [DOI] [PMC free article] [PubMed] [Google Scholar]
- Reuter M,Kirsch P,Hennig J ( 2006): Inferring candidate genes for attention deficit hyperactivity disorder (ADHD) assessed by the World Health Organization Adult ADHD Self‐Report Scale (ASRS). J Neural Transm 113: 929–938. [DOI] [PubMed] [Google Scholar]
- Rushworth MF,Nixon PD,Eacott MJ,Passingham RE ( 1997): Ventral prefrontal cortex is not essential for working memory. J Neurosci 17: 4829–4838. [DOI] [PMC free article] [PubMed] [Google Scholar]
- Sambataro F,Murty VP,Callicott JH,Tan H‐Y,Das S,Weinberger DR,Mattay VS ( 2008): Age‐related alterations in default mode network: Impact on working memory performance. Neurobiol Aging [Epub ahead of print]. [DOI] [PMC free article] [PubMed] [Google Scholar]
- Samuelsson S,Lundberg I,Herkner B ( 2004): ADHD and reading disability in male adults: Is there a connection? J Learn Disabil 37: 155–168. [DOI] [PubMed] [Google Scholar]
- Schulz KP,Fan J,Tang CY,Newcorn JH,Buchsbaum MS,Cheung AM,Halperin JM ( 2004): Response inhibition in adolescents diagnosed with attention deficit hyperactivity disorder during childhood: An event‐related FMRI study. Am J Psychiatry 161: 1650–1657. [DOI] [PubMed] [Google Scholar]
- Schulz KP,Newcorn JH,Fan J,Tang CY,Halperin JM ( 2005): Brain activation gradients in ventrolateral prefrontal cortex related to persistence of ADHD in adolescent boys. J Am Acad Child Adolesc Psychiatry 44: 47–54. [DOI] [PubMed] [Google Scholar]
- Schweitzer JB,Faber TL,Grafton ST,Tune LE,Hoffman JM,Kilts CD ( 2000): Alterations in the functional anatomy of working memory in adult attention deficit hyperactivity disorder. Am J Psychiatry 157: 278–280. [DOI] [PubMed] [Google Scholar]
- Seidman LJ,Valera EM,Makris N ( 2005): Structural brain imaging of attention‐deficit/hyperactivity disorder. Biol Psychiatry 57: 1263–1272. [DOI] [PubMed] [Google Scholar]
- Seidman LJ,Valera EM,Makris N,Monuteaux MC,Boriel DL,Kelkar K,Kennedy DN,Caviness VS,Bush G,Aleardi M,Faraone SV,Biederman J ( 2006): Dorsolateral prefrontal and anterior cingulate cortex volumetric abnormalities in adults with attention‐deficit/hyperactivity disorder identified by magnetic resonance imaging. Biol Psychiatry 60: 1071–1080. [DOI] [PubMed] [Google Scholar]
- Sheridan MA,Hinshaw S,D'Esposito M ( 2007): Efficiency of the prefrontal cortex during working memory in attention‐deficit/hyperactivity disorder. J Am Acad Child Adolesc Psychiatry 46: 1357–1366. [DOI] [PubMed] [Google Scholar]
- Smith AB,Taylor E,Brammer M,Toone B,Rubia K ( 2006): Task‐specific hypoactivation in prefrontal and temporoparietal brain regions during motor inhibition and task switching in medication‐naive children and adolescents with attention deficit hyperactivity disorder. Am J Psychiatry 163: 1044–1051. [DOI] [PubMed] [Google Scholar]
- Spitzer M,Franke B,Walter H,Buechler J,Wunderlich AP,Schwab M,Kovar K,Hermle L,Gron G ( 2001): Enantio‐selective cognitive and brain activation effects of N‐ethyl‐3,4‐methylenedioxyamphetamine in humans. Neuropharmacology 41: 263–271. [DOI] [PubMed] [Google Scholar]
- Stevens MC,Pearlson GD,Kiehl KA ( 2007): An fMRI auditory oddball study of combined‐subtype attention deficit hyperactivity disorder. Am J Psychiatry 164: 1737–1749. [DOI] [PubMed] [Google Scholar]
- Storey JD,Tibshirani R ( 2003): Statistical significance for genomewide studies. Proc Natl Acad Sci USA 100: 9440–9445. [DOI] [PMC free article] [PubMed] [Google Scholar]
- Talairach J,Tournoux P. 1988. Co‐Planar Stereotaxic Atlas of the Human Brain. New York, NY: Thieme Medical Publishers. [Google Scholar]
- Tauscher J,Kapur S,Verhoeff NP,Hussey DF,Daskalakis ZJ,Tauscher‐Wisniewski S,Wilson AA,Houle S,Kasper S,Zipursky RB ( 2002): Brain serotonin 5‐HT(1A) receptor binding in schizophrenia measured by positron emission tomography and [11C]WAY‐100635. Arch Gen Psychiatry 59: 514–520. [DOI] [PubMed] [Google Scholar]
- Tian L,Jiang T,Liang M,Zang Y,He Y,Sui M,Wang Y ( 2008): Enhanced resting‐state brain activities in ADHD patients: A fMRI study. Brain Dev 30: 342–348. [DOI] [PubMed] [Google Scholar]
- Tian L,Jiang T,Wang Y,Zang Y,He Y,Liang M,Sui M,Cao Q,Hu S,Peng M,Zhuo Y ( 2006): Altered resting‐state functional connectivity patterns of anterior cingulate cortex in adolescents with attention deficit hyperactivity disorder. Neurosci Lett 400: 39–43. [DOI] [PubMed] [Google Scholar]
- Uddin LQ,Clare Kelly AM,Biswal B,Margulies DS,Shezad Z,Shaw D,Ghaffari M,Rotrosen J,Adler LA,Castellanos FX,Milham MP ( 2008): Network homogeneity reveals decreased integrity of default‐mode network in ADHD. J Neurosci Methods 169: 249–254. [DOI] [PubMed] [Google Scholar]
- Vaidya CJ,Austin G,Kirkorian G,Ridlehuber HW,Desmond JE,Glover GH,Gabrieli JD ( 1998): Selective effects of methylphenidate in attention deficit hyperactivity disorder: A functional magnetic resonance study. Proc Natl Acad Sci USA 95: 14494–14499. [DOI] [PMC free article] [PubMed] [Google Scholar]
- Valera EM,Faraone SV,Biederman J,Poldrack R,Seidman LJ ( 2005): Functional neuroanatomy of working memory in adults with attention‐deficit/hyperactivity disorder. Biol Psychiatry 57: 439–447. [DOI] [PubMed] [Google Scholar]
- Vance A,Silk TJ,Casey M,J. RN,Bradshaw JL,A. BM,Cunnington R ( 2007): Right parietal dysfunction in children with attention deficit hyperactivity disorder, combined type: A functional MRI study. Mol Psychiatry 12: 826–832. [DOI] [PubMed] [Google Scholar]
- Ward MF,Wender PH,Reimherr FW ( 1993): The Wender Utah Rating Scale: An aid in the retrospective diagnosis of childhood attention deficit hyperactivity disorder. Am J Psychiatry 150: 885–890. [DOI] [PubMed] [Google Scholar]
- Wechsler D ( 1981). Wechsler Intelligence Scale‐Revised. San Antonio, TX: Psychological Corporation. [Google Scholar]
- Weissman DH,Roberts KC,Visscher KM,Woldorff MG ( 2006): The neural bases of momentary lapses in attention. Nat Neurosci 9: 971–978. [DOI] [PubMed] [Google Scholar]
- Willcutt EG,Doyle AE,Nigg JT,Faraone SV,Pennington BF ( 2005): Validity of the executive function theory of attention‐deficit/hyperactivity disorder: A meta‐analytic review. Biol Psychiatry 57: 1336–1346. [DOI] [PubMed] [Google Scholar]
- Wolf RC,Walter H ( 2005): Evaluation of a novel event‐related parametric fMRI paradigm investigating prefrontal function. Psychiatry Res Neuroimaging 140: 73–83. [DOI] [PubMed] [Google Scholar]
- Wolf RC,Vasic N,Walter H ( 2006): Differential activation of ventrolateral prefrontal cortex during working memory retrieval. Neuropsychologia 44: 2558–2563. [DOI] [PubMed] [Google Scholar]
Associated Data
This section collects any data citations, data availability statements, or supplementary materials included in this article.
Supplementary Materials
Additional Supporting Information may be found in the online version of this article.
Supporting Information Table 1. Brain regions in which healthy controls and ADHD patients showed a linear increase in brain activation with linearly increasing WM load during the delay period. Results of the second level within‐group analysis, P < 0.001 (;uncorrected at the voxel level, P < 0.05 cluster corrected). X, y, and z are Talairach coordinates of the most significant center of activation within an activated cluster or an anatomically dissociable subcluster. Z, Z‐value; BA, Brodmann Area.
Supporting Information Table 2. ICA‐derived functional connectivity pattern in healthy controls and ADHD patients. Results of the second level within‐group analysis, P < 0.05 cluster corrected. X, y, and z are Talairach coordinates of the most significant center within an activated cluster. Z = Z‐value; BA = Brodmann Area.
Supporting Information Figure 1. Brain regions in which healthy controls (;green) and ADHD adults (;blue) showed a linearly increasing response in cerebral activation during the stimulus (;left) and the probe (;right) period. Results of the second level within‐group analysis, P < 0.001 (;uncorrected at the voxel level, P < 0.05 cluster corrected).