

Abstract
EEG correlated functional MRI (EEG‐fMRI) allows the delineation of the areas corresponding to spontaneous brain activity, such as epileptiform spikes or alpha rhythm. A major problem of fMRI analysis in general is that spurious correlations may occur because fMRI signals are not only correlated with the phenomena of interest, but also with physiological processes, like cardiac and respiratory functions. The aim of this study was to reduce the number of falsely detected activated areas by taking the variation in physiological functioning into account in the general linear model (GLM). We used the photoplethysmogram (PPG), since this signal is based on a linear combination of oxy‐ and deoxyhemoglobin in the arterial blood, which is also the basis of fMRI. We derived a regressor from the variation in pulse height (VIPH) of PPG and added this regressor to the GLM. When this regressor was used as predictor it appeared that VIPH explained a large part of the variance of fMRI signals acquired from five epilepsy patients and thirteen healthy volunteers. As a confounder VIPH reduced the number of activated voxels by 30% for the healthy volunteers, when studying the generators of the alpha rhythm. Although for the patients the number of activated voxels either decreased or increased, the identification of the epileptogenic zone was substantially enhanced in one out of five patients, whereas for the other patients the effects were smaller. In conclusion, applying VIPH as a confounder diminishes physiological noise and allows a more reliable interpretation of fMRI results. Hum Brain Mapp, 2010. © 2009 Wiley‐Liss, Inc.
Keywords: EEG‐fMRI, physiological noise, respiration, cardiac activity, epilepsy, alpha rhythm, impulse response function
INTRODUCTION
Functional MRI (fMRI) has become an established method for the localization of human brain activity. fMRI is based on changes in blood oxygenation because of altered local neural activity during an experimental condition relative to a control condition. In most fMRI studies, the experimental condition is defined by a specific task or stimulus paradigm. The main challenge in fMRI studies is to determine those brain regions in which the BOLD signal changes in relation to a particular neuronal event. When studying spontaneous brain activity, changes in neural activity are unpredictable. In these studies, the occurrence of events in the scalp electroencephalogram (EEG) can be used to determine and quantify neural activity relative to a resting condition. Several studies have shown that the coregistration of EEG and fMRI (EEG‐fMRI) is applicable for the identification of the epileptic focus [e.g. Benar et al., 2002; Gotman et al., 2004; Krakow 2008; Salek‐Haddadi et al., 2006; Zijlmans et al., 2007]. From the EEG a reference function is extracted, representing the occurrence of the interictal epileptiform discharges (IED). Through an event‐related approach this regressor is correlated with the fMRI signals in the general linear model (GLM). Apart from its application in epilepsy research, EEG‐fMRI has also proven its value in studies of normal spontaneous neural activity during rest in order to improve our understanding of the brain's resting state [Gonçalves et al., 2007; Laufs et al., 2007; Mantini et al., 2007; Salek‐Haddadi et al., 2003; Schabus et al., 2007], where special interest has been paid to the sources of the alpha band (8–13 Hz) activity [e.g., de Munck et al., 2007; Goldman et al., 2002; Gonçalves et al., 2006; Laufs et al., 2003; Moosmann et al., 2003]. However, it is well known that both fMRI signals and the neural events of interest are correlated with other physiological processes as well, such as cardiac activity and respiration [Windischberger et al., 2002]. The brain pulsates with every heart beat introducing motion of the vessels and cerebrospinal fluid [Glover et al., 2000]. Respiration causes changes in field homogeneity in the brain due to movement of thorax and abdomen during breathing. In addition, respiration affects the oxygenation level and the arterial level of CO2, which is a potent vasodilator [Birn et al., 2006]. If these sources are not taken into account during fMRI analysis, falsely detected activations can be obtained or the detection of neural activity is impeded, especially during abnormal physiological functioning. In the past 15 years several methods for the reduction of artifacts time‐locked to the physiological functions have been developed by e.g. Noll [1994], Glover et al. [2000], Lund et al. [2006], and Shmueli et al. [2007]. Glover et al. [2000] accounted for the instantaneous cardiac and respiratory influences by modeling the physiological noise as a set of sines and cosines representing the phase of the respiratory or cardiac cycle (RETROICOR) used as a preprocessing filter before fMRI regression analysis. Lund et al. [2006] used the same RETROICOR method, but instead of filtering the fMRI signals, the sines and cosines were applied as confounders to the GLM. Recently, it has been shown that not only the phase of the cardiac cycle, but also the heart rate itself [de Munck et al., 2008; Shmueli et al., 2007] as well as heart rate variability [Nadapow et al., 2008] affect the fMRI signals. Additionally, in the study of Birn et al. [2006] the influence of changes in respiratory depth and rate on fMRI analyses was examined, showing that the reduction in false detections is maximal near large vessels. Chang et al. [2009] combined both heart rate and respiratory depth in one model, showing that this combination explained a larger part of the variance of the fMRI signals than one of these aspects alone.
In this study, it is assumed that the BOLD signals are not only the result of local changes in oxy‐ and deoxyhemoglobin in blood of the capillary bed of the brain, which are directly related to changes in neural brain activity [Logothetis et al., 2001], but that part of the variance of the fMRI signals is related to physiological fluctuations. However, the exact mechanism of the physiological processes in relation to the BOLD response is not completely understood yet. It is hypothesized that the photoplethysmogram (PPG) can be used to explain the variation in fMRI signals due to physiological fluctuations, because both PPG and fMRI are based on variations in the ratio of oxy‐ and deoxyhemoglobin in the blood. PPG is measured with an optically based pulse oximeter and its pulsatile component mainly results from changes in light absorption of a linear combination of oxy‐ and deoxyhemoglobin present in the arterial blood at the sensor site [Rusch et al., 1996]. Changes in the peak‐to‐peak amplitude (pulse height) of this signal are related to e.g. changes in cardiac output [Murray et al., 1996] or respiratory variations [Shamir et al., 1999; Shelley, 2007]. For that purpose, we investigated the correlation between the variation in pulse height (VIPH) and fMRI signals. Anticipating on the possibility that the effect of VIPH on fMRI is delayed in time, the effect of VIPH on fMRI was modeled with an impulse response function with unknown coefficients [de Munck et al., 2007].
In this article, the effect of VIPH correction on the interpretation of EEG‐fMRI correlation patterns was explored for the data of patients with lesional epilepsy, for whom an accurate delineation of the epileptogenic zone is of great importance. In addition, the impact of VIPH correction was investigated in an EEG‐fMRI resting‐state fMRI study of healthy volunteers. For that purpose, the EEG‐correlated fMRI data obtained in the study of the generators of the alpha rhythm of de Munck et al. [2007] were re‐examined, but this time with VIPH taken into account. The results of VIPH correction were compared with the use of respiratory RETROICOR regressors modeling the instantaneous effect of breathing [Lund et al., 2006] and RVT regressors [Birn et al., 2006] taking into account variation in respiratory depth and rate. These regressors were combined with the cardiac RETROICOR and heart beat regressors in a single general linear model.
MATERIALS AND METHODS
Subjects
Simultaneous recording of EEG and fMRI was successfully performed for five patients with localization related partial epilepsy who had a mean age of 33 ± 11 years. Each of the patients underwent structural MRI for diagnostic purposes, showing the lesions as listed in Table I. The patients also underwent long‐term video‐EEG monitoring, indicating a neocortical origin of the seizures in each of them. The electroclinical studies confirmed for each patient that their habitual seizures were related to the lesions. All patients were candidates for epilepsy surgery, guided by either pre‐ or intraoperative electrocorticography. The patients were notified that the EEG‐fMRI study was not part of the standard presurgical evaluation and did not influence any of the clinical decisions, such as the surgical resection. The patients were treated at Epilepsy Centre Kempenhaeghe or they were referred via the Dutch collaborative epilepsy surgery program. They were on maintenance doses of their habitual antiepileptic drugs.
Table I.
Summary of patient characteristics and EEG‐fMRI findings for the epilepsy patients
| 1 | 2 | 3 | 4 | 5 | 6 | 7 | 8 | 9 |
|---|---|---|---|---|---|---|---|---|
| Subject | Epileptogenic lesion | # IED | frac | frac | frac | diff | E: O: E | Location max. BOLD |
| 1 | Resection, RF | 12 | 0.384 | 0.048 | 0.072 | +51.7 | 0.37 : 0.63 : 0.00 | RF |
| 2 | Dysplasia, RF | 92 | 0.138 | 0.116 | 0.102 | −11.6 | 0.02 : 0.85 : 0.13 | RF |
| 3 | DNET, RT | 26 | 0.887 | 0.613 | 0.089 | −85.5 | 0.00 : 0.15 : 0.85 | RT |
| 4 | DNET, LT | 15 | 0.729 | 0.001 | 0.002 | +133.4 | 0.60 : 0.41 : 0.00 | RT |
| 5 | Dysplasia, RT | 33 | 0.001 | 0.017 | 0.016 | −5.0 | 0.04 : 0.88 : 0.08 | RT |
The second and third column describe respectively the location of the epileptogenic region and the number of interictal epileptiform discharges (IED) that were identified in the EEG recorded during fMRI scanning. Presented in the fourth till sixth column are the fractions of activated brain voxels resulting from the analysis when VIPH was a predictor (frac), when the IED were correlated to BOLD (frac) and when VIPH was added as confounder (frac) to the GLM. Column 7 shows the difference between the results of the correlation analyses with and without VIPH taken into account. Column 8 depicts the overlapping ratios as specified in Eq. (4). The last column indicates the localization of the maximal BOLD response present in the overlapping area of these two models. DNET, Dysembryoplastic neuroepithelial tumor; RF, right frontal lobe; RT, right temporal lobe; LT, left temporal lobe.
The methods used in this study for VIPH correction of the fMRI were also applied to the EEG‐fMRI data of 16 healthy volunteers who participated in the study of de Munck et al. [2007, 2008]. Four healthy volunteers were excluded from this analysis because of an insufficient quality of the PPG. Both studies had the approval of the Medical Ethics Committee of VU University Medical Center and all subjects gave informed consent for the EEG‐fMRI study.
Data Acquisition
EEG‐fMRI recording was performed at VU University Medical Center and data acquisition was the same for both epilepsy patients and healthy volunteers. All subjects underwent an fMRI session of maximally 40 min for the epilepsy patients and 30 min for the healthy volunteers during which they were instructed to relax with their eyes closed. Functional images were acquired on a 1.5 T MR scanner (Magnetom Sonata, Siemens, Erlangen, Germany) using a T2*‐weighted EPI sequence: TR/TE = 3000/60 ms, in‐plane resolution 3.3 mm × 3.3 mm, number of slices 24 with a slice thickness of 3 mm and a 10% gap. Slices were recorded from bottom to top covering the complete occipital, parietal, temporal, and frontal lobes. In addition to the functional scans a T1‐weighted anatomical scan (MPRAGE, TR/TE = 2700/5 ms, inversion time TI = 950 ms) was made consisting of 160 coronal slices of 1.5 mm thickness. Simultaneously, EEG data were acquired with an MR compatible EEG amplifier (SD MRI 64, MicroMed, Treviso, Italy) and a cap providing 64 Ag/AgCl electrodes positioned according to an extended 10/20 system (sampling rate = 2,048 Hz). Furthermore, physiological functioning of the subjects was recorded using sensors compatible with the MR scanner. Respiration was measured using a belt positioned at the level of the abdomen measuring abdominal expansions during breathing. Cardiac activity was measured with electrocardiography (ECG). Furthermore a pulse oximeter was positioned on one of the subject's fingers in order to record PPG. Both PPG and the respiratory signal were recorded at a sampling rate of 50 Hz, while ECG was sampled at 400 Hz. Most MR scanners apply an auto gain function for a clear display of the heart beat and respiratory cycles during scanning. For our application where variations in pulse height are needed careful attention was paid to ensure that the raw physiological signals were used in the analysis, instead of their “auto gained” versions.
EEG Regressors
EEG data were offline corrected for gradient and ballistocardiographic artifacts according to the methods presented by Gonçalves et al. [2007]. In summary, the gradient artifacts were removed by first estimating the slice time and the dead time before the acquisition of the first slice. These values were used to determine the template of the slice artifact for each EEG‐channel, which was subtracted from the data followed by the subtraction of the average volume artifact. The ballistocardiographic artifacts were removed by first applying a clustering algorithm to the individually detected pulse artifacts in order to group the differences in spatio‐temporal patterns of the artifact. Thereafter, an average template for each cluster was derived which was subtracted from the data as proposed by Allen et al. [1998]. In the EEG after artifact correction, isolated spikes and isolated spike‐and‐wave discharges or interictal epileptiform discharges were identified by an experienced EEG specialist as epileptiform and specific for the epilepsy of the patient under study. For each type of IED a regressor was created which indicated the number of IED present per volume scan. In the group of healthy volunteers, the EEG was used to compute the amount of alpha activity. For each epoch corresponding to a volume a power spectrum was calculated using an FFT algorithm (for details see de Munck et al., 2007]. The power was averaged over a 2‐Hz wide alpha band centered around the subject's alpha peak frequency.
Physiological Regressors
The physiological recordings were aligned with EEG and fMRI data through a marker that was automatically placed in the data files at the onset of each volume. The software of the MR scanner automatically detects the R‐tops in the ECG and the maxima in PPG. These automatic detections were visually inspected and in case of false detections removed, added or realigned using in home written software. From these markers regressors of the first three harmonics of the cardiac phase according to the RETROICOR method [Glover et al. 2000] and heart beat intervals [de Munck et al. 2008] were derived. Furthermore, both the respiratory signal and PPG were analyzed on a beat‐to‐beat basis using period amplitude analysis (PAA) [van Houdt et al., 2007], which divided each signal into the upward and downward components of the signals (Fig. 1a,b). The first and last point of a half wave represent either the start of a beat or the maximum point of a beat. From this information the height of each pulsation in PPG was calculated as the difference between the first and last point of the upward half waves detected in that signal. These values were resampled to one value per volume by taking the average of the amplitudes of the pulsations within that volume resulting in a regressor called VIPH (Fig. 1a). The maxima determined in the respiratory signal (Fig. 1b) were used to derive regressors of the first three harmonics of the respiratory phase as described by Lund et al. [2006]. However, instead of taking the phase at the time of the acquisition of the first slice, we determined the phase at the time of the middle slice. Furthermore, the volume inspired during each breath (V
i) was defined as the difference between the first and the last point of the upward half waves detected in the respiratory signal. The duration of each breath (t
tot) was defined as the difference in time between the start points of two successive upward half waves. As presented in the study of Birn et al. [2006] the respiratory volume per time (RVT) was calculated by dividing V
i through t
tot. These values were interpolated to multiples of TR in order to obtain an RVT regressor (Fig. 1b). Because of occasional clipping of the respiratory signal, respiratory depth could not always be accurately determined. To estimate the amount of distortion of the respiratory signal the relative clipping ratio ( ) and relative clipping duration (
 ) were determined. The number of breaths was determined by the number of upward half waves detected, whereas t
clip is the average duration of all clippings and t
avg is the average breath duration. The influence of clipping was considered to be unacceptable when CR · CT > 100, indicating that either the number of clippings and/or the duration of clipping was relatively large. This criterion resulted in the exclusion of the respiratory signals of three patients and three healthy volunteers.
) were determined. The number of breaths was determined by the number of upward half waves detected, whereas t
clip is the average duration of all clippings and t
avg is the average breath duration. The influence of clipping was considered to be unacceptable when CR · CT > 100, indicating that either the number of clippings and/or the duration of clipping was relatively large. This criterion resulted in the exclusion of the respiratory signals of three patients and three healthy volunteers.
Figure 1.
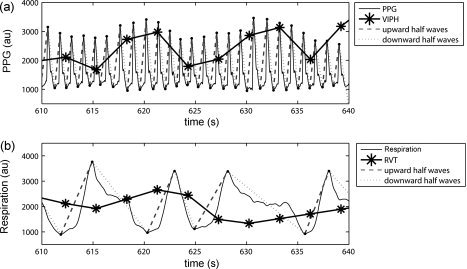
(a) shows 40 s of the recorded photoplethysmogram (PPG) of a healthy volunteer (Subject 9) measured in arbitrary units (au) and divided into downward and upward half waves (red and green lines). The normalized variation in pulse height (VIPH) is depicted by the black line. (b) shows the corresponding part of the respiratory signal, also divided into upward and downward half waves. The black line represents the normalized RVT regressor.
fMRI Analysis
fMRI data were motion corrected, matched to the anatomical scan, and spatially smoothed with a Gaussian kernel with a standard deviation of 5 mm. The correlation of fMRI signals with the parameter of interest, which is either the interictal activity or the alpha power, was defined by a single GLM. Similar to the analysis presented in de Munck et al. [2007, 2008] the impulse response function on the regressor of interest was estimated from the data instead of assuming a standard canonical hemodynamic response function. The fMRI data d with N data points can be modeled as shown in (1)
| (1) |
where h are the coefficients of the impulse response function, φ is the vector of nuisance coefficients with as many values as confounders are added to the model, and η is the vector of assumed uncorrelated measurement noise. P contains the regressors of interest with each column representing a shifted version of the predictor. Each column in C represents a regressor of noninterest. The coefficients of interest and noninterest were estimated per voxel with ordinary least squares. The coefficients of the impulse response function were interpolated afterwards according to the slice time. At each voxel the level of correlation between the data and the regressors of interest was calculated using an F‐test, accounting for the number of estimated parameters, the number of nuisance effects and the number of data points. Mathematical details can be found in Appendix A of de Munck et al. [2007]. The resulting P‐values were converted to a false discovery rate (FDR), which was used to threshold the statistical maps [Genovese et al., 2002]. These maps were overlaid on the anatomical scan.
The regression model was applied in several different ways and the resulting statistical maps were compared. In all analyses the standard confounders were the same: six motion regressors resulting from the motion correction of the fMRI time series, a constant, linear, and quadratic trend, six RETROICOR regressors of the heart beat [Glover et al., 2000] and 10 shifted versions of the heart beat intervals [de Munck et al., 2008]. Data points where the fMRI was disturbed by motion (more than 0.5 mm or 0.5 degrees) or related to a low quality of EEG epochs or where artifacts in the PPG signal were present because of movement were omitted from the analysis. In the study of patients with epilepsy, the regressor of the interictal epileptiform activity was used as a predictor in the model. Since more than one type of IED could be present during the recording, in this study the type with the highest prevalence was chosen as a predictor. The other regressors were combined to one regressor and added as a parameter of noninterest to the model. Both regressors were shifted in time over multiples of TR in order to account for possible delayed responses in the fMRI. In this study shifts of −2 to +7 times TR, i.e. from −6 to +21 seconds, were applied, resulting in 10 shifted regressors. The negative shifts may account for noncausal effects caused by neural activity preceding the event which is visible in the EEG [Hawco et al., 2007]. In the study of the healthy volunteers, the amount of alpha activity was added as a predictor to the GLM. Similar to the IED regressors, shifts of −6 to +21 s were applied to the alpha power regressor.
For all subjects, 10 lagged versions were derived from VIPH with shifts similar to the other regressors, which were added either as predictors or as confounders to the GLM. The shifts were applied in order to account for delayed responses between VIPH measured at the subject's finger and the fMRI signals. For the healthy volunteers, the effect of VIPH was compared with the results of the GLM where respiration was taken into account, modeled with six RETROICOR regressors of the respiratory signal and with 10 shifted RVT regressors. In distinction to the method presented in the study of Birn et al. [2006] where different time shifts were analyzed with separate models, in this study the time shifted versions of RVT were analyzed in a single GLM.
Model Comparisons
In this study the statistical maps of different models were compared quantitatively by computing the number of activated voxels and the amount of overlap between the activated areas of different models. Each model is characterized by the type of predictor (alpha, IED, VIPH, etc.) and the type of confounder (standard (stan), standard plus VIPH, standard plus RVT, etc). First, we computed the fraction of activated voxels for each model as shown in (2)
| (2) |
where the superscript p indicates which predictor is used in the model and where the subscript c represents the additional confounders. N brain represents the total number of brain voxels. The number of significantly activated voxels was determined at an FDR of 1%. Next, the differences of the correlation patterns of models with the same predictors, but with distinct confounders were compared by computing the differences in activated areas using
| (3) |
For example, the difference in the number of activated voxels as a result of the correlation of IEDs and the fMRI signals with and without VIPH taken into account is defined by diff.
When confounders are added to a certain model, part of the correlation pattern will remain unaffected, some of the voxels may become nonsignificant and others significant, resulting possibly in newly activated areas. To quantify these possible results, we computed
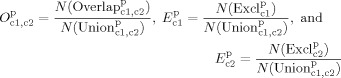 |
(4) |
where N(Overlap) is the number of activated voxels detected with both of the two models, N(Excl) and N(Excl) are the number of activated voxels exclusively detected by the model with c1 or the model with c2 confounders, respectively (Fig. 2a). Finally, the denominator indicates the number of activated voxels that are significant in either of these two models. Note that by definition the sum of O , E , and E is equal to one. Furthermore, when e.g. the VIPH regressors would act as a pure noise reducer, E would be close to zero (Fig. 2b).
Figure 2.
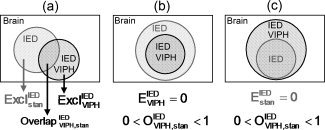
A graphical representation of the comparison of two models. In this example the correlation between IED and fMRI signals without (frac) and with VIPH (frac) correction is schematically shown. (a) shows the definitions of the areas which were calculated. (b) shows the situation in which the model with VIPH correction is a subset of the model without VIPH correction. (c) shows the reverse situation in which the model without VIPH correction is a subset of the model with VIPH correction.
Clustering of Impulse Response Functions
To describe the variety in the estimated impulse response curves of VIPH, a hierarchical cluster analysis was performed on basis of similarity in morphology of the estimated impulse response functions of each significantly activated brain voxel [de Munck et al. 2007]. A distance table was computed consisting of the distances between estimated response curves at different significantly activated voxels. For each cluster, the average impulse response function was determined to be representative for that cluster.
RESULTS
To determine to what extent VIPH could be associated with the variance of fMRI signals, VIPH was used as a predictor in the GLM. In Figure 3 the statistical maps resulting from the correlation between VIPH and fMRI signals are shown in a sagittal and axial MR scan for all subjects included in this study, both for patients (Subjects 1–5) and healthy volunteers (Subjects 6–18). The statistical maps show a widespread correlation pattern which is bilaterally symmetric for most of the subjects. The fraction of activated voxels ranged for these subjects from 0.000 to 0.887 (frac in Tables I and II) with an average fraction of 0.33. Note that strong correlations were found for both patients (e.g. Subjects 3 and 4) and healthy volunteers (e.g. Subjects 7, 9, and 14) although the number of activated voxels was quite small for other subjects, (e.g. Subjects 5, 13, and 18). Cluster analysis of the estimated impulse response function was performed for three of the healthy volunteers with a strong correlation between VIPH and the fMRI signals (Subjects 7, 9, and 14). Cluster analysis was truncated at three clusters, because visual inspection indicated that further clustering did not yield more variation in the response curves. The spatial distributions of these clusters are depicted in the left column of Figure 4, whereas the averaged response functions corresponding to these clusters are shown in the right column of Figure 4. The spatial distributions show that distinct brain regions correspond to different impulse response functions. Furthermore, it appeared that the impulse response curves varied over the subjects. However, in all three subjects the averaged impulse response functions show a negative correlation followed by a positive deflection, suggesting that there was a delayed response between the peak height measured at the subject's finger and the BOLD response.
Figure 3.
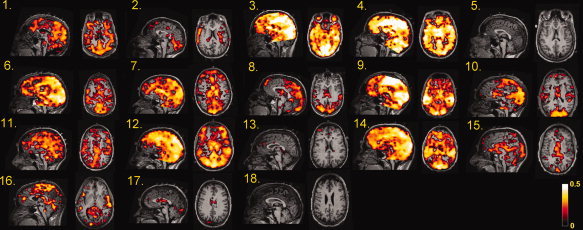
Statistical maps representing the significant BOLD changes which correlate with the variations in pulse height (VIPH) for all subjects (mid sagittal and axial views) at an FDR <1%. The statistical maps of Subject 1 till 5 represent the correlation patterns of the patients with epilepsy, whereas the statistical maps of Subject 6 till 18 represent the activated voxels of the healthy volunteers.
Table II.
Summary of EEG‐fMRI findings in healthy volunteers for different applied regression models
| 1 | 2 | 3 | 4 | 5 | 6 | 7 | 8 | 9 | 10 | 11 | 12 | 13 |
|---|---|---|---|---|---|---|---|---|---|---|---|---|
| Subject | frac | frac | frac | frac | frac | frac | frac | diff | diff | diff | E: O: E | R |
| 6 | 0.527 | 0.297 | — | 0.426 | 0.325 | 0.425 | — | −23.7 | −0.0 | — | 0.00 : 0.75 : 0.24 | −0.02 |
| 7 | 0.453 | 0.365 | 0.248 | 0.008 | 0.008 | 0.008 | 0.006 | −6.1 | −6.5 | −24.3 | 0.10 : 0.74 : 0.16 | −0.00 |
| 8 | 0.216 | 0.315 | 0.378 | 0.205 | 0.149 | 0.209 | 0.156 | −26.9 | +2.1 | −23.6 | 0.06 : 0.63 : 0.31 | −0.11 |
| 9 | 0.782 | 0.241 | 0.492 | 0.642 | 0.298 | 0.651 | 0.546 | −53.7 | +1.3 | −15.0 | 0.00 : 0.46 : 0.54 | −0.36 |
| 10 | 0.257 | 0.266 | 0.519 | 0.442 | 0.376 | 0.448 | 0.203 | −14.8 | +1.4 | −54.1 | 0.00 : 0.85 : 0.15 | 0.00 |
| 11 | 0.332 | 0.617 | 0.204 | 0.241 | 0.150 | 0.250 | 0.224 | −37.7 | +3.8 | −6.8 | 0.00 : 0.62 : 0.38 | −0.24 |
| 12 | 0.769 | 0.411 | 0.793 | 0.716 | 0.544 | 0.702 | 0.465 | −24.0 | −2.0 | −35.0 | 0.00 : 0.76 : 0.24 | 0.04 |
| 13 | 0.007 | 0.556 | 0.410 | 0.073 | 0.070 | 0.057 | 0.032 | −4.3 | −21.4 | −56.2 | 0.05 : 0.87 : 0.09 | −0.05 |
| 14 | 0.700 | 0.036 | 0.054 | 0.688 | 0.482 | 0.686 | 0.662 | −30.0 | −0.3 | −3.7 | 0.00 : 0.70 : 0.30 | −0.16 |
| 15 | 0.119 | 0.288 | 0.280 | 0.039 | 0.015 | 0.033 | 0.073 | −61.3 | −14.5 | +86.4 | 0.03 : 0.64 : 0.34 | −0.36 |
| 16 | 0.131 | 0.142 | — | 0.024 | 0.021 | 0.012 | — | −13.1 | −50.1 | — | 0.11 : 0.66 : 0.13 | −0.17 |
| 17 | 0.016 | 0.531 | 0.085 | 0.003 | 0.003 | 0.003 | 0.003 | +20.9 | −3.0 | +40.3 | 0.20 : 0.76 : 0.03 | −0.02 |
| 18 | 0.000 | 0.576 | — | 0.003 | 0.002 | 0.003 | — | −27.0 | −5.0 | — | 0.02 : 0.70 : 0.28 | 0.13 |
| Mean (std) | 0.33 (0.29) | 0.36 (0.18) | 0.35 (0.22) | 0.27 (0.28) | 0.19 (0.19) | 0.27 (0.28) | 0.24 (0.24) | −30.4 (21.3) | −0.6 (14.7) | −9.2 (43.4) | 0.04 : 0.70 : 0.25 | −0.10 |
The second till fifth column represent the fraction of significantly activated brain voxels resulting from the analyses where VIPH (frac), respiratory RETROICOR regressors (frac), RVT (frac) and alpha power (frac) were used as a predictor. Columns 6, 7 and 8 represent the analysis of alpha power with the use of VIPH, respiratory RETROICOR or RVT regressors as additional confounders. Columns 9, 10, and 11 show the difference between the alpha power correlations with and without applying VIPH, respiratory RETROICOR regressors or RVT regressors as additional confounders. In column 12 the overlapping ratios of the activated areas of the alpha power analyses with and without VIPH correction are given. The last column represents the correlation between the alpha and VIPH regressors. The last row shows mean and standard deviation (std) values.
Figure 4.
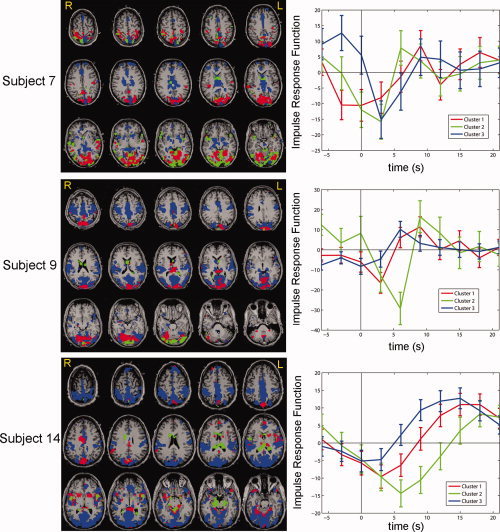
The impulse responses obtained when VIPH was used as a predictor, were clustered for the 8000 most significant voxels of Subjects 7, 9, and 14. The figures in the left column show the spatial distribution of the three obtained clusters, whereas in the right column the corresponding impulse response functions are shown as a function of time.
Delineation of the Epileptogenic Zone
For the five epilepsy patients studied, the result of correction for VIPH by applying this regressor as an additional confounder to the GLM was greatest for Subject 3. This was a patient with a right temporal lobe lesion, who had an abnormal breathing pattern during fMRI recording showing very deep breaths alternating with superficial breaths. When VIPH was not taken into account, a diffuse correlation pattern was obtained from which the epileptogenic zone could not be distinguished (Fig. 5a–c). After VIPH correction, the number of activated voxels was strongly diminished (85.5% at an FDR of 1%) resulting in a maximal BOLD response in the right temporal lobe (Fig. 5d–f). Thus, for this patient VIPH correction enabled the interpretation of the EEG‐fMRI results in relation to the clinical diagnosis. Note, furthermore, that the area of maximal BOLD response was almost completely located within the resected area, which is delineated by the white contour line (Fig. 5d). After surgery the patient was seizure free according to the Engel Classification (Engel 1A one year after surgery). The results of VIPH correction of the five patients studied are summarized in Table I. In four out of five patients the maximal BOLD response (Column 9), was located in the same lobe as the epileptogenic lesion. In three out of five patients a reduction in the number of activated voxels was found when VIPH correction was applied (Column 7). Comparison of the activated areas detected with the two models showed that for these patients the model with VIPH correction was a subset of the model without VIPH correction (E < 0.05; Column 8), as is represented in Figure 2b. These results suggest that the number of activated voxels was reduced and that no newly activated areas were obtained. Thus, applying VIPH as a confounder to the GLM resulted in noise reduction for three out of the five patients studied. On the other hand, in two patients (Subjects 1 and 4) an increase in activated voxels was found. It appeared that in these patients the model without VIPH correction was a subset of the model with VIPH correction (E < 0.01; Column 8), as is represented in Figure 2c. Further inspection of these results showed that for both patients no newly activated areas were found, but that the already activated areas were extended. The results of Subject 1 are illustrated in Figure 6, showing that the additionally activated voxels were mostly related to the areas surrounding the previous resection indicated with the white arrows. This result is consistent with other studies [e.g., Ossenblok et al., 2007], who showed that the epileptogenic zone is often located at the margins of the lesion.
Figure 5.
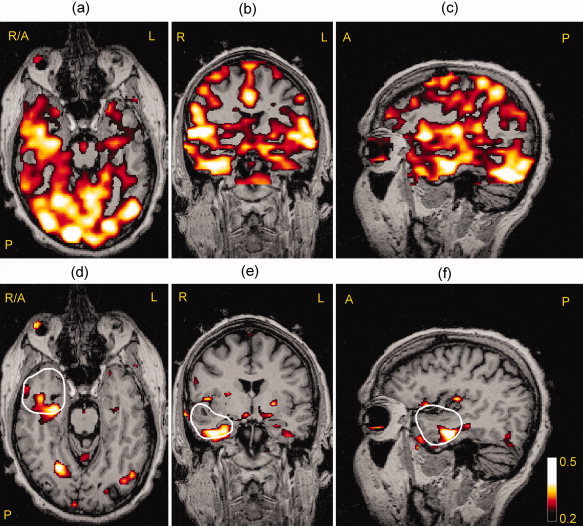
The correlation between fMRI signals and interictal epileptiform activity for Subject 3 shown in an axial (a),coronal (b), and sagittal (c) view at an FDR <1%. The figures (d, e, f) in the bottom row show the same slices but now VIPH was applied as an additional confounder, showing that the maximal BOLD response was located mainly within the resected area (white contour line).
Figure 6.
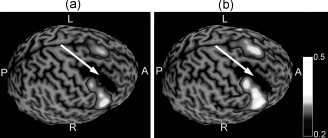
The correlation of IED with BOLD represented as a surface rendering for Subject 1 without VIPH correction (a) and with VIPH correction (b) relative to the brain area resected during previous epilepsy surgery, indicated by the white arrow.
Generators of the Alpha Rhythm
The results of alpha correlated BOLD changes obtained in the study of healthy volunteers are shown in Table II. The fractions of activated brain volume when VIPH was added either as a predictor or as a confounder are shown respectively in Columns 2 and 6. When VIPH was added as a confounder (frac), it appeared that the number of activated voxels decreased compared to the results without VIPH correction (frac; Column 5) for all subjects except one (Column 9). An average reduction in the fraction of activated voxels of 30.4% was obtained. Comparison of the models with and without VIPH correction shows that the model with VIPH correction is a subset of the model without VIPH correction (Column 12, E = 0.04 ± 0.06), as illustrated in Figure 2b. Therefore, in most cases no newly activated areas were found and the difference in activated voxels essentially reflects a reduction of activated areas. To gain more insight in the relation between alpha and VIPH regressors the correlation coefficients between both regressors for each subject were calculated (R ; Column 13). Comparison of these coefficients with diff shows that a larger negative correlation resulted in a larger reduction of activated brain voxels when VIPH was added as an additional confounder. The correlation coefficient between those two parameters, R and diff, is 0.63.
Table II also depicts the fractions of the activated brain voxels when the RETROICOR (RETRO) and RVT regressors were added either as a predictor (Columns 3 and 4) or as confounders (Columns 7 and 8). The average fraction of activated brain voxels was 0.35 for both the respiratory RETROICOR and RVT predictors, which is in accordance to the average fraction of VIPH as predictor. Nevertheless, large differences between subjects were found. Subjects for whom the correlation between VIPH and the fMRI signals was strong, do not necessarily show strong correlations for the respiratory RETROICOR or RVT regressors (e.g. Subject 9). When the respiratory RETROICOR regressors were added as additional confounders in the analysis of the alpha rhythm, in some subjects a decrease in activated voxels was found, while there was a slight increase in fraction in other subjects, ranging from −50.1 to +3.8% (Column 10). When the RVT regressors were used as confounders a decrease in activated voxels was found for eight out of 10 subjects, ranging from −56.2 to +86.4% (Column 11). For most subjects VIPH correction resulted in a larger reduction of activated voxels than the RVT or respiratory RETROICOR regressors (e.g. Subjects 9, 11, 14, and 15), except for three of them for whom RVT yielded a larger reduction in the number of activated voxels (e.g. Subject 7, 10, and 13). Figure 7 shows the normalized VIPH and RVT regressors of the healthy volunteers and also presents the correlations between VIPH and RVT for the individual subjects, which appear to be very small (−0.08 ± 0.09). This figure demonstrates that the variability in physiological functioning differs among subjects and that VIPH and RVT act differently within subjects.
Figure 7.
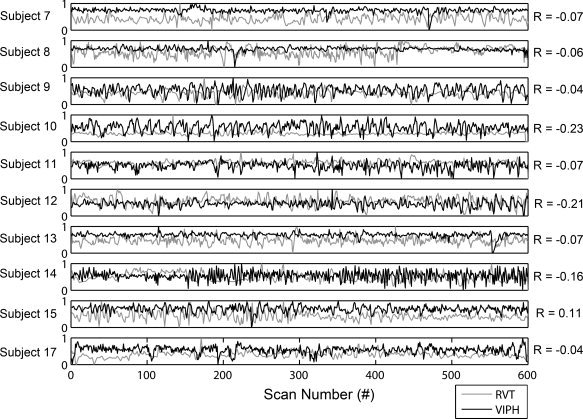
This figure shows the normalized time courses of VIPH and RVT for the healthy volunteers for whom both regressors could be accurately estimated. VIPH regressors are depicted in black as a function of scan number, whereas RVT regressors are depicted in grey.
Figure 8 shows for one of the subjects studied (Subject 9) the correlation patterns of the different regression analyses used. In Figure 8a the alpha correlated BOLD responses with the standard confounders are shown. In Figure 8b, d and f VIPH, respiratory RETROICOR regressors and RVT were used as predictors in the model. From Figure 8b and d it appears that the use of VIPH and respiratory RETROICOR as predictor resulted in distinct activated brain areas, while the result of RVT as predictor (Fig. 8f) is in good agreement to the activated areas when VIPH was used as predictor, though the correlation is less strong. The color‐coded map in Figure 8c shows the alpha power correlation with VIPH taken into account, whereas the maps in Figure 8e and g represent the alpha power correlation with the respiratory RETROICOR regressors or RVT regressors added as additional confounders. The white contour line in these figures represents the alpha power correlation without any additional confounders as represented in Figure 8a. For this subject, VIPH yielded the largest reduction in activated voxels. Figure 8c shows that mainly spurious correlations were removed because the areas where on physiological grounds the generators of the alpha rhythm are expected, i.e., occipital cortex, left, and right parietal cortex and thalamus, still remained activated (yellow arrows).
Figure 8.
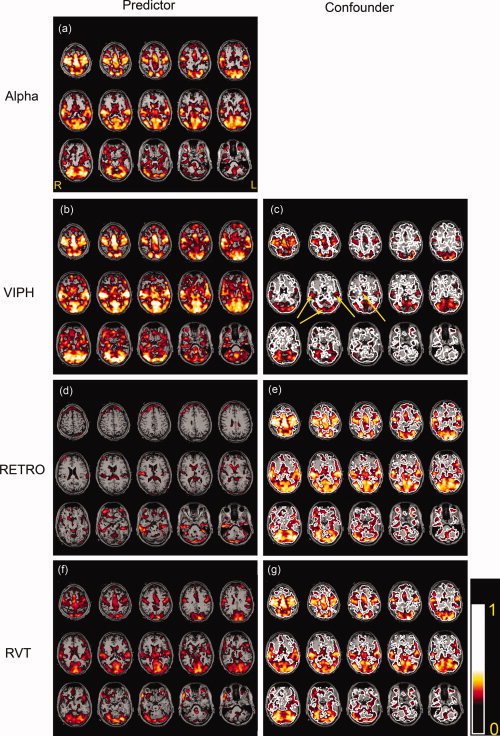
The results for one of the healthy volunteers (Subject 9) where VIPH, respiratory RETROICOR regressors (RETRO) or RVT regressors were taken into account in the regression analyses. These regressors were used as predictors (b, d, f) or as confounders while the alpha power was the predictor (c, e, g). For comparison, (a) shows the correlation of the alpha power without any of these additional regressors taken into account. The same correlation is represented in (c), (e), and (g) with a white contour line. The yellow arrows in (c) point toward the significantly activated left and right parietal cortex, occipital cortex, and thalamus.
DISCUSSION
The results obtained in this study show that fMRI of spontaneous brain activity does not only correlate with the event of interest, but also with VIPH, which reflects both changes in respiration and cardiac activity. When VIPH was applied as a predictor to the GLM a correlation was found between this regressor and the fMRI signals, showing that it explains a large part of the variance of the fMRI signals because of non‐neural physiological processes. The correlations were largest in the patient who had an abnormal breathing pattern during the recording. However, also in healthy volunteers a substantial correlation was found. This suggests that the variance of fMRI signals due to physiological functioning is not only present during abnormal functioning but is also part of the regular variability in respiratory and cardiac functions.
When VIPH was added as a confounder to the GLM, the interpretation of the fMRI results of the patients was enhanced in terms of the identification of the epileptogenic zone in at least one of the patients (Subject 3); without VIPH correction it was not even possible to distinguish any plausible epileptogenic region in this patient. In the other patients the effect of VIPH as an additional regressor was smaller: either a decrease or an increase in activated voxels was obtained, but in neither of these cases newly activated areas were found. Therefore, adding VIPH as an additional confounder to the model influenced the interpretation of the results either positively or comparable, but never negatively. In the study of healthy volunteers, the alpha correlated BOLD changes were reduced when VIPH was added as a confounder to the GLM. In most cases no newly activated areas were found and the areas which were reported as responsible for a subject's alpha rhythm, i.e. thalamus, occipital, and parietal areas [de Munck et al., 2007; Gonçalves et al., 2006; Laufs et al., 2003; Moosmann et al., 2003], remained significantly activated. Moreover, the alpha response curves (not shown) were hardly affected when VIPH was added as a confounder. Thus, in general applying VIPH as an additional confounder yielded a reduction of physiological noise, but did not change our understanding or perception of the alpha correlated BOLD changes.
A practical advantage of using PPG for correction of physiological functioning is that it requires a relatively simple measurement with a sensor which is available as standard equipment for most MR scanners. The same signal can also be used for the determination of heart beat intervals [de Munck et al., 2008] and cardiac RETROICOR regressors as well as for the correction of ballistocardiographic artifacts in the EEG [Gonçalves et al., 2006]. For our application of PPG one has to assure that the raw signal is recorded, i.e. with auto gain function switched off.
Although it has been reported that PPG variations are partly caused by changes in the position of the sensor due to movements [Linder et al., 2006; Murray et al., 1996; Rusch et al., 1996] or by changes in temperature at the measuring position (e.g. cold fingers) [Lindberg et al., 1991]. It seems unlikely to us that these effects explain the observed large correlation between VIPH and fMRI signals. Moreover, it has been reported that PPG is related to respiratory functioning [Shelley, 2007]. Therefore, the question arises what the exact relation is between VIPH and earlier reported regressors that have a more direct relationship with respiratory function, e.g. respiratory RETROICOR and RVT regressors. From the results in Table II it appeared that the fraction of activated voxels substantially varies over subjects and the choice of predictor. It is known, furthermore, that the respiratory RETROICOR regressors yield correlation patterns with activated areas at the boundaries between brain and cerebrospinal fluid (e.g. Fig. 8d) whereas RVT yield activations at true brain areas (e.g. Fig. 8f) [Birn et al., 2006]. In that sense, VIPH behaves more like RVT than respiratory RETROICOR (Fig. 8b). Note, however, that the correlation of VIPH and RVT is small (−0.08 ± 0.09), thus indicating that our proposed VIPH is not a direct substitute of RVT. Instead, it describes a new aspect of the mechanism by which respiration affects the fMRI signals.
Our results also showed a large intersubject variability in terms of activated voxels e.g. when VIPH or alpha power were used as predictors in the GLM. In this study we have shown that there were large differences in the modulation of the physiological regressors across subjects (see Fig. 7), which could partly explain the differences in fMRI results. This variability was already reported for the correlation of alpha and fMRI [Gonçalves et al., 2006, 2008], suggesting that the large intersubject variability is related to the individual variations in the EEG.
Chang et al. [2009] already showed that it was important to combine both heart rate and respiratory depth in a single model. To correct for all physiological influences, including VIPH, the most straightforward solution is to include all proposed physiological regressors, i.e. cardiac and respiratory RETROICOR regressors, heart beat intervals, RVT, and VIPH, as confounders to the GLM for fMRI analysis. However, the more confounders are added to the GLM, the smaller the statistical power of the fMRI analysis. Furthermore, if the regressors are not independent, multicollinearity of regressors will appear, resulting in overfitting of the GLM. New mathematical models will have to be derived, that systematically describe the physical mechanisms by which variations in heart rate, respiration and oxygenation affect the BOLD signal. Combined with extensive simulations, in which oxygen saturation is directly measured, this will hopefully result in a minimum set of regressors with a firm mathematical physical basis that removes the influence of physiological noise on fMRI signals.
CONCLUSION
In this study we described a new regressor, VIPH, which is based on a linear combination of oxy‐ and deoxyhemoglobin resulting from cardiac and respiratory fluctuations. This regressor explains a large part of the variance of fMRI signals due to physiological functions and is not correlated to earlier reported RETROICOR, RVT, and heart beat regressors. The interpretation of EEG‐fMRI results can be substantially enhanced when VIPH is regressed out as is shown for the delineation of the epileptogenic zone and the generators of the alpha rhythm. Our method does not require additional hardware, because the pulse oximeter is usually used for clinical monitoring or to estimate heart rate confounders in fMRI analysis.
Acknowledgements
The authors would like to thank Marlies Dolmans and Ine Keulen for their assistance during the EEG‐fMRI recordings of the patients and the annotation of the EEG data afterwards.
REFERENCES
- Allen PJ, Polizzi G, Krakow K, Fish DR, Lemieux L ( 1998): Identification of EEG events in the MR scanner: The problem of pulse artefact and a method for its subtraction. Neuroimage 8: 229–239. [DOI] [PubMed] [Google Scholar]
- Benar CG, Gross DW, Wang Y, Petre V, Pike B, Dubeau F, Gotman J ( 2002): The BOLD response to interictal epileptiform discharges. Neuroimage 17: 1182–1192. [DOI] [PubMed] [Google Scholar]
- Birn RM, Diamond JB, Smith MA, Bandettini PA ( 2006): Separating respiratory‐variation‐related fluctuations from neuronal‐activity‐related fluctuations in fMRI. Neuroimage 31: 1536–1548. [DOI] [PubMed] [Google Scholar]
- Chang C, Cunningham JP, Glover GH ( 2009): Influence of heart rate on the BOLD signal: The cardiac response function. Neuroimage 44: 857–869. [DOI] [PMC free article] [PubMed] [Google Scholar]
- de Munck JC, Gonçalves SI, Faes TJ, Kuijer JP, Pouwels PJ, Heethaar RM, Lopes da Silva FH ( 2008): A study of the brain's resting state based on alpha band power, heart rate and fMRI. Neuroimage 42: 112–121. [DOI] [PubMed] [Google Scholar]
- de Munck JC, Gonçalves SI, Huijboom L, Kuijer JP, Pouwels PJ, Heethaar RM, Lopes da Silva FH ( 2007): The hemodynamic response of the alpha rhythm: An EEG/fMRI study. Neuroimage 35: 1142–1151. [DOI] [PubMed] [Google Scholar]
- Genovese CR, Lazar NA, Nichols T ( 2002): Thresholding of statistical maps in functional neuroimaging using the false discovery rate. Neuroimage 15: 870–878. [DOI] [PubMed] [Google Scholar]
- Glover GH, Li TQ, Ress D ( 2000): Image‐based method for retrospective correction of physiological motion effects in fMRI: RETROICOR. Magn Reson Med 44: 162–167. [DOI] [PubMed] [Google Scholar]
- Goldman RI, Stern JM, Engel J Jr, Cohen MS ( 2002): Simultaneous EEG and fMRI of the alpha rhythm. Neuroreport 13: 2487–242. [DOI] [PMC free article] [PubMed] [Google Scholar]
- Gonçalves SI, de Munck JC, Pouwels PJ, Schoonhoven R, Kuijer JP, Maurits NM, Hoogduin JM, Van Someren EJ, Heethaar RM, Lopes da Silva FH ( 2006): Correlating the alpha rhythm to BOLD using simultaneous EEG/fMRI: Inter‐subject variability. Neuroimage 30: 203–213. [DOI] [PubMed] [Google Scholar]
- Gonçalves SI, Pouwels PJ, Kuijer JP, Heethaar RM, de Munck JC ( 2007): Artifact removal in co‐registered EEG/fMRI by selective average subtraction. Clin Neurophysiol 118: 2437–2450. [DOI] [PubMed] [Google Scholar]
- Gonçalves SI, Bijma F, Pouwels PJW, Jonker MA, Kuijer JPA, Heethaar RM, Lopes da Silva FH, De Munck JC ( 2008): A data and model‐driven approach to explore inter‐subject variability of resting‐state brain activity using EEG‐fMRI. IEEE J Sel Top SP 2: 944–953. [Google Scholar]
- Gotman J, Benar CG, Dubeau F ( 2004): Combining EEG and FMRI in epilepsy: Methodological challenges and clinical results. J Clin Neurophysiol 21: 229–240. [DOI] [PubMed] [Google Scholar]
- Hawco CS, Bagshaw AP, Lu Y, Dubeau F, Gotman J ( 2007): BOLD changes occur prior to epileptic spikes seen on scalp EEG. Neuroimage 35: 1450–1458. [DOI] [PubMed] [Google Scholar]
- Krakow K ( 2008): Imaging epileptic activity using functional MRI. Neurodegener Dis 5: 286–295. [DOI] [PubMed] [Google Scholar]
- Laufs H, Kleinschmidt A, Beyerle A, Eger E, Salek‐Haddadi A, Preibisch C, Krakow K ( 2003): EEG‐correlated fMRI of human alpha activity. Neuroimage 19: 1463–1476. [DOI] [PubMed] [Google Scholar]
- Laufs H, Walker MC, Lund TE ( 2007): ‘Brain activation and hypothalamic functional connectivity during human non‐rapid eye movement sleep: An EEG/fMRI study’—Its limitations and an alternative approach. Brain 130 ( Part 7): e75; author reply e76. [DOI] [PubMed] [Google Scholar]
- Lindberg LG, Tamura T, Öberg PÅ ( 1991): Photoplethysmography, Part 1. Comparison with laser Doppler flowmetry. Med Biol Eng Comput 29: 40–47. [DOI] [PubMed] [Google Scholar]
- Linder SP, Wendelken SM, Wei E, McGrath SP ( 2006): Using the morphology of photoplethysmogram peaks to de3tect changes in posture. J Clin Mon Comp 20: 151–158. [DOI] [PubMed] [Google Scholar]
- Logothetis NK, Pauls J, Augath M, Trinath T, Oeltermann A ( 2001): Neurophysiological investigation of the basis of the fMRI signal. Nature 412: 150–15. [DOI] [PubMed] [Google Scholar]
- Lund TE, Madsen KH, Sidaros K, Luo W, Nichols TE ( 2006): Non‐white noise in fMRI: Does modeling have an impact? Neuroimage 29: 54–66. [DOI] [PubMed] [Google Scholar]
- Mantini D, Perrucci M, Del Gratta C, Romani GL, Corbetta M ( 2007): Electrophysiological signatures of resting state networks in the human brain. Proc Natl Acad Sci USA 104: 13170–13175. [DOI] [PMC free article] [PubMed] [Google Scholar]
- Moosmann M, Ritter P, Krastel I, Brink A, Thees S, Blankenburg F, Taskin B, Obrig H, Villringer A ( 2003): Correlates of alpha rhythm in functional magnetic resonance imaging and near infrared spectroscopy. Neuroimage 20: 145–158. [DOI] [PubMed] [Google Scholar]
- Murray WB, Foster PA ( 1996): The peripheral pulse wave: information overlooked. J Clin Monit 12: 365–377. [DOI] [PubMed] [Google Scholar]
- Nadapow V, Dhond R, Conti G, Makris N, Brown EN, Barbieri R ( 2008): Brain correlates of autonomic modulation: Combining heart rate variability with fMRI. Neuroimage 42: 169–177. [DOI] [PMC free article] [PubMed] [Google Scholar]
- Noll DC, Schneider W ( 1994): Theory, simulation, and compensation of physiological motion artifacts in functional MRI. Proceedings of IEEE International Conference on Image Processing, Austin, Texas. pp. 40–44.
- Ossenblok P, de Munck JC, Colon A, Drolsbach W, Boon P ( 2007): Magnetoencephalography is more successful for screening and localizing frontal lobe epilepsy than electroencephalography. Epilepsia 48: 2139–2149. [DOI] [PubMed] [Google Scholar]
- Rusch TL, Sankar R, Scharf JE ( 1996): Signal processing methods for pulse oximetry. Comp Biol Med 26: 143–159. [DOI] [PubMed] [Google Scholar]
- Salek‐Haddadi A, Diehl B, Hamandi K, Merschhemke M, Liston A, Friston K, Duncan JS, Fish DR, Lemieux L ( 2006): Hemodynamic correlates of epileptiform discharges: An EEG‐fMRI study of 63 patients with focal epilepsy. Brain Res 1088: 148–166. [DOI] [PubMed] [Google Scholar]
- Salek‐Haddadi A, Friston KJ, Lemieux L, Fish DR ( 2003): Studying spontaneous EEG activity with fMRI. Brain Res Rev 43: 110–133. [DOI] [PubMed] [Google Scholar]
- Schabus M, Dang‐Vu TT, Albouy G, Balteau E, Boly M, Carrier J, Darsaud A, Degueldre C, Desseilles M, Gais S, Phillips C, Rauchs C, Schnakers C, Sterpenich V, Vandewalle G, Luxen A, Maquet P ( 2007): Hemodynamic cerebral correlates of sleep spindles during human non‐rapid eye movement sleep. Proc Natl Acad Sci USA 104: 13164–13169. [DOI] [PMC free article] [PubMed] [Google Scholar]
- Shamir M, Eidelman LA, Floman Y, Kaplan L, Pizov R ( 1999): Pulse oximetry plethysmographic waveform during changes in blood volume. Br J Anaesth 82: 178–181. [DOI] [PubMed] [Google Scholar]
- Shelley KH ( 2007): Photoplethysmography: Beyond the calculation of arterial oxygen saturation and heart rate. Anesth Analg 105( 6 Suppl): S31–S36. [DOI] [PubMed] [Google Scholar]
- Shmueli K, van Gelderen P, de Zwart JA, Horovitz SG, Fukunaga M, Jansma JM, Duyn JH ( 2007): Low‐frequency fluctuations in the cardiac rate as a source of variance in the resting‐state fMRI BOLD signal. Neuroimage 38: 306–320. [DOI] [PMC free article] [PubMed] [Google Scholar]
- Van Houdt PJ, Ossenblok PPW, Erp GE, Schreuder KE, Krijn RJJ, Cluitmans PJM ( 2007): Obstructive sleep disordered breathing: A signal analysis approach. Annual symposium of the IEEE/EMBS Benelux Chapter, Heeze, The Netherlands: pp. 2–14. [Google Scholar]
- Windischberger C, Langenberger H, Sycha T, Tschernko EM, Fuchsjager‐Mayerl G, Schmetterer L, Moser E ( 2002): On the origin of respiratory artifacts in BOLD‐EPI of the human brain. Magn Reson Imaging 20: 575–582. [DOI] [PubMed] [Google Scholar]
- Zijlmans M, Huiskamp G, Hersevoort M, Seppenwoolde JH, van Huffelen AC, Leijten FS ( 2007): EEG‐fMRI in the preoperative work‐up for epilepsy surgery. Brain 130( Part 9): 2343–2353. [DOI] [PubMed] [Google Scholar]