

Abstract
The early prediction of consciousness recovery from traumatic brain injury (TBI) is crucial to make decisions about the appropriate use of prolonged intensive care. Diffusion tensor imaging (DTI) has been proposed as a biomarker of white matter injury that could be used in a classification purpose. Instead of region‐of‐interest‐based approach, we applied voxel‐based approaches (voxel‐based DTI and tract‐based spatial statistics) on 30 patients with TBI to identify, without any prior, the brain regions that were specifically damaged in unfavorable 1‐year outcome group compared to the favorable one. DTI were acquired at mean 23 days (5–53 days) and two DTI‐derived indices, fractional anisotropy (FA) and apparent diffusion coefficient (ADC), were tested. Our results showed that (1) ADC is not a relevant biomarker for early 1‐year outcome prognosis; (2) FA measured in inferior longitudinal fasciculus, in cerebral peduncle, in posterior limb of the internal capsule, and in posterior corpus callosum is specifically decreased in unfavorable outcome group compare to the favorable one; (3) a linear discriminant analysis using the FA measured in these four regions showed good classification performance (sensitivity = 86% and specificity = 86%). These findings confirm the relevance of the use of DTI as biomarkers for consciousness recovery after TBI and support the possible use of these biomarkers for early classification of patients. Hum Brain Mapp, 2009. © 2009 Wiley‐Liss, Inc.
Keywords: traumatic brain injury, clinical outcome, diffusion tensor imaging, tract‐based spatial statistics
INTRODUCTION
Severe traumatic brain injury (TBI) is one of the most common causes of long‐term disability, including coma, persistent vegetative or minimally conscious state [Bruns and Hauser, 2003]. In the clinical context, the prediction of consciousness recovery is crucial to make decisions about the appropriate level of initial care. However, clinical experience showed that clinical examinations, conventional CT, and morphological magnetic resonance images (MRI) are in most of the cases insufficient to make such decisions, in part because it fails to depict primary lesions such as diffuse axonal injury (DAI) [Coles, 2007]. In particular, in the clinical context, the visual examination of the T2 images is insufficient to differentiate (when they are visible) simple contusions that are potentially reversible and brain parenchyma lesions that are irreversible.
However, several studies have shown that diffusion‐weighted imaging (DWI) [Chan et al., 2003; Goetz et al., 2004; Hou et al., 2007; Huisman et al., 2003] and diffusion tensor imaging (DTI) [Arfanakis et al., 2002; Huisman et al., 2004; Nakayama et al., 2006; Ptak et al., 2003] are sensitive in detecting DAI and white matter disruption without macroscopic lesion. Computed from DTI data, the fractional anisotropy (FA) index expresses fiber tract integrity through the relative difference of diffusion across and along axonal fibers, whereas the apparent diffusion coefficient (ADC) index quantifies the local averaged diffusion in all directions. In the case of DAI, the FA index allows us to detect white matter fiber disorders (decrease of FA) and the ADC index is sensitive to the movement of water in the tissue, so is sensitive, in particular, to the water diffusion in the intracellular compartment, which is reduced in case of ischemia for instance (decrease of ADC). Moreover, a recent study supported the fact that DTI parameters, especially the FA and the ADC, are relevant biomarkers, which may have prognosis value in TBI [Sidaros et al., 2008]. To do so, the authors manually delineated, for each patient, four white matter regions of interest (ROIs) that were known to be affected by TBI. The FA value reduction in some regions [in the cerebral peduncle (CP) in particular] measured few weeks postinjury appeared to be highly correlated with an unfavorable 1‐year outcome, whereas the ADC values changed between favorable 1‐year outcome and unfavorable 1‐year outcome patients only after 12 months. However, this last result was contradictory to the results presented by Hou et al. [ 2007], which showed that ADC values measured only after few days postinjury in the deep white matter zone consisting of the corpus callosum were significantly different between unfavorable and favorable outcomes and controls. It appears therefore that the main limitation of these approaches was that the choice of the ROIs was based on clinical priors. Indeed, other white matter tracts affected by TBI could be relevant to improve outcome prediction by using the DTI biomarkers.
Recently, explorative voxel‐based analysis proved its efficiency in detecting unpredicted areas where DTI parameters were altered in Fabry disease [Albrecht et al., 2007], in low‐grade hepatic encephalopathy [Kumar et al., 2008], or in amyotrophic lateral sclerosis [Thivard et al., 2007]. In the context of TBI, this approach was used to detect FA reduction localization in patients compared to controls [Nakayama et al., 2006]. More recently, a study applied voxel‐based analysis on DTI and T1‐weighted images to compare longitudinal changes (from 2 months to 1 year post‐injury) in patients with TBI and in controls [Bendlin et al., 2008].
In this context, the goal of the present article was thus to apply voxel‐based analyses to identify the most relevant DTI biomarkers values (FA and/or ADC) measured a few weeks after TBI and the associated white matter tracts that allow the best 1‐year outcome prediction in TBI. The predictive accuracy of the selected biomarkers will then be compared to the classical clinical and morphological parameters.
MATERIALS AND METHODS
Study Patients
Thirty patients (two females) with a mean age of 37 ± 12 years and an age range of 15–65 years were hospitalized in the Surgical Neuro‐Intensive Care Unit of the Pitié‐Salpêtrière Hospital, Paris, France, between January 2002 and April 2006 (see table 1) and were included if they met the following criteria: (1) TBI requiring mechanical ventilation for neurological reasons; (2) persistent disorder of consciousness, defined as the absence of response to simple orders, and not explained by sedation or other medical causes at the time informed consent was signed by the legally authorized representative; (3) absence of previous neurological disorders; and (4) hemodynamic, ventilatory, and neurological conditions allowing transportation and prolonged supine position without risk to the patient, most notably, stabilized intracranial pressure. Treatment follows the Pitié‐Salpêtrière algorithm published in Lescot et al. [ 2008]. DTI acquisitions were performed in these 30 patients and also in 10 healthy controls (four females) with a mean age of 31 ± 9 years and an age range of 22–49 years. No corticosteroids were used for the patients at the time of DTI scan.
Table I.
Patients included in the DTI study
| Patient | Age | Sex | Cause of injury | GCS | Marshall | ICU | MV | Delay | GOS | Group |
|---|---|---|---|---|---|---|---|---|---|---|
| 1 | 35 | M | MVA | 4 | 2 | 44 | 13 | 16 | 4 | F |
| 2 | 43 | M | Assault | 12 | 6 | 57 | 45 | 29 | 3 | UF |
| 3 | 55 | F | Fall | 6 | 6 | 19 | 19 | 8 | 1 | UF |
| 4 | 15 | F | MVA | 7 | 2 | 90 | 18 | 35 | 3 | UF |
| 5 | 26 | M | MVA | 4 | 3 | 38 | 38 | 31 | 1 | UF |
| 6 | 54 | M | MVA | 15 | 2 | 8 | 5 | 14 | 5 | F |
| 7 | 30 | M | MVA | 6 | 2 | 32 | 25 | 28 | 5 | F |
| 8 | 20 | M | MVA | 6 | 5 | 43 | 28 | 36 | 4 | F |
| 9 | 65 | M | Fall | 5 | 5 | 6 | 6 | 5 | 1 | UF |
| 10 | 47 | M | Fall | 3 | 6 | 97 | 72 | 31 | 3 | UF |
| 11 | 40 | M | MVA | 6 | 6 | 64 | 64 | 53 | 1 | UF |
| 12 | 38 | M | Fall | 3 | 6 | 32 | 25 | 18 | 4 | F |
| 13 | 46 | M | MVA | 6 | 6 | 36 | 33 | 31 | 1 | UF |
| 14 | 43 | F | Fall | 8 | 2 | 14 | 14 | 14 | 1 | UF |
| 15 | 44 | M | Fall | 3 | 5 | 33 | 26 | 15 | 4 | F |
| 16 | 38 | M | MVA | 4 | 3 | 39 | 32 | 13 | 2 | UF |
| 17 | 45 | M | Pedestrian | 6 | 6 | 101 | 41 | 37 | 4 | F |
| 18 | 52 | M | Fall | 3 | 6 | 11 | 11 | 13 | 1 | UF |
| 19 | 39 | M | Fall | 4 | 2 | 15 | 8 | 6 | 5 | F |
| 20 | 23 | M | MVA | 5 | 3 | 62 | 48 | 24 | 3 | UF |
| 21 | 30 | M | Fall | 7 | 3 | 34 | 28 | 34 | 4 | F |
| 22 | 37 | M | MVA | 9 | 5 | 29 | 13 | 19 | 4 | F |
| 23 | 20 | M | MVA | 3 | 3 | 97 | 72 | 31 | 4 | F |
| 24 | 23 | M | Fall | 15 | 5 | 25 | 22 | 23 | 5 | F |
| 25 | 20 | M | MVA | 12 | 5 | 34 | 30 | 23 | 4 | F |
| 26 | 24 | M | MVA | 5 | 5 | 64 | 42 | 23 | 4 | F |
| 27 | 27 | M | MVA | 11 | 5 | 35 | 25 | 32 | 5 | F |
| 28 | 32 | M | MVA | 3 | 2 | 58 | 24 | 24 | 3 | UF |
| 29 | 45 | M | Fall | 3 | 2 | 67 | 41 | 21 | 3 | UF |
| 30 | 53 | M | MVA | 3 | 2 | 20 | 21 | 19 | 1 | UF |
MVA, motor vehicle accident; GCS, Glasgow coma scale; ICU, days in the intensive care unit; MV, days of mechanical ventilation; Delay, days from injury to MRI; GOS, Glasgow outcome scale; F, favorable 1‐year outcome; UF, unfavorable 1‐year outcome.
DTI Acquisitions
DTI acquisitions was performed on a 1.5 T system (Signa, General Electric, Milwaukee, WI) under mechanical ventilation and sedation by sufentanil (20–30 μg/h) and propofol (100–200 mg/h) to ensure immobility of the patient during image acquisition. The acquisition parameters were the following: axial plane; TR/TE = 8,000/84.9 ms; 23 directions; diffusion b value = 700 s/mm2; slice thickness = 5 mm; no gap; 20 slices; field of view 32 × 32 cm2; matrix 128 × 128; and two averages. The inferior slice of the DTI acquisition was positioned at the junction between the pons and the medulla oblongata.
Clinical Evaluation
Age, mechanical ventilation duration, and length of stay in the ICU were recorded. The Glasgow coma scale (GCS) score was determined by the first physicians upon arrival at the site of the accident and Marshall scores were determined from initial CT [Marshall et al., 1991]. The Glasgow outcome scale (GOS) score was evaluated for all patients 1 year later by an independent physician. A GOS score of 3 was assigned to patients in minimally conscious state as defined by Giacino and Zasler [ 1995]. Patients with various disabilities but with normal consciousness classified GOS 3 for the most severe of them in several earlier studies were classified GOS 4 here, since our goal was to assess the outcome in terms of consciousness recovery. For the analysis, the patients were divided into two groups based on consciousness recovery (GOS 1–3: unfavorable outcomes, including death, persistent vegetative state, and minimally conscious state or GOS 4–5: favorable outcome, including minor or no residual impairments and residual impairments that did not affect consciousness). Clinicians in charge of the patients were blinded as to the results of DTI analysis.
DTI Data Analysis
All processing were done using FSL software (http://www.fmrib.ox.ac.uk/fsl/). The DTI images were first corrected for distortions due to eddy currents using the b = 0 volume as reference. The diffusion tensor was estimated and the FA and the ADC were calculated for each voxel from the three estimated eigenvalues [Pierpaoli and Basser, 1996] that quantify the water diffusion in three orthogonal directions. Then the FA and ADC images were registered on a 1 × 1 × 1 mm3 standard space image (MNI152 space) using a nonlinear registration procedure and a voxel‐based analysis (VB‐DTI) was then conducted on both FA and ADC images, which was spatially smoothed using a Gaussian kernel of 3 mm. The differences between the FA and ADC measured in the favorable and unfavorable outcome groups were inferred using a permutation testing procedure (Monte‐Carlo permutation test). The group difference maps of the two‐sample unpaired t‐test were then thresholded (P < 0.05) using the cluster‐based thresholding procedure including a correction for multiple comparisons that controls the familywise error rate.
In addition to the VB‐DTI analysis, which did not take into account the residual misalignments between subjects after the nonlinear registration (that is not completely removed by the spatial smoothing), we use the tract‐based spatial statistics (TBSS) approach to test the ADC and FA differences [Smith et al., 2006]. It consists of calculating the FA skeleton from the mean FA image (across the subjects). The FA skeleton is a representation of the alignment‐invariant tracts on which the individual ADC and FA images are projected. A voxelwise statistical analysis restricted to the ADC or FA values projected on the skeleton was then applied to test the differences between the favorable and unfavorable outcome groups. Because of the possible strong FA reduction in the patient groups, we calculated the mean FA skeleton from the control group; the FA and ADC values of each patient were then projected onto this skeleton.
Predictive Accuracy of DTI‐Derived Biomarkers for the Clinical Outcome
The former analysis allowed us to determine the biomarkers (FA or ADC) that were the most discriminant between favorable and unfavorable 1‐year outcome and to localize the brain regions where the differences were the highest. As the location and the extension of these ROIs depend on the group of patients included in the analysis, we tested the spatial variability of the ROIs depending on the subjects by using a permutation‐style analysis. The TBSS approach was applied 500 times on 12 favorable and 12 unfavorable outcome patients chosen randomly. Each voxel of the FA skeleton was then characterized by a score between 0 and 500 corresponding to the number of times this voxel is selected in a ROI.
In the clinical context, our aim was then to test the predictive accuracy for the clinical outcome of the DTI biomarkers measured in the ROIs and to compare them to classical clinical data: age, GCS, and Marshall CT score at admission. To do so, linear discriminant analysis (LDA) was performed to classify the patients into two categories, favorable and unfavorable outcome, using DTI biomarkers only, clinical data only (age, GCS, and Marshall CT score), or both. The posterior probability of each patient to belong to each class was calculated by a bootstrap crossvalidation procedure. This approach consists of, firstly, randomly choosing three patients from each groups (favorable and unfavorable outcome), secondly computing the LDA function using the 24 remaining patients, and finally calculating the posterior probability of the six testing patients to belong to the two groups. This procedure was repeated 5,000 times. Thus, we got 15,000 samples of the posterior probability of favorable (and unfavorable) outcome patients to belong to each group. To evaluate the classification accuracy, we calculated the sensitivity and the specificity of the classification of two groups according to the threshold of the posterior probability. We especially compared the results with two thresholds: P = 0.5 (all cases were classified) and P = 0.95 (only the cases with a high level of confidence were classified). In our clinical context, the sensitivity of the classification was defined as the ratio between the number of correctly classified unfavorable outcome cases and the total number of unfavorable outcome cases; the specificity was defined as one minus the ratio between the number of wrongly classified favorable outcome cases and the total number of favorable outcome cases. Finally, we computed the accuracy, defined as the ratio between the number of correctly classified cases (both favorable and unfavorable outcome) and the total number of cases.
RESULTS
VB‐DTI
Firstly, a VB‐DTI analysis was performed on the whole brain to compare the ADC and FA values between favorable and unfavorable 1‐year outcome patients. There was no significant ADC differences between the two groups (P = 0.3). But Figure 1 shows that the FA was significantly lower (P < 0.05) for the unfavorable 1‐year outcome group compared to the favorable one around several white matter fasciculi: the inferior longitudinal fasciculus (ILF), the CP, the posterior limb of the internal capsule (PLIC), and the posterior corpus callosum (PCC).
Figure 1.
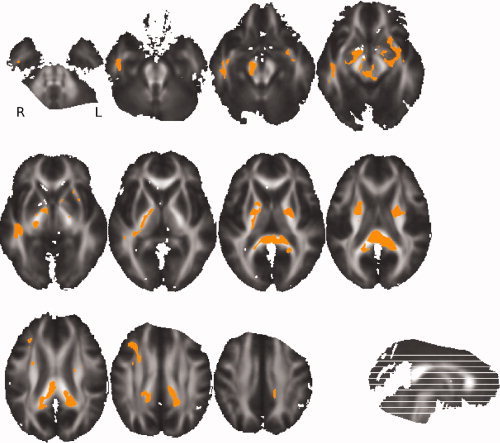
VB‐DTI results: Orange color shows voxels where FA on the skeleton is significantly lower (P < 0.05) in unfavorable outcomes than in favorable outcomes. This map is superimposed on the mean of all individual FA images of the patients.
Voxelwise Analysis on the FA Skeleton
The TBSS approach, limited to the FA skeleton, confirmed the VB‐DTI results. Indeed, no significant ADC differences were found between favorable and unfavorable 1‐year outcome patients, whereas FA was significantly lower for the unfavorable group around the same white matter fasciculi (ILF, CP, PLIC, and PCC). However, we observed a right lateralization of the effect, because only the right parts of CP, ILF, and PLIC showed significant FA differences between the two groups (see Fig. 2). The study of the spatial variability of these regions depending on the subsets of subjects used showed that the four regions extracted using all subjects correspond to the regions that are systematically extracted using the subsets of subjects (see Fig. 3). It showed also that the right lateralization of the PLIC is not systematically observed because the left PLIC is highlighted with almost half of the sampled subsets. On the other hand, the right lateralization of the CP and ILF is confirmed.
Figure 2.
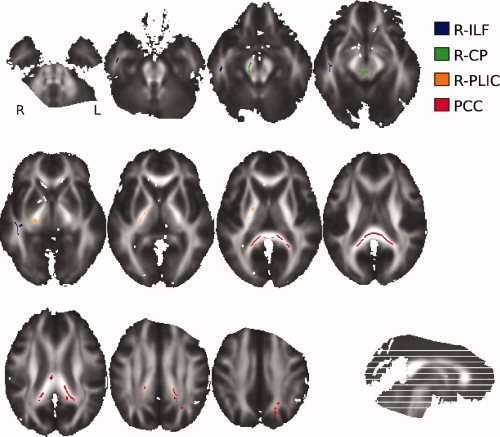
The four regions where FA on the skeleton is significantly lower (P < 0.05) in unfavorable outcomes than in favorable outcomes. This map is superimposed on the mean of all individual FA images of the patients. These regions were used to define FA biomarkers.
Figure 3.
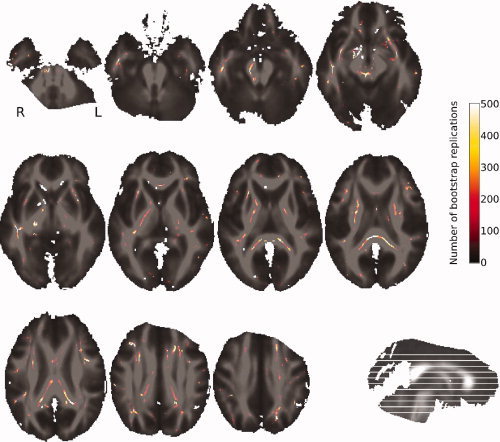
Spatial variability of the ROIs. The mapped score between 0 and 500 represents the number of times a voxel has been selected as a voxel of interest (over the 500 boot strap repetitions). This map is superimposed on the mean of all individual FA images of the patients.
Predictive Accuracy
The FA measured in the four former regions calculated by TBSS (right CP, right ILF, right PLIC and PCC) were the most discriminant between favorable and unfavorable 1‐year outcome. We then defined, for each patient and healthy control, four indices as the median value of the projected FA values in each of the four regions as calculated by TBSS (see Fig. 2). The distributions of these indices across the three groups (controls, favorable outcomes, and unfavorable outcomes) were plotted in the Figure 4. Not surprisingly, it appeared that the indices were significantly lower for the unfavorable outcome group than for the control and favorable outcome groups. Moreover, the values of the indices were similar between the favorable outcome and control groups. Therefore, a decrease of the FA values in the regions we selected seemed specifically associated with an unfavorable outcome.
Figure 4.
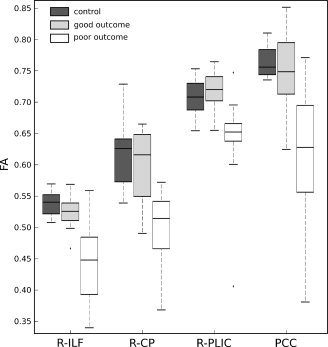
The distribution of the median of the FA values in the four ROIs across the three groups. The star indicates that the measures for the unfavorable outcomes are significantly lower (P < 0.0001) than for the favorable outcomes and the controls.
To go further, we looked for the regions where the FA measures on the FA skeleton were significantly different between the favorable outcome and control groups (see Fig. 5). It appeared that the highest differences were observed in the anterior corpus callosum (ACC). The distribution of the median of the FA values in this area across the three groups was plotted in the Figure 6. This showed that the FA values in ACC were significantly higher in the control group than in the two patient groups. However, the FA values in ACC were similar in the two groups of patients, suggesting that damages in this area are not predictive of the 1‐year outcome.
Figure 5.
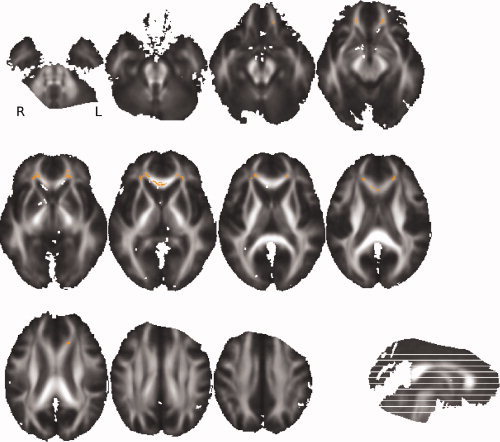
TBSS results: Orange color shows voxels where FA on the skeleton is significantly lower (P < 0.05) in favorable outcomes than in healthy controls. This map is superimposed on the mean of all individual FA images of the patients.
Figure 6.
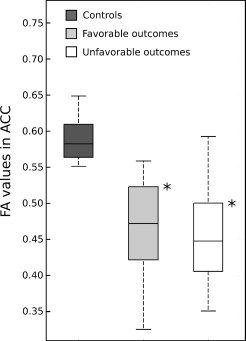
The distribution of the median of the FA values in the ACC ROIs across the three groups. The stars indicate that the measures for the healthy controls are significantly higher (P < 0.0001) than for the patients.
The predictive accuracy of the four chosen parameters (the median of the FA values in right CP, right ILF, right PLIC and PCC) compared to the clinical parameters (age, GCS, and Marshall score) was then tested by a bootstrap crossvalidation of the LDA classification. The ROC curves plotted in Figure 7 showed that the classification using only the FA parameters was much better than the classification using only the clinical parameters and even better than the classification using both FA and clinical parameters. We distinguished two extreme cases depending on the threshold of the posterior probability (P) used. For the P = 0.5 threshold, the sensitivity and the specificity using only FA parameters were 86 and 86%, respectively (accuracy = 86%); for the P = 0.95 threshold, the sensitivity and the specificity were 49 and 97% (accuracy = 73%). In this last case, where only the patients with a high level of confidence were classified, the classification was highly specific but only half of the patient has been classified. For the other half, no answer was given.
Figure 7.
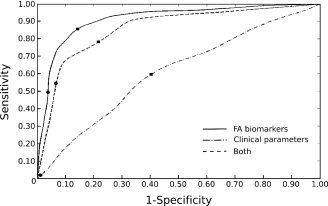
Bootstrap validation of the LDA classification. The three ROC curves represent the sensitivity function of 1‐specificity for various thresholds of the posterior probability P to belong to each class. The squares correspond to the P = 0.5 threshold and the circles to the P = 0.95 threshold.
DISCUSSION
The main objective of this work was to identify the relevant DTI biomarkers that improve the initial outcome prediction after TBI. To do so, we applied explorative voxel‐based approaches on DTI images acquired on 30 patients with TBI at the early postinjury stage. We tested the FA and ADC changes between the favorable 1‐year outcome group and the unfavorable one, using VB‐DTI and TBSS approaches. Both approaches provided coherent results.
Firstly, no significant ADC difference was observed between the two groups, suggesting that ADC is not a relevant biomarker for the early 1‐year outcome prognosis. These results generalize those presented in Sidaros et al. [2007], which indicated no early ADC changes in four white matter brain regions but only an increase in the PCC after 12 months postinjury. On the other hand, the results presented in Hou et al. [ 2007] showed significant ADC increase in deep zones of the corpus callosum for very early acquisitions (from 1 to 24 days). However, the mean time postinjury of their acquisitions (5 ± 4 days) are significantly lower than ours (23 ± 11 days). Thus, the postinjury edema might not be reduced enough at the time of the acquisitions, inducing an increase in ADC values.
Secondly, we showed significant FA differences between favorable and unfavorable 1‐year outcome groups around four FA tracks: in ILF, PLIC, CP, and PCC. Thus, the integrity of these tracks seems to play a key role in the consciousness maintenance. Indeed the ascending reticular activating system (ARAS), the primary arousal structure, is located in the CP, more precisely in the mesencephalic reticular formation [Parvizi and Damasio, 2001]. Moreover, the ARAS activates widespread cortical regions through the thalamus, which are linked by fibers of the internal capsule. In the study by Sidaros et al. [ 2008], PCC, CP, and PLIC (in addition to the centrum semioval) were chosen for the analysis, but significant FA differences with the initial DTI acquisitions were found only in CP. The absence of FA differences in PCC and PLIC might be due to the manual delineation of the ROIs that induced partial volume between voxels where FA is reduced and voxels where FA is unchanged. Moreover, our results in FA reduction showed a right lateralization of the effect, suggesting that FA reduction in the right parts of CP, PLIC, and ILF is more specific of unfavorable 1‐year outcome than the left parts. The specific presence of lateral lesions (localized with FLAIR and T2* acquisitions) in unfavorable outcome group of patients have already been described in morphological MRI studies [Weiss et al., 2008]. This study highlighted in particular the lesions in the right CP.
Compared to the manual delineation of ROIs used in former studies, the voxel‐based approaches we proposed allowed us to automatically choose, without any priors, the most relevant FA tracks on the FA skeleton for predictive purpose in TBI. Moreover, the use of the FA values projected on the FA skeleton in TBSS reduced the possible partial volume effect induced by the manual design of the ROIs or by the spatial smoothing used in VB‐DTI. Consequently, the FA values in the four ROIs were significantly different from one patient group to the other. On the other hand, the FA values in ACC, which were significantly different from the patients to the controls, did not discriminate the two groups of patients. This showed that the FA biomarkers in the four selected ROIs were sensitive and specific for the classification of unfavorable and favorable 1‐year outcome patients.
However, voxel‐based methods have limitations, especially for their use in a clinical context. Indeed, the application of the VB‐DTI imposes a spatial smoothing of the data. The choice for the optimal size of the Gaussian kernel is still an open question and seems to modulate the results [Jones et al., 2005]. In particular, when the spatial smoothing is too large, ambiguities over FA reduction remain: is it due to within‐tract FA change or change in tract thickness? Even if such problems are generally resolved by the TBSS approach, it has also some limitations. Especially, if the FA is strongly reduced in some areas, these areas may be excluded from analysis because of the mean FA thresholding on the skeleton. In this case, it is more appropriate to use a target FA skeleton derived from a control group. Finally, the main limitation of the two methods for their use on patients with TBI is the possible large brain deformations induced by the injury, which are not well corrected by the nonlinear registration.
To go further, we quantified the accuracy of the FA biomarkers, automatically selected by TBSS, to predict the 1‐year outcome, compared to the association of the clinical and CT parameters, usually used in the neuro‐intensive care unit. More precisely, we focused on the ability of early detecting the unfavorable 1‐year outcome cases. Indeed, in the clinical context, to make decisions about the appropriate level of initial care, it is important to identify the most unfavorable cases as unfavorable cases, but it is also crucial to never identify favorable cases as unfavorable cases. That is why we define the sensitivity and the specificity of the classification according to the unfavorable cases. Firstly, the bootstrap sampling of the LDA classification showed that the clinical and CT parameters were not discriminant between favorable and unfavorable 1‐year outcome patients. This confirmed the absolute necessity to find other parameters that would potentially help the clinicians to make decisions. Thus, the bootstrap sampling of the LDA classification showed that the use of the FA biomarkers led to a very specific classification of the unfavorable 1‐year outcome patients among all patients. The specificity reached even 97% when only the cases with a high confidence level were classified (with a posterior probability to belong to a class higher than 0.95). In the clinical practice, it is essential to make decisions with a high confidence level. In this context, the drawback is that the markers do not provide any answer concerning the 1‐year outcome of one patient on two.
However, this study involving 30 patients must be considered as a preliminary study. The relevance of the DTI biomarkers in the four ROIs has to be confirmed using a larger database. Moreover, relatively small number of patients has constrained us to use the same data to define the ROIs by TBSS and to test the predictive accuracy for the clinical outcome of the FA value in these ROIs. The chosen ROIs were thus well adapted to the dataset and our results were consequently biased. The constitution of a larger database will allow us to quantify the relevance of these ROIs on a dataset acquired independently.
In addition to the use of large datasets, two improvements could be investigated in future works. Firstly, support vector machine (SVM) algorithm using nonlinear model is known to outperform LDA. Its use in our context would probably increase the predictive performance of our approach. Secondly, other MR imaging biomarkers [from magnetic resonance spectroscopy (MRS) and functional magnetic resonance imaging (fMRI) in particular] could be associated to the DTI to improve the prognosis [Weiss et al., 2007]. MRS allows the study of the brain metabolism through several markers. N‐acetyl‐aspartate (NAA), Creatine (Cre), Choline (Cho), and Lactate (Lac) are of particular interest to evaluate the effect of TBI on cellular metabolism. For instance, several studies on patients with TBI showed that the NAA/Creatine ratio measured in specific brain areas (thalamus, pons, splenium of corpus callosum, in particular) appeared to be the best outcome predictor. fMRI, as for it, allows to detect dysfunction of brain regions that look structurally intact on conventional MRI. The study of the functional integrity of the brain systems involved in consciousness, such as the reticular activating system or the thalamo‐cortical circuits, might provide additional prognostic factors in TBI.
CONCLUSION
This article confirms that FA measured in several specific brain areas is a relevant biomarker for early outcome prediction in TBI. The use of TBSS approach allowed us to automatically identify the most discriminant regions for classification in a clinical context. However, our results have to be confirmed on a larger dataset and could be improved by adding relevant biomarkers from MRS and fMRI acquisitions.
REFERENCES
- Albrecht J, Dellani PR, Müller MJ, Schmermuly I, Beck M, Stoeter P, Gerhard A, Fellgiebel A ( 2007): Voxel based analyses of diffusion tensor imaging in Fabry disease. J Neurol Neurosurg Psychiatry 78: 964–969. [DOI] [PMC free article] [PubMed] [Google Scholar]
- Arfanakis K, Haughton VM, Carew JD, Rogers BP, Dempsey RJ, Meyerand ME ( 2002): Diffusion tensor MR imaging in diffuse axonal injury. Am J Neuroradiol 23: 794–802. [PMC free article] [PubMed] [Google Scholar]
- Bendlin BB, Ries ML, Lazar M, Alexander AL, Dempsey RJ, Rowley HA, Sherman JE, Johnson SC ( 2008): Longitudinal changes in patients with traumatic brain injury assessed with diffusion‐tensor and volumetric imaging. Neuroimage 42: 503–514. [DOI] [PMC free article] [PubMed] [Google Scholar]
- Bruns J Jr, Hauser WA ( 2003): The epidemiology of traumatic brain injury: A review. Epilepsia 44 suppl: 2–10. [DOI] [PubMed] [Google Scholar]
- Chan JM, Tsui EY, Peh WC, Fong D, Fok KF, Leung KM, Yuen MK, Fung KK ( 2003): Diffuse axonal injury: Detection of changes in anisotropy of water diffusion by diffusion‐weighted imaging. Neuroradiology 45: 34–38. [DOI] [PubMed] [Google Scholar]
- Coles JP ( 2007): Imaging after brain injury. Br J Anaesth 99: 49–60. [DOI] [PubMed] [Google Scholar]
- Giacino JT, Zasler ND ( 1995): Outcome after severe traumatic brain injury: Coma, the vegetative state, and the minimally responsive state. J Head Trauma Rehabil 10: 40–56. [Google Scholar]
- Goetz P, Blamire A, Rajagopalan B, Cadoux‐Hudson T, Young D, Styles P ( 2004): Increase in apparent diffusion coefficient in normal appearing white matter following human traumatic brain injury correlates with injury severity. J Neurotrauma 21: 645–654. [DOI] [PubMed] [Google Scholar]
- Hou DJ, Tong KA, Ashwal S, Oyoyo U, Joo E, Shutter L, Obenaus A ( 2007): Diffusion‐weighted magnetic resonance imaging improves outcome prediction in adult traumatic brain injury. J Neurotrauma 24: 1558–1569. [DOI] [PubMed] [Google Scholar]
- Huisman TA, Sorensen AG, Hergan K, Gonzalez RG, Schaefer PW ( 2003): Diffusion‐weighted imaging for the evaluation of diffuse axonal injury in closed head injury. J Comput Assist Tomogr 25: 5–11. [DOI] [PubMed] [Google Scholar]
- Huisman TA, Schwamm LH, Schaefer PW, Koroshetz WJ, Shetty‐Alva N, Ozsunar Y, Wu O, Sorensen AG ( 2004): Diffusion tensor imaging as potential biomarker of white matter injury in diffuse axonal injury. Am J Neuroradiol 25: 370–376. [PMC free article] [PubMed] [Google Scholar]
- Jones DK, Symms TM, Cercignani M, Howard RJ ( 2005): The effect of filter size on VBM analyses of DT‐MRI data. Neuroimage 26: 546–554. [DOI] [PubMed] [Google Scholar]
- Kumar R, Gupta RK, Elderkin‐Thompson V, Huda A, Sayre J, Kirsch C, Guze B, Han S, Thomas MA ( 2008): Voxel‐based diffusion tensor magnetic resonance imaging evaluation of low‐grade hepatic encephalopathy. J Magn Reson Imaging 27: 1061–1068. [DOI] [PubMed] [Google Scholar]
- Lescot T, Abdennour L, Boch A‐L, Puybasset L ( 2008): Treatment of intracranial hypertension. Curr Opin Crit Care 14: 129–134. [DOI] [PubMed] [Google Scholar]
- Marshall LF, Bowers Marshall S, Klauber MR, Van Berkum Clark M, Eisenberg HM, Jane JA, Luerssent G, Marmarou A, Foulkes MA ( 1991): A new classification of head injury based on computerised tomography. J Neurosurg 75 suppl: 514–520. [Google Scholar]
- Nakayama N, Okumura A, Shinoda J, Yasokawa Y‐T, Miwa K, Yoshimura S‐I, Iwama T ( 2006): Evidence for white matter disruption in traumatic brain injury without macroscopic lesions. J Neurol Neurosurg Psychiatry 77: 850–855. [DOI] [PMC free article] [PubMed] [Google Scholar]
- Parvizi J, Damasio A ( 2001): Consciousness and the brainstem. Cognition 79: 135–159. [DOI] [PubMed] [Google Scholar]
- Pierpaoli C, Basser PJ ( 1996): Toward a quantitative assessment of diffusion anisotropy. Magn Reson Med 36: 893–906. [DOI] [PubMed] [Google Scholar]
- Ptak T, Sheridan RL, Rhea JT, Gervasini AA, Yun JH, Curran MA, Borszuk P, Petrovick L, Novelline RA ( 2003): Cerebral fractional anisotropy score in trauma patients: A new indicator of white matter injury after trauma. Am J Radiol 181: 1401–1407. [DOI] [PubMed] [Google Scholar]
- Sidaros A, Engberg AW, Sidaros K, Liptrop MG, Herning M, Petersen P, Paulson OB, Jernigan TL, Rostrup E ( 2008): Diffusion tensor imaging during recovery from severe traumatic brain injury and relation to clinical outcome: A longitudinal study. Brain 131: 559–572. [DOI] [PubMed] [Google Scholar]
- Smith SM, Jenkinson M, Johansen‐Berg H, Rueckert D, Nichols TE, Mackay CE, Watkins KE, Ciccarelli O, Cader MZ, Matthews PM, Behrens TEJ ( 2006): Tract‐based spatial statistics: Voxelwise analysis of multi‐subject diffusion data. Neuroimage 31: 1487–1505. [DOI] [PubMed] [Google Scholar]
- Thivard L, Pradat P‐F, Lehéricy S, Lacomblez L, Dormont D, Chiras J, Benali H, Meininger V ( 2007): Diffusion tensor imaging and voxel based morphometry study in amyotrophic lateral sclerosis: Relationships with motor disability. J Neurol Neurosurg Psychiatry 78: 889–892. [DOI] [PMC free article] [PubMed] [Google Scholar]
- Weiss N, Galanaud D, Carpentier A, Naccache L, Puybasset L ( 2007): Clinical review: Prognostic value of magnetic resonance imaging in acute brain injury and coma. Crit Care 11: 230–241. [DOI] [PMC free article] [PubMed] [Google Scholar]
- Weiss N, Galanaud D, Carpentier A, Tezenas de Montcel S, Naccache L, Coriat P, Puybasset L ( 2008): A combined clinical and MRI approach for outcome assessment of traumatic head injured comatose patients. J Neurol 255: 217–223. [DOI] [PubMed] [Google Scholar]