

Abstract
Numerical and spatial magnitude processing have long been intimately associated, leading to the suggestion that they share a common system of magnitude representation. Although separate investigations on the cerebral areas involved in numerosity and spatial estimation point toward the parietal cortex, the precise anatomical overlap, if any, has not yet been directly established. Here, functional magnetic resonance imaging was used to localize the cerebral network involved in processing both numerosity and length. Blood oxygenation level‐dependent signal changes were measured while healthy volunteers were making numerosity comparisons on linear arrays of dots, and length comparisons on discrete linear arrays of dots and continuous rectangles. The results show the bilateral involvement of parietal regions around the intraparietal sulci in explicit and implicit processing of numerosity, and a right lateralized occipitoparietal network activation in length processing; numerosity and length processing both activate the right IPS and the precentral gyrus. By excluding the mandatory intrinsic spatial processing of arrays, we demonstrate that the left IPS is involved in numerosity processing only, whereas the right IPS underlies a common processing mechanism or representation of spatial and numerical magnitude. Hum Brain Mapp 2009. © 2009 Wiley‐Liss, Inc.
Keywords: numerosity processing, length processing, intraparietal sulcus, functional magnetic resonance imaging
INTRODUCTION
It has been suggested that the parietal cortices underlie a notation‐ and task‐independent semantic representation of numbers [Dehaene et al.,1998]. The role of the parietal areas, and more precisely the intraparietal sulci (IPS), in numerical processing has been demonstrated by neuropsychological studies with brain‐damaged patients [Dehaene and Cohen,1997; Takayama et al.,1994]. This finding is supported by recent brain imaging studies using number comparison [Kaufmann et al.,2005; Pesenti et al.,2000; Pinel et al.,1999,2001], parity judgment [Thioux et al.,2005], and various arithmetic tasks [Chochon et al.,1999; Lee,2000; Simon et al.,2002; Zago et al.,2001]. Most neuroimaging and neuropsychological studies in humans have only used symbolic number tasks (i.e., tasks with Arabic or verbal numerals), but only a few have investigated whether the parietal areas are also involved in processing nonsymbolic discrete materials (e.g., patterns of dots). This was done by using either passive habituation paradigms or tasks requiring the participants to count. Using an adaptation paradigm or variants of it, activations of the IPS of both hemispheres were indeed found in response to visual numerosity changes while participants were passively exposed to arrays of dots or squares [Ansari et al.,2006; Piazza et al.,2004]. Strict selectivity is hard to establish, but the sensitivity of the IPS to numerical changes is supported by the fact that this region does not respond in the same way to other changes in the stimuli, such as shape or distribution in space [Cantlon et al.,2006]. Moreover, similar neuronal adaptation and recovery effects have been observed for sets of dots and Arabic digits, supporting the idea that shared neural populations encode nonsymbolic and symbolic magnitudes [Piazza et al.,2007]. Bilateral implication of the posterior part of the IPS has also been demonstrated in several studies using dot enumeration and simple addition tasks requiring explicit counting, irrespective of whether the stimuli were presented sequentially or simultaneously [Fink et al.,2001; Piazza et al.,2002,2003; Sathian et al.,1999; Venkatraman et al.,2005]. This may reflect the visuospatial processes required to orient attention to numerically relevant dimensions of the stimuli and track their transformations. Finally, approximate nonsymbolic numerosity estimation has been shown to activate a right‐lateralized frontoparietal network including the IPS when participants had to estimate the numerosity of sequential series of visually and auditorily presented stimuli [Piazza et al.,2006], and the IPS foci were activated whether numerosity extended over space or over time [Castelli et al.,2006]. A magnitude‐comparison task with nonsymbolic stimuli (i.e., arrays of squares) was used to compare the neural substrate of the numerical distance effect in children and adults [Ansari and Dhital,2006]. A bilateral IPS implication was observed in adult participants, with an increase in activation with age in the left hemisphere only. Areas in and around the IPS have thus been shown to be involved in symbolic and nonsymbolic numerical magnitude processing.
The parietal cortex is also known to be involved in visuospatial functions such as spatial attention [Coull and Nobre,1998; Gitelman et al.,1999], perception of near and far space [Marshall and Fink,2001], and mental rotation [Kosslyn et al.,1998]. Interestingly, the IPS, especially in the right hemisphere, have been found to be activated for judgments of physical size and orientation [Faillenot et al.,2001; Pinel et al.,2004], and in line bisection tasks [Fink et al.,2000]. Moreover, the left IPS has been found to be common to the comparison of Arabic numerals, lengths of lines, and amplitudes of angles [Fias et al.,2003]. These findings suggest that magnitude might be represented or processed by the same mechanism for both symbolic and nonsymbolic continuous stimuli. Given the strong spatial dimension involved in nonsymbolic stimuli, space processing is a good candidate for such a common mechanism. The parietal cortex may indeed be engaged in cognitive computations on space and numbers [Walsh,2003], which could explain why physical size, spatial location, and numbers interfere at the behavioral level [Dehaene et al.,1993; Henik and Tzelgov,1982], and why patients with parietal damage may show deficits in both spatial and numerical bisection tasks [Rossetti et al.,2004; Vuilleumier et al.,2004; Zorzi et al.,2002]. The interference of spatial cues on numerosity judgment is found in the well‐known “conservation of number” task [Piaget,1952]; when two arrays with the same number of elements have different lengths, children until the age of seven erroneously decide that the longer array contains more objects. This reflects a misleading visuospatial “length‐equals‐number” heuristic that adults still have to inhibit to perform correctly [Daurignac et al.,2006; Houdé,1997; Houdé and Guichart,2001; Leroux et al.,2006]. We recently investigated the mutual influence of length and numerosity processing in a behavioral Stroop experiment in which healthy participants had to compare the length or the numerosity of arrays of dots in which the two dimensions were manipulated independently [Dormal and Pesenti,2007]. The results showed that the spatial cues interfered strongly with the numerosity judgment, whereas the numerical cues only interfered moderately with the length judgment. We interpreted these findings as reflecting a different mandatory processing of numerosity and length; with the stimuli used, length processing appears to take place automatically, whereas numerosity processing appears insufficiently automatic to generate strong interference effects. This observed asymmetry in interference did not allow us to draw firm conclusions about a possible common mechanism and hence a common brain substrate for length and numerosity processing. To test whether the numerosity‐sensitive neurons in the IPS were also sensitive to line‐length discrimination, recordings from single neurons in the left and right IPS of macaque monkeys were recently made while the monkeys were performing comparisons of either the number of items in multiple‐dot displays or the length of lines [Tudusciuc and Nieder,2007]. The results showed that some neurons responded selectively to either the numerical magnitude or the length, whereas others responded to both dimensions. This confirmed the presence of highly distributed representations of numerical and nonnumerical magnitudes, partly intermingled at the single‐cell level in the monkeys' IPS.
To date, however, a direct comparison of nonsymbolic numerosity and length processing has not been carried out using a neuroimaging approach in humans. Whether or not numerosity and length processing belong to the same general magnitude processing system and share the same neuroanatomical substrate in the human parietal cortex is thus still an open question. In the present study, we used functional magnetic resonance imaging (fMRI) to investigate and directly compare the brain's responses to numerosity and length‐comparison tasks. Participants had to compare the numerosity of two discrete linear arrays of dots, or the length of two discrete linear arrays of dots, or the length of two continuous black rectangles. If the same representational mechanisms and medium underlie numerosity and length processing, then the three types of comparisons should lead to similar activations, possibly in the areas around the IPS. This would provide direct support to the idea of a magnitude system underlying both (discrete) numerosity and (continuous) space processing in humans. Moreover, it is worth noting that using discrete and continuous stimuli in the length‐comparison tasks should allow us to isolate the brain areas specifically involved in length judgments, regardless of the type—discrete or continuous—of stimuli (by excluding those implicitly involved in the numerosity processing of discrete arrays); conversely, this should also isolate the brain areas specifically involved in numerosity processing (by including those implicitly involved in the length comparison of discrete arrays).
METHODS
Participants
Fourteen healthy French‐speaking male volunteers (mean age: 21 ± 2.3 years) participated in this study, after giving their informed written consent. All the participants were right‐handed, as attested by the Edinburgh inventory questionnaire [Oldfield,1971], had no history of neurological or psychiatric disorders, had corrected‐to‐normal vision, and were unaware of the purpose of the study. The experiment was noninvasive and was performed in accordance with the ethical standards laid down in the 1964 Helsinki Declaration; the experimental protocol was approved by the Biomedical Ethical Committee of the Université catholique de Louvain.
Tasks and Stimuli
Three comparison tasks were used: (1) a numerosity comparison of two linear arrays of dots (denoted N, for numerosity, later), (2) a length comparison of two discrete linear arrays of dots (DL, for discrete length), and (3) a length comparison of two continuous black rectangles (CL, for continuous length).
For the first two tasks, the arrays were composed of black dots and used nonperiodic signals so that spatial ratios were not confounded with numerosity, and density biases and pattern recognition were avoided [Breukelaar and Dalrymple‐Alford,1998; Dormal and Pesenti,2007]. The diameter of each dot (e j) varied from 2.5 to 15 mm, while the interdot spacing (i j) ranged from 2.5 to 20 mm; to avoid pattern recognition, each series involved at least one e j and one i j of 2.5 mm, one e j of 15 mm and one i j greater than 15 mm (see Fig. 1A). Pairs of arrays were composed of 5 vs. 8 dots for N and were 8 cm vs. 9 cm long for DL. For CL, the stimuli were two black rectangles 1 cm wide and 8 vs. 9 cm long. The position of the arrays/rectangles within the pairs varied: for half of the pairs, the smaller/shorter array/rectangle was on the left (S‐L pairs) and in the other half it was on the right (L‐S pairs). A 1‐cm high cross in the center of the screen separated the two elements of a pair, and the whole display occupied the center of the visual space (around 9° of visual angle). The participants were told to look at the cross throughout the task, so as to prevent possible eye saccades (Fig. 1B). Each pair was presented for 650 ms, with a 600‐ms intertrial interval between pairs (Fig. 2A).
Figure 1.
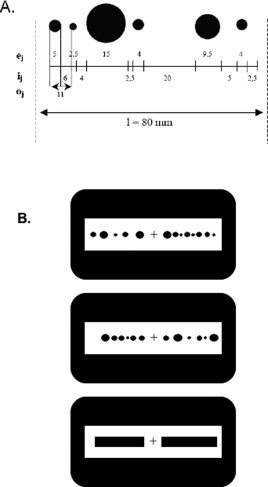
(A) Spatial attributes of the stimuli shown in a nonperiodic array with six dots and a total length of 80 mm (l = total length; o j = length of one dot and its adjacent spacing; e j = dot size; i j = interdot spacing). (B) Examples of stimuli composed of two linear arrays of dots for numerosity (upper panel) and discrete length comparison (middle panel), and of two continuous black rectangles for continuous length comparison (lower panel).
Figure 2.
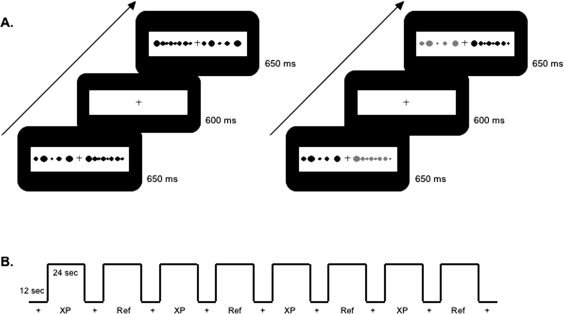
Schematic representation of the temporal structure of the experiment. (A) Examples of experimental (left) and reference (right) task: Each trial was composed of a stimulus (a pair of linear arrays of dots or a pair of continuous black rectangles) displayed for 650 ms, and a fixation cross for the intertrial interval for 600 ms. For the reference task, one element of the pair was red. (B) fMRI design. Each run consisted of eight alternations of a 12‐s fixation period (black cross on white background) and a 24‐s activation period. Each activation period corresponded to either an experimental condition or its reference condition.
The three reference tasks used the same stimuli as those in the corresponding experimental tasks, except for the fact that one of the two arrays or rectangles in each pair was colored red; participants were required to indicate which array/rectangle was red. These reference tasks were equated with the experimental tasks in terms of visual complexity and manual forced‐choice responses.
Experimental Procedure
Backprojected images were viewed through a tilted mirror mounted on the head coil; the projector and the mirror (Silent Vision™ System, Avotec, Inc., http://www.avotec.org) were compatible with the MRI environment. Stimulus presentation and response recording were controlled with E‐Prime [Schneider et al.,2002]. Each participant undertook six acquisition runs, each consisting of eight experimental blocks of 24 s interleaved with 12 s fixation periods of a black cross on a white background (Fig. 2B). In the numerosity‐comparison task, the participants had to decide which array contained more dots by pressing a left‐hand response button on a response box for the left array and a right‐hand response button for the right array. In the two length‐comparison tasks, they had to decide which array/rectangle was longer, using the same button presses.
Before the fMRI experiment, each participant also undertook a preliminary training session outside the magnet room to reach a stable performance level and to check on his capacity to fixate on the central cross throughout the task. In the training session, task and procedure were the same as in the fMRI session, but there were two distances between the pairs in the arrays: a large distance (three dots for numerosity: pairs 6 and 9; 3 cm for length: pairs 9 and 12 cm) and a small distance (one dot for numerosity: pairs 5 and 6; 1 cm for length: pairs 8 and 9 cm).1
fMRI Acquisition and Analysis
Functional images were acquired with a 1.5 T magnetic resonance imager and a standard head coil (Gyroscan, Philips Medical Systems) as series of blood‐oxygen‐sensitive T2*‐weighted echo‐planar image volumes (GRE‐EPI). Acquisition parameters were as follows: time to echo = 50 ms, time for repetition = 2,000 ms, flip angle = 90°, field of view = 210 × 210 mm2, slice thickness = 6 mm with no interslice gap. Each image volume comprised 20 axial slices acquired in an ascending interleaved sequence. High‐resolution T1‐weighted 3D fast field echo anatomical images with 110 1.5‐mm contiguous axial slices were also acquired for each participant (TE = 3 ms, TR = 30 ms, flip angle = 30°, FOV = 220 × 175 mm2; in‐plane voxel size 0.859 × 0.859 × 1.5 mm3). Head movement was limited by foam padding within the head coil and a restraining band across the forehead.
The data were processed and analyzed using statistical parametric mapping (SPM2, Welcome Department of Cognitive Neurology, London, UK; http://www.fil.ion.ac.uk/spm). Functional images were (1) corrected for slice acquisition delays, (2) realigned to the first scan of the first run (closest to the anatomical scan) to correct for within‐ and between‐run motion, (3) coregistered with the anatomical scan, (4) normalized to the MNI template using an affine fourth degree ß‐spline interpolation transformation and a voxel size of 2 × 2 × 2 mm3 after the skull and bones had been removed with a mask based on the individual anatomical images, and (5) spatially smoothed using a 10‐mm FWHM Gaussian kernel.
Condition‐related changes in regional brain activity were estimated for each participant by a general linear model in which the responses evoked by each condition of interest were modeled by a standard hemodynamic response function. The contrasts of interest were first computed at the individual level to identify the cerebral regions significantly activated by numerosity, DL, and CL, relative to the fixation periods used as a general baseline (respectively, [N − fix], [DL − fix], and [CL − fix]), and similarly for each reference task. Significant cerebral activations for these contrasts were then examined at the group level in random‐effect analyses using one‐sample t‐tests and analyses of variance (ANOVA), with the statistical threshold set at P < 0.05 (FamilyWise Error corrected) and extending to at least 15 contiguous voxels. Given the strong a priori hypotheses, activations in the parietal cortices were also screened at lower, uncorrected, thresholds The conjunction (using the minimum statistic compared to the conjunction null, MS/CN; [Nichols et al.,2005]) of each experimental contrast with its own reference contrast isolated the cerebral activations elicited by numerosity, DL, and CL comparisons. The conjunction (MS/CN) of the two length tasks was computed in the same way to identify the cerebral activations involved in length comparison. A conjunction (MS/CN) between N and DL masked exclusively by CL revealed the cerebral activations in both explicit and implicit numerosity processing, excluding length processing. Finally, a triple conjunction analysis (MS/CN) between the three reference tasks, each contrasted to its experimental task, was carried out.
RESULTS
Behavioral Data
An ANOVA was performed on the response latencies (RLs) of correct answers with condition (experimental vs. reference) and task (N vs. DL vs. CL) as within‐subject variables. Significant main effects were observed for condition (F(1, 13) = 79.12, P < 0.001) and task (F(2, 26) = 9.63, P < 0.004). Participants responded faster overall to the reference (334 ± 31 ms) than to the experimental (434 ± 62 ms) tasks, and were slower in N and DL comparisons than in the CL comparison (N: 395 ± 41 ms, DL: 396 ± 62 ms, CL: 362 ± 37 ms; N‐CL: t(13) = 5.63, P < 0.001, DL‐CL: t(13) = 3.80, P < 0.003, and DL‐N: t(13) = 0.06, P > 0.9). Moreover, the RLs showed a condition by task interaction (F(2, 26) = 6.28, P < 0.007): the CL comparison was performed faster than the two other tasks, these differences being greater for experimental than for reference tasks (see Fig. 3).
Figure 3.
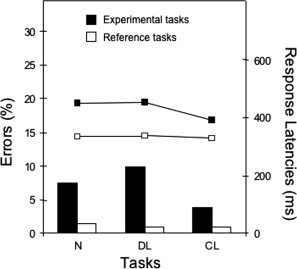
Mean percentage of errors and response latencies in milliseconds for discrete and continuous length and numerosity tasks, as a function of the condition (experimental vs. reference).
A similar ANOVA on error rates revealed significant main effects of condition (F(1, 13) = 34.57, P < 0.001) and task (F(2, 26) = 6.27, P < 0.03). Participants made more errors in the experimental (10.4% ± 6.4%) than in the reference (1.1% ± 1.2%) tasks. The CL comparison was performed more accurately than the DL and N comparisons (CL: 2.3% ± 2.9%, DL: 5.4% ± 2.4%, N: 9.4% ± 8.9%; CL‐DL: t(13) = 4.14, P < 0.002, CL‐N: t(13) = −3.07, P > 0.01, and DL‐N: t(13) = −1.62, P > 0.1). There was also a significant interaction between condition and task (F(2, 26) = 5.43, P < 0.04): error rates did not vary significantly between the three reference tasks, but in the experimental conditions, there were significantly fewer errors with the CL comparison than with the DL and N comparisons (see Fig. 3).
Functional Data
Numerosity processing
Contrasting the N task to its reference revealed the areas involved in explicit numerosity processing and comparison. Bilateral activations were found in the parietal lobes, in the depth and around the IPS, more extended in the right hemisphere. Areas of activation were also observed in the right middle and inferior frontal gyri and insula, the right supplementary motor area (SMA), the left and right occipitotemporal junction, and the left inferior frontal gyrus (Table Ia and Fig. 4A). A conjunction between the N and DL tasks, each contrasted to its reference and exclusively masked by CL minus its reference, revealed the cerebral areas commonly involved in explicit (N) and implicit (DL) discrete numerosity processing, excluding length processing (Table IIc). These areas included the left IPS (peak at −42, −40, 50), the left middle occipital gyrus, and the right occipitotemporal junction. Finally, contrasted to DL and CL, the N task activated the left and right occipitotemporal and occipitoparietal junctions, and the posterior part of the right IPS.
Table I.
Brain regions showing significant activation for (a) numerosity (N), (b) discrete length (DL), and (c) continuous length (CL) comparisons each compared to its own reference task (Ref)
| Brain regions | L/R | k | x | y | z | t‐Statistic | |
|---|---|---|---|---|---|---|---|
| a | [N − fix] − [RefN − fix] | ||||||
| Inferior frontal gyrus, opercular part | R | 473 | 48 | 6 | 26 | 10.51* | |
| Inferior frontal gyrus, opercular part | L | 20 | −48 | 4 | 26 | 5.35* | |
| Middle frontal gyrus | R | 154 | 30 | −2 | 64 | 6.71* | |
| Middle frontal gyrus | R | 68 | 42 | 32 | 28 | 5.81* | |
| IPS/inferior parietal lobule | R | 3,566 | 46 | −38 | 50 | 9.58* | |
| IPS/inferior parietal lobule | L | 523 | −32 | −52 | 52 | 7.11* | |
| Inferior temporal gyrus | L | 1,204 | −44 | −74 | −8 | 8.63* | |
| Supplementary motor area | R | 433 | 6 | 16 | 46 | 8.55* | |
| Insula | R | 209 | 32 | 26 | 0 | 6.38* | |
| b | [DL − fix] − [RefDL − fix] | ||||||
| IPS/inferior parietal lobule | R | 2,808 | 44 | −40 | 50 | 9.57* | |
| IPS/inferior parietal lobule | L | 228 | −38 | −46 | 50 | 6.63* | |
| Superior parietal lobule | L | 29 | −22 | −64 | 52 | 5.47* | |
| Inferior frontal gyrus, opercular part | R | 427 | 48 | 6 | 28 | 8.76* | |
| Inferior frontal gyrus, triangular part | R | 40 | 34 | 28 | 0 | 5.79* | |
| Inferior occipital gyrus | L | 263 | −44 | −76 | −6 | 7.48* | |
| Middle occipital gyrus | L | 174 | −34 | −84 | 14 | 6.12* | |
| Supplementary motor area | R | 299 | 6 | 16 | 46 | 7.37* | |
| Precentral gyrus | R | 155 | 30 | 0 | 60 | 6.72* | |
| c | [CL − fix] − [RefCL − fix] | ||||||
| Precentral gyrus | R | 16 | 50 | 4 | 26 | 5.56* | |
| IPS/inferior parietal lobule | R | 19 | 40 | −42 | 48 | 5.36* | |
| Superior parietal lobule | L | 26 | −40 | −50 | 64 | 2.82** |
L, left hemisphere; R, right hemisphere; k, cluster size (number of voxels); x, y, z, stereotaxic coordinates of peak‐height voxels.
P‐values < 0.05 FWE corrected for multiple comparisons.
P‐values < 0.001 uncorrected.
Figure 4.
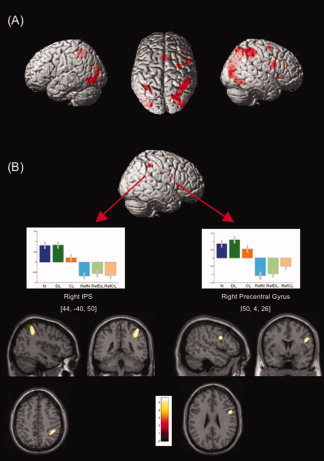
(A) Brain regions activated in the numerosity task (N) compared with its reference. (B) Brain regions activated in the conjunction of the three experimental tasks (N, DL and CL). Upper panel: Statistical parametric maps superimposed on a surface render of the right hemisphere. Middle panel: Contrast estimates for each condition in the right IPS (left) and the right precentral gyrus (right). Lower panel: Right IPS and precentral gyrus foci displayed on sagittal, coronal, and axial slices of the MNI standard brain (all P < 0.05, FWE corrected.)
Table II.
Brain regions showing significant activation in the (a) conjunction of the two length tasks (DL and CL), (b) conjunction of the three experimentals tasks (N, DL and CL), (c) conjunction of N and DL tasks masked exclusively by CL, and (d) conjunction of the three reference tasks (RefN, RefDL, and RefCL)
| Brain regions | L/R | k | x | y | z | t‐Statistic | |
|---|---|---|---|---|---|---|---|
| a | [DL − RefDL] and [CL − RefCL] masked exclusively by [N − RefN] | ||||||
| IPS/inferior parietal lobule | R | 5 | 28 | −40 | 44 | 2.90* | |
| b | [N − RefN] and [DL − RefDL] and [CL − RefCL] | ||||||
| Precentral gyrus | R | 16 | 50 | 4 | 26 | 5.56** | |
| IPS/inferior parietal lobule | R | 19 | 40 | −42 | 48 | 5.36** | |
| IPS/Superior parietal lobule | L | 26 | −40 | −50 | 64 | 2.82* | |
| c | [N − RefN] and [DL − RefDL] masked exclusively by [CL − RefCL] | ||||||
| Middle occipital gyrus | L | 26 | −30 | −80 | 24 | 5.71** | |
| Inferior temporal gyrus | R | 30 | 46 | −60 | −10 | 5.09** | |
| IPS/supramarginal gyrus | L | 25 | −42 | −40 | 42 | 5.54** | |
| d | [RefN − N] and [RefDL − DL] and [RefCL − CL] | ||||||
| Angular gyrus | R | 20 | 58 | −66 | 28 | 5.44** | |
| Precuneus | R | 1,012 | 12 | −54 | 36 | 4.99*** | |
| Middle temporal gyrus | L | 324 | −52 | −62 | 20 | 4.47*** | |
| Middle temporal gyrus | L | 175 | −58 | −46 | 0 | 4.08*** | |
| Middle temporal gyrus | L | 16 | −50 | −20 | 18 | 3.70* | |
| Middle temporal gyrus | R | 61 | 54 | −14 | −20 | 3.62*** | |
| Superior frontal gyrus, medial part | L | 162 | −12 | 46 | 34 | 4.11*** | |
| Superior frontal gyrus, medial part | L | 123 | −16 | 68 | 16 | 3.81*** | |
| Medial orbitofrontal gyrus | L | 162 | −4 | 62 | −8 | 3.86*** |
L, left hemisphere; R, right hemisphere; k, cluster size (number of voxels); x, y, z, stereotaxic coordinates of peak‐height voxels.
P‐values < 0.01 uncorrected.
P‐values < 0.05 FWE corrected for multiple comparisons.
P‐values < 0.001 uncorrected.
Length processing
Contrasting the DL task to its reference revealed a large focus of activation in the right inferior and superior parietal lobules all around the IPS, and other large foci extending from the occipitotemporal junction to the posterior part of the superior parietal lobule, along the dorsal stream (Table Ib). Similarly, although less extended, foci were observed in the left hemisphere. Other activation foci were found in the right frontal lobe, in the precentral gyrus and the insula, and in the SMA. In CL, only two foci were found to be activated in the right hemisphere: one in the IPS (with a local maximum at 40, −42, 48) and one in the precentral gyrus (Table Ic). A small left superior parietal lobule activation only appeared at an uncorrected threshold (P < 0.003). The conjunction between DL and CL, each contrasted to its reference and exclusively masked by N minus its reference, showed no focus of activation at the corrected threshold; a tiny focus (k = 5) was observed in the depth of the right inferior parietal lobule only at an uncorrected threshold (P < 0.003) (Table IIa).
Numerosity and length processing
A conjunction between N, DL and CL, each contrasted to its own reference, revealed the areas commonly involved in numerosity and length processing. Only the two foci observed for CL were found to be activated in all the tasks, one in the IPS and one in the precentral gyrus, both in the right hemisphere. The latter was slightly but not significantly more activated in the two tasks using discrete stimuli (i.e., N and DL; Table IIb and Fig. 4B). A left IPS focus also appeared at an uncorrected threshold (P < 0.003).
Color processing
Finally, the conjunction between the three reference tasks, each contrasted to its own experimental task showed bilateral activation at the occipitoparietal junction and in the middle temporal gyrus (Table IId), corresponding to the processing of colors.
DISCUSSION
In our experience of daily life, numerosity and length are intimately linked, as more objects usually occupy more space. This privileged relationship shows itself in experimental conditions through various facilitation and interference effects [Dempster,1995; Dixon,1978; Dormal and Pesenti,2007; Houdé and Guichart,2001]. Recent theoretical accounts have suggested that numerosity and space may be processed and represented within a common magnitude processing system possibly located in the parietal cortex [Walsh,2003]. Although separate investigations on the cerebral bases of numerosity and spatial processes do converge on the parietal lobes, the precise anatomical overlap, if any, between these two dimensions has not previously been directly assessed. In this study we asked participants to compare the numerosity or the length of two discrete linear arrays of dots, or the length of two continuous black rectangles in an fMRI experiment.
Firstly, our results show the bilateral involvement of the parietal areas in numerosity processing, as already suggested by neuropsychological and neuroimaging studies [e.g., Dehaene and Cohen,1997; Piazza et al.,2004,2006]. They also extend this parietal involvement to the processing of discrete linear arrays of dots. More precisely, we found that the left IPS was activated by both explicit and implicit processing of numerosity, regardless of the judgment (numerosity or length) being performed on the stimuli, as demonstrated by the conjunction between N and DL comparison. It is worth noting that length processing was totally absent from this conjunction since the CL judgment had been used as an exclusive mask. This ensured that the left IPS focus was involved in the numerical aspects of numerosity processing, and not the mandatory intrinsic spatial processing. For the same reason, the IPS activation should not reflect any possible overt visual saccades, which might have been left after contrasting the experimental tasks to their references. This focus is also clearly located more anteriorly than the posterior parietal foci usually associated with the visuospatial processes required to orient attention to the numerically relevant dimension of the stimuli. The very short presentation time used in this experiment (i.e., 650 ms) and the requirement to fixate the central cross throughout the task to avoid eye saccades and scanning the dots make an explicit counting strategy very unlikely to have been used. However, we cannot totally exclude that the displayed numerosities implicitly triggered the verbal numerals system in the left hemisphere, which may be the cause of the observed left‐lateralized activation both in implicit and explicit numerosity judgments. Although probably not specific to numerosity processing, it seems likely that the occipitotemporal and occipitoparietal activations left after length processing has been discarded reflect the modulation of the visuoattentional components that is needed to individualize the dots within the arrays [Corbetta,1998]. This, with the involvement of the frontal areas sustaining attentional control, fits with previous findings on quantifying dots in the same range of numerosities [Sathian et al.,1999].
Second, the activations observed in continuous linear length judgment demonstrate the importance of the right parietal areas in length comparison.2 This fits with the involvement of the right parietal cortex in many space‐related processes such as the orientation of attention [Coull and Nobre,1998], the comparison of sizes [Pinel et al.,2004], and the bisection of lines [Fink et al.,2000]. Neuropsychological studies with brain‐damaged patients and transcranial magnetic stimulation (TMS) experiments corroborate the dominance of the right parietal hemisphere found for the processing of lengths. Patients with right parietal lesions, in addition to spatial neglect, had difficulty with size judgments [Milner and Harvey,1995], length line comparison [Irving‐Bell et al.,1999], and line‐bisection tasks [Marshall and Halligan,1989]. Moreover contralateral visuospatial deficits were observed in healthy subjects after transient disruption of the right parietal cortex induced by focal TMS, as tested in a line‐length judgment task [Fierro et al.,2000,2001].
Finally, numerosity and length processing both rely on the activation of the right IPS and the right precentral gyrus. The right parietal area could be the site of a possible common mechanism or representation for length and numerosity processing, and be involved in both kinds of cognitive estimation. The idea that numerical and nonnumerical magnitudes are represented in overlapping areas of the IPS is supported by single‐cell recording studies showing that, when monkeys perform comparisons of different numerosities or line lengths, some IPS neurons respond to both quantities [Tudusciuc and Nieder,2007]. Interestingly, it has been suggested that this parietal structure in monkeys may be the homologue of the horizontal segment of the IPS in humans, which is found to be activated in judgments of both physical size and numerical magnitude [Pinel et al.,2004]. The fact that there is right parietal activation for both numerosity and length comparisons could at least partly explain the interferences observed in many behavioral studies between the numerical magnitude and the physical size of the stimuli in comparison tasks [Henik and Tzelgov,1982; Pinel et al.,2004], the numerical magnitude and space location in parity judgments [Dehaene et al.,1993], the number of elements and length in numerosity comparison [Houdé,1997; Houdé and Guichart,2001], and numerosity and length cues in Stroop paradigms [Dormal and Pesenti,2007]. Behavioral interference effects between two physical dimensions have been shown to be stronger when they rely on the same neuronal structures [Fias et al.,2001]. The shared right parietal activation could explain why the spatial cues interfered strongly with the processing of numerosity in our Stroop paradigm [Dormal and Pesenti,2007], whereas numerical cues, processed less automatically than length and sustained by bilateral parietal areas, only generated weak interference with length processing. Without the specific time courses of these uni‐ and bilateral activations, it is hard to comment further on the mandatory processing of numerosity and/or length. A recent fMRI study compared the processing of discrete numerosities and continuous quantities, represented by displays of hues with colors changing either abruptly or smoothly in space and time [Castelli et al.,2006]. Discrete numerosity comparison was found to activate the IPS more than continuous quantity comparison. This was interpreted by the authors as indicating two distinct processes. However, this conclusion goes beyond the reported data: the fact that the IPS were activated more by discrete numerosities than by continuous ones does not, of course, mean that they were not activated at all by continuous quantities. Unfortunately, the activations related to continuous quantities alone were not reported by the authors, and, so the possibility that the IPS was also activated, perhaps to a lesser extent, cannot be excluded. Our experiment clearly shows that the right IPS is activated by length processing, in the very areas which underlie the processing of numerosity.
Although the RLs and accuracy of the three comparison tasks had been equated in a pilot study,3 the numerosity‐comparison task turned out to be more difficult than the two length tasks, and the CL comparison was processed faster than the other two tasks during the fMRI session. Moreover, the experimental tasks turned out to be more time consuming and more error prone overall than their reference tasks. As IPS activation shows some modulation as a function of increased task difficulty [Göbel et al.,2004], it can be argued that task complexity made some contribution to the pattern of activation we observed. However, the fact that very similar IPS activations were observed in the absence of an explicit task during passive numerosity changes [Ansari et al.,2006] suggests that response‐selection requirements and task difficulty [Göbel et al.,2004] cannot be the only sources of IPS activation. This, in turn, makes the possibility that task complexity contributed to the pattern of results we observed less plausible. To avoid this problem, future studies should try to ensure a better match in individual performance across tasks, by conducting extensive individual training prior to the experiment.
The idea that various types of magnitudes could be processed and/or represented through the same mechanisms and cerebral structures has recently been explored for physical and numerical magnitudes in grasping‐related tasks [Andres et al.,2004,2008; Badets et al.,2007]; for time, numerosity, or physical size in comparison tasks [Dormal et al.,2008; Oliveri et al.,2008; Xuan et al.,2007]; and for semantic and physical quantities [Cohen Kadosh et al.,2006]. The present results add new evidence to this debate, but is worth noting that the spatial resolution of fMRI is still severely limited in comparison with the invasive electrophysiological techniques used with monkeys. Thus, it is possible that the right IPS activation found here in both discrete (i.e., number of dots) and continuous (i.e., length of lines) magnitude processing might be due to neurons that code specifically for one dimension. Future studies using multivoxel pattern analyses might help to clarify the overlap between representations of numerical and nonnumerical magnitude in the IPS [Ansari,2008]. TMS would be another ideal complementary technique for formulating inferences about the causal relationship between the activity of these regions and the cognitive processes under investigation. By inducing a transient virtual lesion in healthy subjects while performing numerosity or length‐comparison tasks, the necessary and critical contribution of these parietal areas could be directly tested.
Acknowledgements
MP is a research associate at the National Fund for Scientific Research (Belgium). We thank C. Grandin, L. Hermoye, and the Radiodiagnosis Unit at the Cliniques St. Luc (Brussels) for their support during testing.
Footnotes
The results of the training session with nine participants (for technical reasons, the training data from the first five participants could not be used) showed a classical distance effect [Moyer and Landauer,1967] in the three tasks: pairs with a large distance were responded to faster and more accurately than pairs with a small distance (response latencies for large distance = 500 ± 126 ms, small = 601 ± 140 ms, F(1, 8) = 9.92, P < 0.02; percentage of errors for large = 6.3% ± 10.3%, small = 30.6% ± 17.0%, F(1, 8) = 208.18, P < 0.001). This demonstrates that participants actually performed the comparisons using the appropriate dimensions (i.e., numerosity in the numerosity comparison, and length in the discrete and continuous comparisons).
In a previous PET study [Fias et al.,2003], line comparison was only associated with left IPS activation. However, the authors only reported activations present in both line and symbolic number (Arabic numeral) comparisons. This may explain this left hemispheric lateralization.
ANOVAs were performed on the RLs of correct answers and on the error rates during the training session (n = 9), with task (N, DL, or CL) as the within‐subject variable, considering only the distance used in the fMRI experiment. These showed no significant differences between the experimental tasks (RLs for N: 542 ± 93 ms, DL: 615 ± 188 ms, CL: 584 ± 170 ms; F(2, 16) = 1.76, P > 0.2; errors for N: 15.1% ± 12.8%, DL: 27.6% ± 9.9%, CL = 25.1 ± 12.8, F(2, 16) = 3.22, P > 0.06). Note that the training session involved more trials than the fMRI session.
REFERENCES
- Andres M,Davare M,Pesenti M,Olivier E,Seron X ( 2004): Number magnitude and grip aperture interaction. NeuroReport 15: 2773–2777. [PubMed] [Google Scholar]
- Andres M,Ostry DJ,Nicol F,Paus T ( 2008): Time course of number magnitude interference during grasping. Cortex 44: 414–419. [DOI] [PubMed] [Google Scholar]
- Ansari D ( 2008): Effects of development and enculturation on number representation in the brain. Nature Rev Neurosci 9: 278–291. [DOI] [PubMed] [Google Scholar]
- Ansari D,Dhital B ( 2006): Age‐related changes in the activation of the intraparietal sulcus during non‐symbolic magnitude processing: An event‐related functional magnetic resonance imaging study. J Cogn Neurosci 18: 1820–1828. [DOI] [PubMed] [Google Scholar]
- Ansari D,Dhital B,Siong SC ( 2006): Parametric effects of numerical distance on the intraparietal sulcus during passive viewing of rapid numerosity changes. Brain Res 1067: 181–188. [DOI] [PubMed] [Google Scholar]
- Badets A,Andres M,Di Luca S,Pesenti M ( 2007): Number magnitude potentiates action judgements. Exp Brain Res 180: 525–534. [DOI] [PubMed] [Google Scholar]
- Breukelaar JWC,Dalrymple‐Alford JC ( 1998): Timing ability and numerical competence in rats. J Exp Psychol Anim Behav Process 24: 84–97. [DOI] [PubMed] [Google Scholar]
- Cantlon JF,Brannon EM,Carter EJ,Pelphrey KA ( 2006): Functional imaging of numerical processing in adults and 4‐year‐old children. PLoS Biology 4: 844–854. [DOI] [PMC free article] [PubMed] [Google Scholar]
- Castelli F,Glaser DE,Butterworth B ( 2006): Discrete and analogue quantity processing in the parietal lobe: A functional MRI study. PNAS 103: 4693–4698. [DOI] [PMC free article] [PubMed] [Google Scholar]
- Chochon F,Cohen L,van de Moorteele PF,Dehaene S ( 1999): Differential contributions of the left and right inferior parietal lobules to number processing. J Cogn Neurosci 11: 617–630. [DOI] [PubMed] [Google Scholar]
- Cohen Kadosh R,Henik A ( 2006): A common representation for semantic and physical properties: A cognitive‐anatomical approach. Exp Psychol 53: 87–94. [DOI] [PubMed] [Google Scholar]
- Corbetta M ( 1998): Frontoparietal cortical networks for directing attention and the eye to visual location: Identical, independent or overlapping neural systems? PNAS 95: 831–838. [DOI] [PMC free article] [PubMed] [Google Scholar]
- Coull JT,Nobre AC ( 1998): Where and when to pay attention: The neural systems for directing attention to spatial locations and to time intervals as revealed by both PET and fMRI. J Neurosci 18: 7426–7435. [DOI] [PMC free article] [PubMed] [Google Scholar]
- Daurignac E,Houdé O,Jouvent R ( 2006): Negative priming in a numerical Piaget‐like task as evidenced by ERP. J Cogn Neurosci 18: 730–736. [DOI] [PubMed] [Google Scholar]
- Dehaene S,Cohen L ( 1997): Cerebral pathways for calculation: Double dissociation between rote verbal and quantitative knowledge of arithmetic. Cortex 33: 219–250. [DOI] [PubMed] [Google Scholar]
- Dehaene S,Bossini S,Giraux P ( 1993): The mental representation of parity and number magnitude. J Exp Psychol Gen 122: 371–396. [Google Scholar]
- Dehaene S,Dehaene‐Lambertz G,Cohen L ( 1998): Abstract representations of numbers in the animal and human brain. Trends Neurosci 21: 355–361. [DOI] [PubMed] [Google Scholar]
- Dempster FN ( 1995): Interference and inhibition in cognition: An historical perspective In: Dempster FN,Brainerd CJ, editors. Interference and Inhibition in Cognition. New York: Academic Press; pp 3–26. [Google Scholar]
- Dixon P ( 1978): Numerical comparison processes. Mem Cognit 6: 454–461. [DOI] [PubMed] [Google Scholar]
- Dormal V,Pesenti M ( 2007): Numerosity‐length interference: A Stroop experiment. Exp Psychol 54: 289–297. [DOI] [PubMed] [Google Scholar]
- Dormal V,Andres M,Pesenti M ( 2008): Dissociation of numerosity and duration processing in the left intraparietal sulcus: A transcranial magnetic stimulation study. Cortex 44: 462–469. [DOI] [PubMed] [Google Scholar]
- Faillenot I,Sunaert S,Van Hecke P,Orban GA ( 2001): Orientation discrimination of objects and gratings compared: An fMRI study. Eur J Neurosci 13: 585–596. [DOI] [PubMed] [Google Scholar]
- Fias W,Lauwereyns J,Lammertyn J ( 2001): Irrelevant digits affect feature‐based attention depending on the overlap of neural circuits. Cogn Brain Res 12: 415–423. [DOI] [PubMed] [Google Scholar]
- Fias W,Lammertyn J,Reynvoet B,Dupont P,Orban GA ( 2003): Parietal representation of symbolic and non‐symbolic magnitude. J Cogn Neurosci 15: 47–56. [DOI] [PubMed] [Google Scholar]
- Fierro B,Brighina F,Oliveri M,Piazza A,La Bua V,Buffa D,Bisiach E ( 2000): Contralateral neglect induced by right posterior parietal rTMS in healthy subjects. NeuroReport 11: 1519–1521. [PubMed] [Google Scholar]
- Fierro B,Brighina F,Piazza A,Oliveri M,Bisiach E ( 2001): Timing of right parietal and frontal cortex activity in visuo‐spatial perception: A TMS study in normal individuals. NeuroReport 12: 2605–2607. [DOI] [PubMed] [Google Scholar]
- Fink GR,Marshall JC,Shah NJ,Weiss PH,Halligan PW,Grosse‐Ruyken M,Ziemons K,Zilles K,Freund HJ ( 2000): Line bisection judgments implicate right parietal cortex and cerebellum as assessed by fMRI. Neurology 54: 1324–1331. [DOI] [PubMed] [Google Scholar]
- Fink GR,Marshall JC,Gurd J,Weiss PH,Zafiris O,Shah NJ,Zilles K ( 2001): Deriving numerosity and shape from identical visual displays. Neuroimage 13: 46–55. [DOI] [PubMed] [Google Scholar]
- Gitelman DR,Nobre AC,Parrish TB,Labar KS,Kim YH,Meyer JR,Mesulam MM ( 1999): A large‐scale distributed network for covert spatial attention: Further anatomical delineation based on stringent behavioral and cognitive controls. Brain 122: 1093–1106. [DOI] [PubMed] [Google Scholar]
- Göbel S,Johansen‐Berg H,Behrens T,Rushworth MFS ( 2004): Response‐selection‐related parietal activation during number comparison. J Cogn Neurosci 16: 1–17. [DOI] [PubMed] [Google Scholar]
- Henik A,Tzelgov J ( 1982): Is 3 greater than 5: The relation between physical and semantic size in comparison tasks. Mem Cognit 10: 389–395. [DOI] [PubMed] [Google Scholar]
- Houdé O ( 1997): Numerical development: From the infant to the child. Cogn Dev 12: 373–392. [Google Scholar]
- Houdé O,Guichart E ( 2001): Negative priming effect after inhibition of number/length interference in a Piaget‐like task. Dev Sci 4: 119–123. [Google Scholar]
- Irving‐Bell L,Small M,Cowey A ( 1999): A distortion of perceived space in patients with right‐hemisphere lesions and visual hemi‐neglect. Neuropsychologia 37: 919–925. [DOI] [PubMed] [Google Scholar]
- Kaufmann L,Koppelstaetter F,Delazer M,Siedentopf C,Rhomberg P,Golaszewski S,Felber S,Ischebeck A ( 2005): Neural correlates of distance and congruity effects in a numerical Stroop task: An event‐related fMRI study. NeuroImage 25: 888–898. [DOI] [PubMed] [Google Scholar]
- Kosslyn SM,DiGirolamo GJ,Thompson WL,Alpert NM ( 1998): Mental rotation of objects versus hands: Neural mechanisms revealed by positron emission tomography. Psychophysiology 35: 151–161. [PubMed] [Google Scholar]
- Lee KM ( 2000): Cortical areas differentially involved in multiplication and subtraction: A functional magnetic resonance imaging study and correlation with a case of selective acalculia. Ann Neurol 48: 657–661. [PubMed] [Google Scholar]
- Leroux G,Joliot M,Dubal S,Mazoyer B,Tzourio‐Mazoyer N,Houdé O ( 2006): Cognitive inhibition of number/length interference in a Piaget‐like task: Evidence from ERP and fMRI. Hum Brain Map 27: 498–509. [DOI] [PMC free article] [PubMed] [Google Scholar]
- Marshall JC,Halligan PW ( 1989): When right goes left: An investigation of line bisection in a case of visual neglect. Cortex 25: 503–515. [DOI] [PubMed] [Google Scholar]
- Marshall JC,Fink GR ( 2001): Spatial cognition: Where we were and where we are. Neuroimage 14: S2–S7. [DOI] [PubMed] [Google Scholar]
- Milner AD,Harvey M ( 1995): Distortion of size perception in visuospatial neglect. Curr Biol 5: 85–89. [DOI] [PubMed] [Google Scholar]
- Moyer RS,Landauer TK ( 1967): The time required for judgements of numerical inequality. Nature 215: 1519–1520. [DOI] [PubMed] [Google Scholar]
- Nichols T,Brett M,Andersson J,Wager T,Poline JB ( 2005): Valid conjunction inference with the minimum statistic. Neuroimage 25: 653–660. [DOI] [PubMed] [Google Scholar]
- Oldfield RC ( 1971): The assessment and analysis of handedness: The Edinburgh inventory. Neuropsychologia 9: 97–113. [DOI] [PubMed] [Google Scholar]
- Oliveri M,Vicario CM,Salerno S,Koch G,Turriziani P,Mangano R,Chillemi G,Caltagirone C ( 2008): Perceiving numbers alters time perception. Neurosci Lett 438: 308–311. [DOI] [PubMed] [Google Scholar]
- Pesenti M,Thioux M,Seron X,De Volder A ( 2000): Neuroanatomical substrates of Arabic number processing, numerical comparison, and simple addition: A PET study. J Cogn Neurosci 12: 461–479. [DOI] [PubMed] [Google Scholar]
- Piaget J ( 1952): The Child's Conception of Number. New York: Basic Books. [Google Scholar]
- Piazza M,Mechelli A,Butterworth B,Price CJ ( 2002): Are subitizing and counting implemented as separate or functionally overlapping processes? Neuroimage 15: 435–446. [DOI] [PubMed] [Google Scholar]
- Piazza M,Giacomini E,Le Bihan D,Dehaene S ( 2003): Single‐trial classification of parallel pre‐attentive and serial attentive processes using functional magnetic resonance imaging. Proc R Soc Lond B Biol Sci 270: 1237–1245. [DOI] [PMC free article] [PubMed] [Google Scholar]
- Piazza M,Izard V,Pinel P,Le Bihan D,Dehaene S ( 2004): Tuning curves for approximate numerosity in the human intraparietal sulcus. Neuron 44: 547–555. [DOI] [PubMed] [Google Scholar]
- Piazza M,Mechelli A,Price CJ,Butterworth B ( 2006): Exact and approximate judgments of visual and auditory numerosity: An fMRI study. Brain Res 1106: 177–188. [DOI] [PubMed] [Google Scholar]
- Piazza M,Pinel P,Le Bihan D,Dehaene S ( 2007): A magnitude code common to numerosities and number symbols in human intraparietal cortex. Neuron 53: 293–305. [DOI] [PubMed] [Google Scholar]
- Pinel P,Le Clec'HG,van de Moortele PF,Naccache L,Le Bihan D,Dehaene S ( 1999): Event‐related fMRI analysis of the cerebral circuit for number comparison. Neuroreport 10: 1473–1479. [DOI] [PubMed] [Google Scholar]
- Pinel P,Dehaene S,Rivière D,Le Bihan D ( 2001): Modulation of parietal activation by semantic distance in a number comparison task. Neuroimage 14: 1013–1026. [DOI] [PubMed] [Google Scholar]
- Pinel P,Piazza M,Le Bihan D,Dehaene S ( 2004): Distributed and overlapping cerebral representations of number, size, and luminance during comparative judgments. Neuron 41: 983–993. [DOI] [PubMed] [Google Scholar]
- Rossetti Y,Jacquin‐Courtois S,Rode G,Ota H,Michel C,Boisson D ( 2004): Does action make the link between number and space representation? Visuo‐manual adaptation improves number bisection in unilateral neglect. Psychol Sci 15: 426–430. [DOI] [PubMed] [Google Scholar]
- Sathian K,Simon TJ,Peterson S,Patel GA,Hoffman JM,Grafton ST ( 1999): Neural evidence linking visual object enumeration and attention. J Cogn Neurosci 11: 36–51. [DOI] [PubMed] [Google Scholar]
- Schneider W,Eschman A,Zuccolotto A ( 2002): E‐Prime User's Guide. Pittsburgh: Psychology Software Tools Inc. [Google Scholar]
- Simon O,Mangin JF,Cohen L,Le Bihan D,Dehaene S ( 2002): Topographical layout of hand, eye, calculation, and language‐related areas in the human parietal lobe. Neuron 33: 475–487. [DOI] [PubMed] [Google Scholar]
- Takayama Y,Sugishita M,Akiguchi I,Kimura J ( 1994): Isolated acalculia due to left parietal lesion. Arch Neurol 51: 286–291. [DOI] [PubMed] [Google Scholar]
- Thioux M,Pesenti M,Costes N,De Volder A,Seron X ( 2005): Task‐independent semantic activation for numbers and animals. Cogn Brain Res 24: 284–290. [DOI] [PubMed] [Google Scholar]
- Tudusciuc O,Nieder A ( 2007): Neuronal population coding of continuous and discrete quantity in the primate posterior parietal cortex. PNAS 104: 14513–14518. [DOI] [PMC free article] [PubMed] [Google Scholar]
- Venkatraman V,Ansari D,Chee MWL( 2005): Neural correlates of symbolic and non‐symbolic arithmetic. Neuropsychologia 43: 744–753. [DOI] [PubMed] [Google Scholar]
- Vuilleumier P,Ortigue S,Brugger P ( 2004): The number space and neglect. Cortex 40: 399–410. [DOI] [PubMed] [Google Scholar]
- Walsh V ( 2003): A theory of magnitude: Common cortical metrics of time, space and quantity. Trends Cogn Sci 7: 483–488. [DOI] [PubMed] [Google Scholar]
- Xuan B,Zhang D,He S,Chen X ( 2007): Larger stimuli are judged to last longer. J Vis 7: 1–5. [DOI] [PubMed] [Google Scholar]
- Zago L,Pesenti M,Mellet E,Crivello F,Mazoyer B,Tzourio‐Mazoyer N ( 2001): Neural correlates of simple and complex mental calculation. Neuroimage 13: 314–327. [DOI] [PubMed] [Google Scholar]
- Zorzi M,Priftis K,Umilta C ( 2002): Neglect disrupts the mental number line. Nature 417: 138–139. [DOI] [PubMed] [Google Scholar]