Abstract
Functional MRI can be used to assess brain plasticity over time. To confidently attribute changes in activation patterns to cortical plasticity, it is important to establish the stability of cortical activation patterns. Because little is known concerning the stability of somatosensory‐evoked brain responses, we assessed the reproducibility of within‐subject responses in key somatosensory regions [thalamus, primary and secondary cortex (S1, S2)] to tactile and painful stimuli using threshold‐dependent and threshold‐independent analyses. Six subjects underwent four biweekly scanning sessions during which tactile and painful stimuli were applied to the hand. Standard thresholding and voxel counting techniques were compared with a novel threshold‐independent method utilizing percent signal change within the regions of interest. Contralateral S1 and S2 were qualitatively reproducible during tactile stimulation, with overlapping activations >85% of the time. S2 was also highly reproducible during painful stimulation (88%), whereas S1 was less reproducible (44%). However, activation in the thalamus to both tactile and painful stimulation was highly variable. Ipsilateral activation was consistent within S2 but sparse within S1 and thalamus. Deactivations within ipsilateral S1 occurred 48% of the time with tactile stimuli, and 90% of the time with painful stimuli. Within contralaterally activated regions intraclass correlations (ICCs) were very high using the unthresholded method regardless of the type of stimulation, whereas much lower ICCs arose from the thresholded analyses. These data indicate that a threshold‐independent analysis can produce more reproducible outcomes than a standard threshold‐dependent analysis. Hum Brain Mapp, 2009. © 2008 Wiley‐Liss, Inc.
Keywords: pain, touch, reproducibility, fMRI
INTRODUCTION
Serial fMRI is a powerful tool to examine how the brain changes over time in individual subjects. Several groups have used serial fMRI to study cortical plasticity in pathological and nonpathological conditions including stroke, amputation, nerve injury, and learning [Karni et al., 1995; Loubinoux et al., 2003; Manduch et al., 2002; Napadow et al., 2006]. A critical assumption in serial fMRI studies is that task‐evoked brain responses in individual subjects are consistent and stable over time in terms of the response location, volume, and signal intensity. The within‐ and between‐subject stability of cortical activations patterns is thought to be relatively stable in the motor and visual systems, and for language and higher cognitive processes [Cohen and DuBois, 1999; Fernandez et al., 2003; Machielsen et al., 2000; Marshall et al., 2004; McGonigle et al., 2000; Miki et al., 2001a; Tegeler et al., 1999; Wagner et al., 2005; Waldvogel et al., 2000; Wexler et al., 1997; Yetkin et al., 1996]. Although studies focusing on the motor system clearly have a sensory component, the reproducibility of stimulus‐evoked responses to tactile tasks with no motor component, and during painful stimulation is not clear.
The criteria used to define and determine what constitutes an “activation” is a critical factor in interpreting reproducibility data. Yetkin et al [ 1996] investigated test–retest reliability of somatosensory‐evoked cortical activations across two runs within a single scanning session. Although this study provides useful information regarding the within‐session stability of tactile‐related brain responses, the stability of responses over time is not known. Because of our interest in plasticity of the tactile and pain systems, we sought to determine the reproducibility of cortical responses to nonpainful tactile and painful stimuli in brain regions that are common to both systems, namely the sensory‐discriminative regions, which include contralateral thalamus and the contralateral primary and secondary somatosensory cortices (S1 and S2). Because the focus of the study was to quantify tactile‐ and pain‐related responses using simple devices that are routinely used in the clinic, we have not interrogated in detail those cortical areas that are known to be influenced by attention and motivation, such as the anterior cingulate cortex and insula. These areas require more extensive control of attentional resources and such fine attentional controls are unlikely to be included in general clinical imaging assessments.
All fMRI studies rely on predefined criteria of brain responsiveness, but there is no gold standard for choosing these criteria. There are two basic types of statistical approaches that can be used to assess cortical responses over time. The most popular statistical approach is the threshold‐dependent method that is typically based on choosing a statistical threshold with the aim of reaching an overall corrected P value of 0.05. The choice of this threshold is arbitrary and often fairly conservative, which may preclude detecting potentially interesting fMRI signal changes that lie below the chosen threshold. Serial fMRI studies typically determine how activations differ between sessions based on the number of voxels (volume—also known as extent), the intensity of the signal change (peak activation—also known as height), or a combination of both (height × extent) that exceeds the predefined statistical threshold within an anatomically defined region of interest [Davis, 2006].
Reproducibility concerning the number of voxels above a set threshold has been examined by several groups. In one study that examined the stability of the motor and visual systems, voxel counts varied by as much as 750% across four sessions [Cohen and DuBois, 1999]. Another group that also investigated the motor and visual system, found that activation patterns varied by 1,150% for visual stimuli and 433% for motor stimuli in the most variable subject [Waldvogel et al., 2000]. Despite this high level of variability, longitudinal clinical studies still tend to use the number of voxels above threshold as their main measure [Pineiro et al., 2001; Small et al., 2002]. Although these particular studies imply that the motor and visual systems are highly variable, studies utilizing different statistical criteria and response measures have reported stable visual and motor cortical activation patterns. For example, Miki et al. [ 2001a, b ] calculated a reproducibility ratio for the size (R size) and location (R overlap) of activation during visual flash stimuli and found that R size ranged from 0.88 to 0.97 and R overlap ranged from 0.72 to 0.86 [Miki et al., 2001b] (0 = no reproducibility and 1 = perfect reproducibility). Yetkin et al. [ 1996] examined reproducibility in the motor and sensory systems, and based on the ratio of the number of pixels activated in both runs of the task to the number of pixels activated in either run, the activation ratio for exactly the same pixel was 0.57 (where 0 = no reproducibility and 1 = perfect reproducibility), whereas the activation ratio for the same pixel or its nearest neighbor resulted in pixel precision ratios of 0.81 (motor) and 0.82 (sensory) [Yetkin et al., 1996]. These studies highlight the importance of robust and sensitive statistical analysis criteria.
The second type of statistical approach to assess the stability of activations over time is a threshold‐independent method. With this method, the percent signal change is determined for a priori defined regions of interest (ROIs). The advantage of this approach is that consideration is given to all voxels within the ROIs. To our knowledge, no studies have examined the percent signal change using this approach. However, the reliability of percent signal changes measures in a posteriori defined ROIs (i.e. percent signal change averaged across voxels that reached a set threshold) has been examined [Waldvogel et al., 2000]. This method gave more reproducible results than those obtained by voxel counting [Waldvogel et al., 2000].
Therefore, in this study, our main aim was to examine the reproducibility of nonpainful and painful mechanically‐evoked activations in the contralateral thalamus, S1, and S2 using threshold dependent and independent techniques. We also examined the stability of ipsilateral activations and deactivations within these brain regions using the threshold‐dependent method.
METHODS
Subjects
Six right‐handed healthy subjects [3 males, 3 females; 24–52 years old (32 ± 12)] with no history of neurological injury, participated in the study. Handedness was determined using the Edinburgh handedness inventory [Oldfield, 1971]. All subjects gave informed written consent to procedures approved by the University Health Network research ethics board.
Experimental Procedures
Each subject participated in four, biweekly (i.e., every 2 weeks) scanning sessions. Sessions were held at the same time of day, and subjects were instructed not to consume caffeinated beverages for at least 2 h before imaging. Nonpainful mechanical stimuli consisted of brushing the dorsal aspect of the hand at ∼1 Hz with a soft brush. Painful mechanical stimuli were applied to the dorsal aspect of the hand at 1 Hz with a von Frey filament. For each subject, a von Frey filament was chosen before the first scanning session that elicited pain at an intensity of 4 on a scale from 0 (no pain) to 10 (most intense pain imaginable). The same filament was used for subsequent scans. Subjects were asked to rate the pain from 0 to 10 at the end of each run during which the painful stimuli were applied. Stimuli were applied to left and right hands in separate runs, for a total of four runs per session (left and right, noxious and innocuous). The order of runs was held constant across sessions to avoid inconsistent inter‐run interactions. Each run consisted of 20 s stimulation blocks interleaved with 20 s rest blocks, for a total of 12 blocks of stimulation and 13 blocks of rest. The first 6 s (3TRs) of data acquired from each run (total scan time = 8 min 26 s) was discarded to allow for fMRI signal equilibration. Subjects were instructed to keep their eyes closed throughout scanning and to focus on the stimuli.
Data Acquisition
All data was acquired using a 1.5 T MRI system (GE Echospeed) fitted with a standard quadrature head coil. A three‐dimensional high resolution anatomical scan of the whole brain [124 sagittal slices, 24 × 24 cm field of view (FOV), 256 × 256 matrix, 1.5 × 1.07 × 1.07 mm voxels] was acquired with a T1‐weighted 3D spoiled gradient echo (SPGR) sequence (flip angle = 45°, echo time (TE) = 5 ms, repetition time (TR) = 25 ms). fMRI was acquired with a T2*‐weighted one‐shot spiral gradient echo sequence (25 axial slices, FOV = 20 × 20 cm, 64 × 64 matrix, 3.125 × 3.125 × 4 mm voxels, TE = 40 ms, TR = 2,000 ms).
Data Analysis
Data were preprocessed and analyzed using Brainvoyager QX v1.8 (Brain Innovation, Maastricht, the Netherlands). Preprocessing included: motion correction, slice timing correction, linear trend removal, high pass filtering (six cycles per run), and spatial smoothing with a 6 mm FWHM Gaussian kernel. fMRI datasets were interpolated to 3 × 3 × 3 mm3, registered to the anatomical image, and transformed to Talairach space. Voxels are reported as 1 × 1 × 1 mm3. For each subject, a voxel by voxel general linear model analysis (GLM) was performed for each run in each session and activation maps were constructed for the contrast “stimulation minus rest.” Two further analyses were run as mentioned in the following sections.
Thresholded method
Activation maps were thresholded at a corrected value of P < 0.05 (derived from an uncorrected P < 0.0001 and 120 mm3 contiguous voxels as previously reported by Downar et al. [ 2003], and also validated by running a Monte Carlo Simulation with the AlphaSim application implemented in the Analysis of Functional NeuroImages software) and the number of voxels above threshold determined for both contralateral and ipsilateral S1, S2, and thalamus. In addition, the number of deactivated voxels above threshold was also determined. Intraclass correlation coefficients (ICCs) were then derived for the number of voxels above threshold across all four sessions for each subject, task, and stimulation site using the Statistical Package for the Social Sciences v13.0 (SPSS, Chicago). The intraclass correlation coefficient is a measure of reliability that can be used when there are multiple replications of a measurement for each subject [Shrout and Fleiss, 1979]. It is the ratio of the between‐subject variance to the total variance, where total variance is the combination of between‐subject variance and within‐subject variance:
ICCs approaching 1 indicate that the variance between subjects is much greater than the variance within subjects [Johnstone et al., 2005]. Therefore, a value close to 1 indicates good within‐subject reliability. Here we report ICCs that require average absolute agreement between measures and consider ICCs greater than 0.50 with P ≤ 0.05 satisfactorily reproducible [Manoach et al., 2001]. Negative ICC values indicate that there is more variability within than between subjects and therefore indicate unstable within‐subject brain responses.
“Count maps” were constructed for each subject and task to visualize consistent activations across sessions. Construction of the count maps required coding voxels that reached threshold with a value of one, and coding voxels that were below threshold with a value of zero. Subsequently, maps for a given subject, task and location could be summed across all four sessions, resulting in a single map that indicated the number of sessions a particular voxel reached threshold. A separate map was constructed for each subject. In addition, deactivations were displayed on a separate set of count maps in the same format (i.e. separate count maps for each subject, task, and location for significantly deactivated voxels). For visualization clarity, voxels reaching threshold in only one session were not displayed. A score of 100% was assigned if a brain region displayed overlapping activation in four sessions. Likewise, a score of 75% was assigned in cases with overlapping activation in three sessions and cases with two overlapping sessions received a score of 50%. These scores did not consider the extent of activation (i.e., the number of voxels with overlapping activation) because we wished only to quantify whether a particular brain region was qualitatively reproducible.
Unthresholded method
To locate a peak voxel for the placement of a standardized ROI for each individual session a conjunction analysis was performed across all four sessions for each subject and task separately, resulting in four sets of conjunction maps for each subject (left and right, pain and tactile). The peak voxel from each of these maps within the contralateral S1, S2, and thalamus was identified and used for the placement of a 1,000 mm3 ROI within the brain region. The average percent signal change within each of these single subject ROIs (S1, S2, and thalamus) was then extracted for each session separately. ICCs were then calculated to determine the within‐subject reproducibility for each brain region (S1, S2, and thalamus) and stimulus type (pain and tactile). In all cases the peak location was well within the desired anatomical region of interest (see below).
In addition, a three‐way analysis of variance (ANOVA) was performed using SPSS to determine the impact of the side of stimulation (left or right), region of activation (contralateral S1, S2, and thalamus), and type of stimulation (innocuous or noxious). This was done for each dependent variable (i.e., the number of voxels and the percent signal change).
For both analysis methods the boundaries of S1, S2, and thalamus were defined as follows: (1) S1 included voxels within the postcentral gyrus from the most superior axial slices down to a level where the central sulcus and postcentral sulcus were no longer clearly identifiable (i.e., a level at which cortical representation of the face and lips resides); (2) S2 was confined to the region of cortex directly ventral to the primary sensory cortex within the parietal operculum. Anterior and posterior boundaries were identified by drawing a line from the central and postcentral sulci to the lateral sulcus; (3) the thalamus included gray matter bounded laterally by the genu and posterior limb of the internal capsule and medially by the third ventricle. As subsequent analyses were to involve calculation of the number of voxels above a strictly defined threshold or the placement of a defined ROI on a peak voxel (for extraction of the average percent signal change), the definition of the anatomical regions of interest was allowed to be fairly liberal as the subsequent analyses would restrict the analysis to the appropriate brain regions. These boundaries were defined on single subject bases, as opposed to using group average anatomical images, as group maps are extremely blurred and do not provide specific anatomical detail. Furthermore, it was our intention to examine within‐subject reproducibility (not between‐subject reproducibility) and our previous experience has demonstrated considerable anatomical variation between‐subjects (especially for S1) even after Talairaching. Therefore, defining anatomical boundaries on a single subject basis was the most appropriate method for our purposes.
RESULTS
All six subjects successfully completed the four imaging sessions. The Edinburgh Handedness Inventory laterality quotient was 100 for all subjects, indicating that all subjects were strongly right‐handed. Pain ratings reported at the end of each painful run were 3.0 ± 0.7 (range 2–5) and 3.0 ± 0.7 (range 2–5) for stimulation of the right and left hands, respectively. ICCs were calculated to evaluate the stability of pain ratings within an individual across imaging session and the ICC was 0.72 for right hand stimulation and 0.37 for left hand stimulation. Thus, stimulation of the right hand resulted in stable pain ratings, whereas stimulation of the left hand did not. No significant head motion was detected from any subject or run (< 2 mm), therefore all data was included in subsequent analyses.
Thresholded Analysis: Extent of Contralateral Activations
A 3‐way ANOVA was used to examine the impact of stimulus type (tactile vs. pain), brain region (S1, S2, and thalamus), and side of stimulation (left and right) on the extent of contralateral activations (i.e., number of voxels). Interestingly, a significant interaction was found between the type of stimulus and brain region [F (2, 275) = 24.48, P < 0.05]. As can be seen in Figure 1A, the extent of activation within the contralateral S1 was significantly greater during tactile stimulation than during painful stimulation (P < 0.001, t = 6.23). However, the extent of activation within the contralateral S2 and thalamus were not statistically different for the tactile and painful stimuli [P = 0.51, t = 0.65 (s2); P = 0.58, t = 0.55 (thalamus)]. No significant main effect was observed for the side of stimulation [F (1, 275) = 0.24, P = 0.63; Fig. 1B], indicating that stimulation of the left and right hands resulted in the same extent of activation in the contralateral S1, S2, and thalamus.
Figure 1.
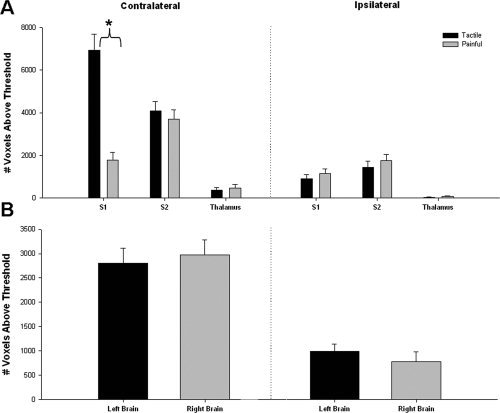
Extent of tactile‐ and pain‐evoked activations (thresholded method). (A) The mean (± SE) number of voxels (across all subjects) activated during tactile (filled bars) or painful stimulation (gray bars) is displayed for each brain region. There was a significant interaction between brain region and type of stimulation; post hoc testing revealed the presence of significantly more activated voxels in the contralateral S1 during tactile stimulation than during painful stimulation (P < 0.001; t = 6.23; denoted by asterisk), but there were no significant differences in the number of voxels activated by tactile versus painful stimulation in the contralateral S2 and thalamus or in ipsilateral regions (P > 0.05). (B) The mean (± SE) number of voxels activated over all left (filled bars) or right (gray bars) brain regions are displayed. Three‐way ANOVAs indicated no significant main effect of stimulation side. (S1, primary somatosensory cortex; S2, secondary somatosensory cortex).
Unthresholded Analysis: Contralateral Activation Strength
A 3‐way ANOVA was also used to determine the impact of stimulus type, brain region and side on the strength (i.e., percent signal change) of activations. This analysis revealed the same pattern of region X stimulation interaction [F (2, 275) = 20.83, P < 0.05; Fig. 2A] as the activation analysis noted earlier. As shown in Figure 2A, the percent signal change within the contralateral S1 was significantly greater during tactile stimulation than during painful stimulation (P < 0.001, t = 5.94), whereas the contralateral S2 and thalamus were activated similarly for both types of stimulation [P = 0.57, t = 0.56 (S2); P = 0.42, t = −0.81(thalamus)]. No significant main effect was observed for the side of stimulation [F (1, 275) = 0.41, P = 0.52; Fig. 2B].
Figure 2.
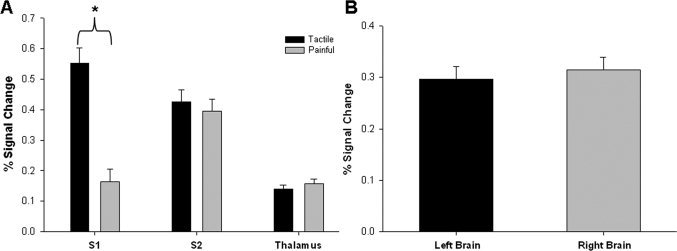
Strength of tactile‐ and pain‐evoked activations (unthresholded method). (A) The mean (±SE) % signal change within each predefined ROI is displayed for tactile and painful stimulation. The 3‐way ANOVA detected a significant interaction between brain region and stimulation type. The asterisk indicates greater percent signal change in the contralateral S1 during tactile stimulation than painful stimulation (post hoc testing: P < 0.001; t = 5.94). No difference was detected for contralateral S2 or thalamus (P > 0.05). (B) Mean (± SE) % signal change is displayed for left and right brain regions; there was no significant effect of side. (S1, primary somatosensory cortex; S2, secondary somatosensory cortex).
Stability of Contralateral Responses (Thresholded Method)
The incidence of activation across sessions for each subject is depicted in the count maps shown in Figure 3 (for tactile stimulation) and Figure 4 (for painful stimulation) and quantified in Table I. Reproducibility was qualitatively characterized by the presence of activation across two, three, or four sessions within each brain region for each subject. For each subject, type of stimulation, and brain region a score out of four sessions (or 100%) is given (see Table I). This score merely describes the occurrence of overlapping activation and does not take into account the extent or strength of activation. As shown in Figure 3 and summarized on the left side of Table I, tactile‐evoked activations within the contralateral S1 and S2 were highly reproducible, with overlapping suprathreshold responses detected 93.8% and 85.4% of the time, respectively. However, consistently activated thalamic voxels in two or more sessions occurred only 10.4% of the time. Pain‐evoked activations [Table I (right side) and Fig. 4] across all subjects and sessions were consistent for the contralateral S2 with an incidence of overlapping activation of 87.5%. In contrast, pain‐evoked activation within the contralateral S1 and thalamus was highly variable showing consistent activation only 43.8% and 8.3% of the time, respectively. Figure 5 shows the number of voxels activated on average, across all subjects, for each session, brain region, and type of stimulation. It can be seen in Figure 5A that tactile stimulation activated more voxels within S1, on average, than painful stimulation. In contrast, tactile and painful stimulation activated a similar volume within contralateral S2 and thalamus. Repeated measures ANOVA performed across sessions did not identify significant between‐session differences for any brain region or type of stimulation.
Figure 3.
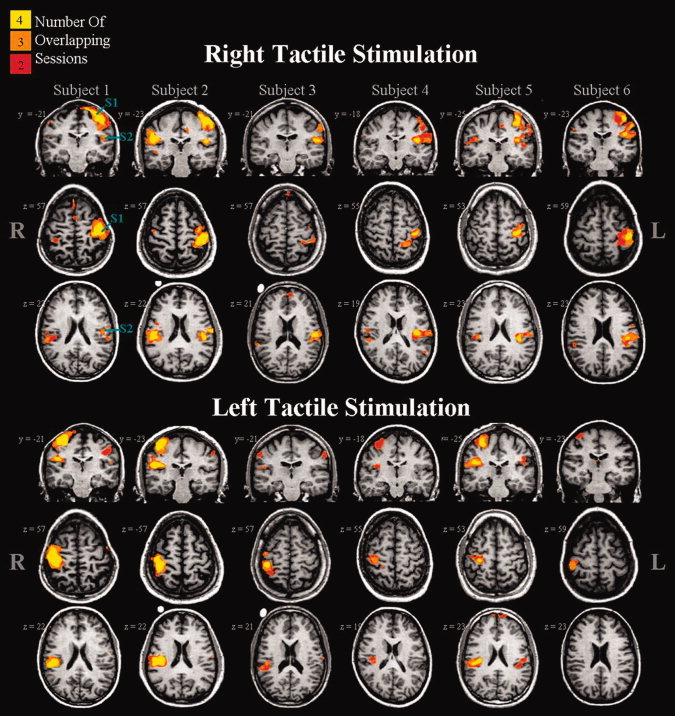
Count maps of tactile‐evoked activations shown for each of the six subjects. Each column represents one subject. Stimuli were applied to the dorsal aspect of the right (top panel) or left (bottom panel) hand. Individual subject and session maps were thresholded at a corrected P = 0.05. The colour code (yellow, orange, red) is used to designate those voxels activated in four, three or two sessions. Brain regions active in only one session are not shown.
Figure 4.
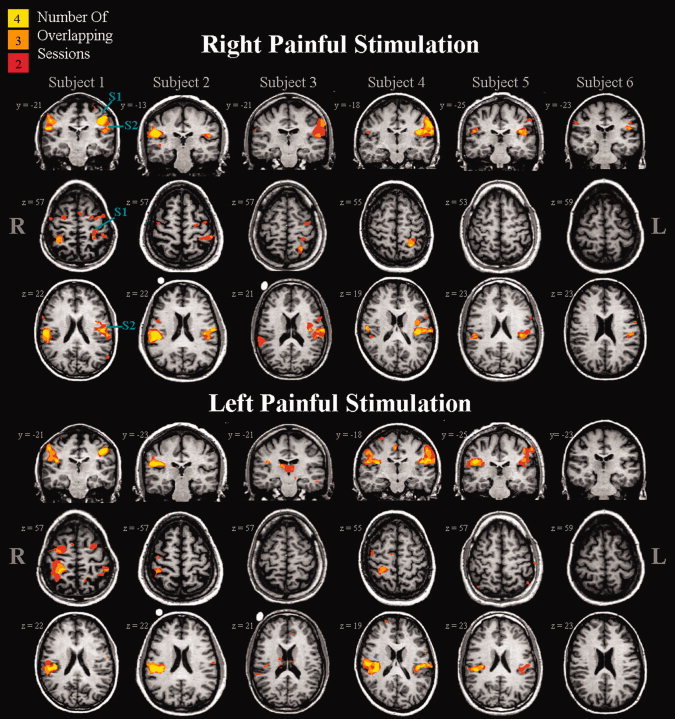
Count maps of pain‐evoked activation shown for each of the six subjects. Each column represents one subject. Stimuli were applied to the dorsal aspect of the right (top panel) or left (bottom panel) hand. Individual subject and session maps were thresholded at a corrected P = 0.05. The colour code (yellow, orange, red) is used to designate those voxels activated in four, three, or two sessions. Brain regions active in only one session are not shown.
Table I.
Summary of count maps: A qualitative examination of the thresholded analysis within contralateral brain regions
| Tactile stimulation | Painful stimulation | |||||||||||
|---|---|---|---|---|---|---|---|---|---|---|---|---|
| S1 | S2 | Thalamus | S1 | S2 | Thalamus | |||||||
| L | R | L | R | L | R | L | R | L | R | L | R | |
| Subject 1 | 100 (4) | 100 (4) | 75 (3) | 100 (4) | 75 (3) | 0 (0) | 50 (2) | 100 (4) | 100 (4) | 100 (4) | 50 (2) | 50 (2) |
| Subject 2 | 100 (4) | 100 (4) | 100 (4) | 100 (4) | 0 (0) | 0 (0) | 75 (3) | 75 (3) | 100 (4) | 100 (4) | 0 (0) | 0 (0) |
| Subject 3 | 75 (3) | 100 (4) | 100 (4) | 75 (3) | 0 (0) | 0 (0) | 50 (2) | 0 (0) | 100 (4) | 75 (3) | 0 (0) | 0 (0) |
| Subject 4 | 100 (4) | 75 (3) | 100 (4) | 75 (3) | 0 (0) | 0 (0) | 100 (4) | 75 (3) | 100 (4) | 100 (4) | 0 (0) | 0 (0) |
| Subject 5 | 100 (4) | 100 (4) | 100 (4) | 100 (4) | 0 (0) | 0 (0) | 0 (0) | 0 (0) | 100 (4) | 100 (4) | 0 (0) | 0 (0) |
| Subject 6 | 100 (4) | 75 (3) | 100 (4) | 0 (0) | 0 (0) | 50 (2) | 0 (0) | 0 (0) | 75 (3) | 0 (0) | 0 (0) | 0 (0) |
| Average | 95.8 | 91.7 | 95.8 | 75.0 | 12.5 | 8.3 | 45.8 | 41.7 | 95.8 | 79.2 | 8.3 | 8.3 |
| Average (L&R) | 93.8 | 85.4 | 10.4 | 43.8 | 87.5 | 8.3 | ||||||
For this table S1, S2, and Thalamus are the cROIs. L and R are the sides.
Values indicate the number of sessions in which the same voxels were activated within a specified contralateral brain region over two or more sessions. A score of 100 indicates activation of one or more voxels across all four sessions for a given brain region, and a score of zero indicates no overlapping activation (in any voxels) for that brain region. (cROI, contralateral region of interest; S1, primary somatosensory; S2, secondary somatosensory cortices).
Figure 5.
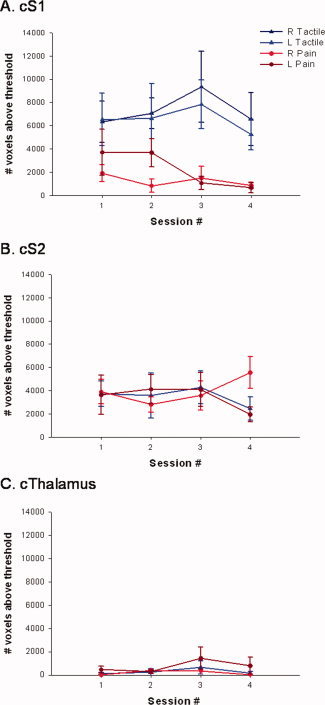
Effect of time on the number of contralateral voxels above threshold. Mean (± SE) number of voxels activated above threshold for sessions 1–4 within contralateral S1 (A), S2 (B), and thalamus (C). Each graph displays the bi‐weekly averages for right and left, tactile and painful stimulation.
ICCs were calculated to quantify the within subject reproducibility of the suprathreshold extent of activation (based on the voxel counts) for tactile‐ and pain‐evoked responses (see Table II). Tactile stimulation produced activation in the contralateral S1 across all four sessions with ICCs of 0.781 (P < 0.01) for left S1 and 0.823 (P < 0.01) for right S1 indicating good within‐subject reproducibility. Painful stimulation resulted in ICCs of −0.224 (P = 0.56) for left S1 and 0.650 (P = 0.05) for right S1. Therefore, when considering the number of voxels above threshold, pain‐evoked responses elicited by stimulation of the left hand resulted in stable brain responses within a subject, whereas stimulation of the right side did not. Tactile and painful stimulation evoked stable brain responses in the contralateral S2 for left hand stimulation only. Finally, contralateral thalamus displayed stability during noxious stimulation of the left hand; however, painful stimulation of the right hand and tactile stimulation of either the left or right side did not result in stable thalamic responses (see Table II for ICCs and their associated P‐values).
Table II.
Intraclass class correlation coefficients (ICC) for tactile and painful stimulation calculated for thresholded and unthresholded analysis methods within contralateral brain regions

|
ICCs approaching one indicated high within subject reproducibility. P‐values < 0.05 indicate ICCs that are significantly different from zero (i.e., good reproducibility) and the gray‐shaded boxes designate ICCs deemed reproducible. Negative ICC values indicate that there is more variability within subjects than between subjects, and are therefore not reproducible. To emphasize the apparent advantage of the unthresholded analysis technique over the thresholded method the average ICCs for tactile and painful stimulation are displayed in the bottom row. (cROI, contralateral region of interest; S1, primary somatosensory; S2, secondary somatosensory cortices).
Stability of Contralateral Responses (Unthresholded Method)
Figure 6 displays the percent signal change for each session averaged across all subjects within a given brain region (Figs. 6A–C for S1, S2, and thalamus, respectively) and type of stimulation. As with the number of voxels above threshold analysis, the average percent signal change was significantly higher in the contralateral S1 during tactile, as opposed to painful stimulation. This difference was not observed within contralateral S2 and thalamus. Furthermore, no significant between‐session differences were identified using a repeated measures ANOVA that was performed separately for each brain region and type of stimulation.
Figure 6.
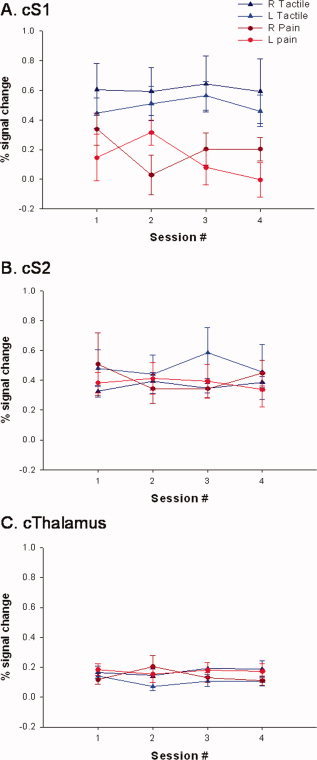
Effect of time on % signal change within contralateral, positively activated brain regions. Mean (± SE) percent signal change across sessions 1–4 within contralateral S1 (A), S2 (B), and thalamus (C). Each graph displays the bi‐weekly averages for right and left, tactile and painful stimulation.
The ICCs calculated for the unthresholded technique (i.e., percent signal change measures) are also displayed in Table II. In all but one case, ICCs demonstrate a high degree of within subject reproducibility (i.e., ICCs > 0.74). Tactile stimulation resulted in ICCs > 0.74 for all contralateral brain regions (S1, S2, and thalamus). ICCs were slightly lower, on average, during painful stimulation than during tactile stimulation [average ICC = 0.886 (tactile) vs. = 0.768 (painful stimulation)]. During painful stimulation the left S1 was the only brain region that was not found to be reproducible; however the ICC for this brain region was 0.490, indicating a modest amount of stability.
For comparison, Figure 7 shows the average ICCs for both types of stimulation (tactile vs. painful) and analysis techniques (number of voxels above threshold and percent signal change). Although not significant [F (3, 20) = 2.81, P = 0.066)] the percent signal change analysis led to higher ICCs on average than the number of voxels above threshold analysis, indicating more reproducible results with this analysis technique.
Figure 7.
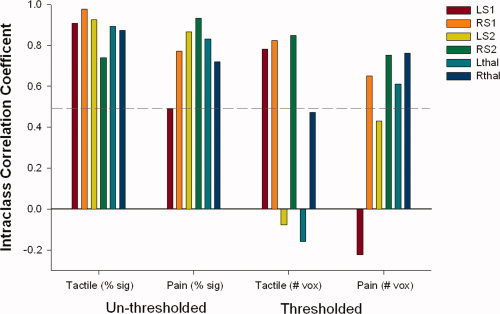
Intraclass correlation coefficients (ICCs) for percent signal change (unthresholded analysis) and number of voxels above threshold (thresholded analysis) are shown for tactile and painful stimulation. ICCs close to 1 indicate strong within subject reproducibility. Hatched line demarcates ICCs of 0.50; ICCs above 0.50 are considered satisfactorily reproducible. Negative ICCs indicate that between‐subject variance is greater than within and are therefore not reproducible. Note: Only ICCs related to activation of contralateral ROIs are shown for the direct comparison of unthresholded and thresholded techniques (i.e. ICCs from ipsilateral activations and deactivations are not shown).
Additional Findings on the Ipsilateral Side: Activations and Deactivations
A 3‐way ANOVA was used to examine the influence of stimulus type, brain regions, and side of stimulation on the number of voxels above threshold in brain regions ipsilateral to stimulation. No significant main effects were observed for the side of stimulation; [F (1, 275) = 1.75, P = 0.19; Fig. 1B] or type of stimulation [F (1, 275) = 1.41, P = 0.24; Fig. 1A]. However, a significant main effect of brain region [F (2, 275) = 31.16, P < 0.001] was observed. Post hoc testing revealed that more voxels were activated in the ipsilateral S1 and S2 compared with the ipsilateral thalamus [P < 0.001, t = 6.7 (S1 vs. thal); P < 0.001, t = 10.5 (S2 vs. thal)]; no differences in the number of voxels above threshold were observed between ipsilateral S1 and S2 [P = 0.10, t = 2.9(S1 vs. S2)].
Tactile‐ and pain‐evoked deactivations were often observed in the ipsilateral S1, but rarely if at all in S2, thalamus or contralateral S1 (see Fig. 9). Therefore, we determined the impact of stimulation type and side of stimulation on the number of deactivated voxels in ipsilateral S1 using a two‐way ANOVA. A significant main effect of stimulation type was found [F (1, 92) = 19.91, P < 0.001; Fig. 8A] such that painful stimulation elicited significantly more ipsilateral deactivation that tactile stimulation [P < 0.001, t = 6.31]. There was no significant main effect of the side of stimulation [F (1, 92) = 1.52, P = 0.22; Fig. 8B].
Figure 9.
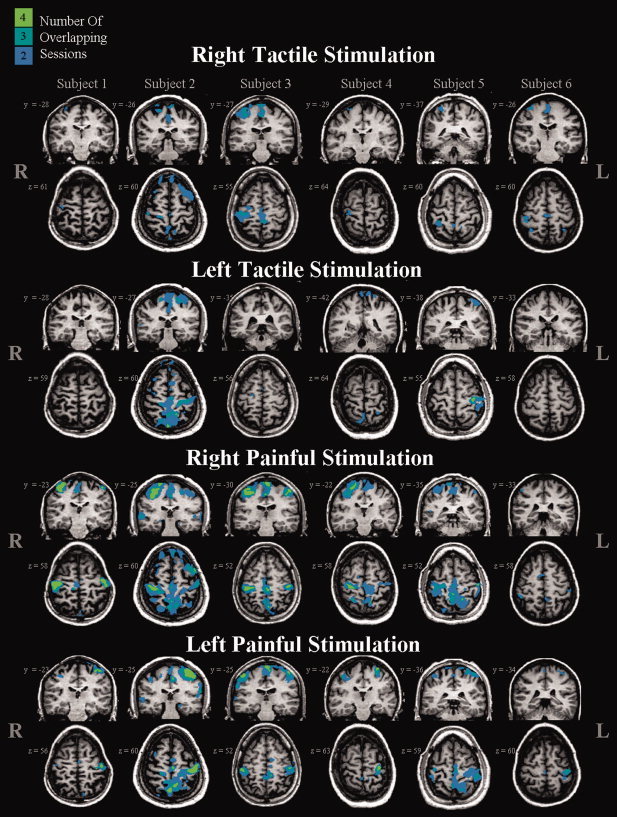
Count maps of deactivations elicited by tactile and painful stimulation are shown for each of the six subjects. Each column represents one subject. Stimuli were applied to the dorsal aspect of the right or left hand. Individual subject and session maps were thresholded at a corrected P = 0.05. The colour code (green, turquoise, blue) is used to designate those voxels deactivated in four, three, or two sessions. Brain regions active in only one session are not shown.
Figure 8.
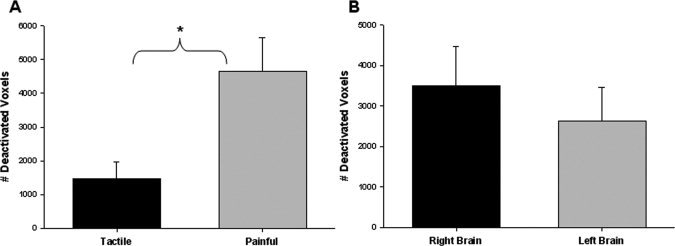
Extent of tactile‐ and pain‐evoked deactivations within ipsilateral S1 (thresholded method). (A) The mean (± SE) number of voxels (across all subjects) deactivated during tactile or painful stimulation is displayed for S1. A two‐way ANOVA identified a significant main effect of task such that painful stimulation elicited more deactivated voxels in the ipsilateral S1 than tactile stimulation (P < 0.001, t = 6.31). (B). The mean (± SE) number of voxels deactivated over all left or right brain regions is displayed. The 2‐way ANOVA indicated no significant main effect of stimulation side. (S1, primary somatosensory cortex).
The count maps created to display contralateral activations (Figs. 3 and 4) also display consistently activated voxels within ipsilateral ROIs. Table III qualitatively displays the presence of activation across two, three, or four sessions within each ipsilateral brain region for each subject. For each subject, type of stimulation, and brain region a score out of four sessions (or 100%) is given. Regardless of the type of stimulation, repeatable activation was found within the right ipsilateral S2 71% of the time. The left ipsilateral S2 was active in response to painful stimulation 50% of the time, whereas tactile stimulation only elicited consistent activation in this brain region 33% of the time (Table III). Ipsilateral S1 demonstrated very little activation, with only one subject demonstrating any consistently activated voxels. Furthermore, the ipsilateral thalamus was not consistently activated during either type of stimulation for any subject.
Table III.
Summary of count maps: A qualitative examination of the thresholded analysis within ipsilateral brain regions
| Tactile stimulation | Painful stimulation | |||||||||||
|---|---|---|---|---|---|---|---|---|---|---|---|---|
| S1 | S2 | Thalamus | S1 | S2 | Thalamus | |||||||
| R | L | R | L | R | L | R | L | R | L | R | L | |
| Subject 1 | 50 (2) | 0 (0) | 75 (3) | 50 (2) | 0 (0) | 0 (0) | 100 (4) | 100 (4) | 100 (4) | 50 (2) | 0 (0) | 0 (0) |
| Subject 2 | 0 (0) | 0 (0) | 100 (4) | 50 (2) | 0 (0) | 0 (0) | 0 (0) | 0 (0) | 100 (4) | 50 (2) | 0 (0) | 0 (0) |
| Subject 3 | 0 (0) | 0 (0) | 50 (2) | 50 (2) | 0 (0) | 0 (0) | 0 (0) | 0 (0) | 50 (2) | 0 (0) | 0 (0) | 0 (0) |
| Subject 4 | 0 (0) | 0 (0) | 50 (2) | 0 (0) | 0 (0) | 0 (0) | 0 (0) | 0 (0) | 100 (4) | 100 (4) | 0 (0) | 0 (0) |
| Subject 5 | 0 (0) | 0 (0) | 50 (2) | 50 (2) | 0 (0) | 0 (0) | 0 (0) | 0 (0) | 75 (3) | 100 (4) | 0 (0) | 0 (0) |
| Subject 6 | 0 (0) | 0 (0) | 50 (2) | 0 (0) | 0 (0) | 0 (0) | 0 (0) | 0 (0) | 0 (0) | 0 (0) | 0 (0) | 0 (0) |
| Average | 8.3 | 0 | 70.8 | 33.3 | 0 | 0 | 16.7 | 16.7 | 70.8 | 50 | 0 | 0 |
| Average (L&R) | 4.2 | 52.1 | 0 | 16.7 | 60.4 | 0 | ||||||
For this table S1, S2, and thalamus are the iROIs; and L and R are the sides.
Values indicate the number of sessions in which the same voxels were activated within a specified ipsilateral brain region over two or more sessions. A score of 100 indicates activation of one or more voxels across all four sessions for a given brain region, and a score of zero indicates no overlapping activation (in any voxels) for that brain region. (iROI, ipsilateral region of interest; S1, primary somatosensory; S2, secondary somatosensory cortices).
Count maps were also created to display the incidence of deactivation in the ipsilateral S1 (the brain region that was most consistently deactivated across subjects, tasks and sessions) (see Fig. 9). Consistent deactivations within ipsilateral S1 were observed during tactile stimulation 48.0% of the time (Table IV). Painful stimulation was found to elicit consistent ipsilateral deactivations within S1 89.6% of the time.
Table IV.
Summary of count maps: A qualitative examination of the thresholded analysis for ipsilateral deactivation of the primary sensory cortex
| Ipsilateral deactivations in S1 | ||||
|---|---|---|---|---|
| Tactile | Painful | |||
| R | L | R | L | |
| Subject 1 | 50 (2) | 0 (0) | 100 (4) | 100 (4) |
| Subject 2 | 75 (3) | 75 (3) | 100 (4) | 100 (4) |
| Subject 3 | 75 (3) | 0 (0) | 100 (4) | 100 (4) |
| Subject 4 | 50 (2) | 0 (0) | 100 (4) | 100 (4) |
| Subject 5 | 75 (3) | 100 (0) | 75 (3) | 75 (3) |
| Subject 6 | 75 (3) | 0 (0) | 75 (3) | 50 (2) |
| Average | 66.7 | 29.2 | 91.7 | 87.5 |
| Average (L&R) | 48.0 | 89.6 | ||
Values indicate the number of sessions in which the same voxels were deactivated within ipsilateral S1 over two or more sessions. A score of 100 indicates deactivation of one or more voxels across all four sessions, and a score of zero indicates no overlapping deactivation (in any voxels) (iS1, ipsilateral primary somatosensory cortex).
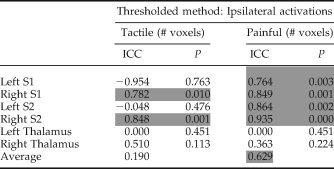
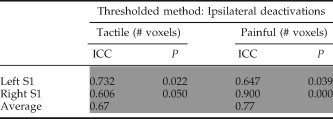
ICCs were calculated to assess the within‐subject stability of ipsilateral activations and deactivations [see Table V (ipsilateral activations) and Table VI (ipsilateral deactivation with S1)]. During tactile stimulation only the right S1 and S2 demonstrated stable ipsilateral activations with ICCs of 0.78 and 0.85, respectively. During painful stimulation both left and right S1 and S2 demonstrated stable within subject activations, with an average ICC = 0.85 across these four regions (see Table V). The thalamus was not consistently activated and this resulted in low ICCs. For deactivation in the ipsilateral S1 both tactile and painful stimulation lead to stable within subject ICCs, with an overall average ICC = 0.72 (see Table VI).
Table V.
Intraclass class correlation coefficients (ICC) for tactile and painful stimulation calculated for the number of voxels above threshold (thresholded analysis) within ipsilateral brain regions
|
ICC approaching one indicated high within subject reproducibility. P‐values < 0.05 indicate ICCs that are significantly different from zero (i.e., good reproducibility) and the gray shaded boxes designate ICCs deemed reproducible. Negative ICC values indicate that there is more variability within subjects than between subjects, and are therefore not reproducible. S1, primary somatosensory; S2, secondary somatosensory cortices.
Table VI.
Intraclass class correlation coefficients (ICC) for tactile and painful stimulation calculated for the number significantly deactivated voxels (thresholded analysis) within ipsilateral S1
|
ICC approaching one indicated high within subject reproducibility. P‐values < 0.05 indicate ICCs that are significantly different from zero (i.e., good reproducibility) and the gray shaded boxes designate ICCs deemed reproducible. (S1, ipsilateral primary somatosensory cortex).
DISCUSSION
In this study we determined the within‐subject reproducibility of tactile‐ and pain‐evoked brain responses in healthy subjects with both a standard thresholded approach and a threshold‐independent analysis. The results highlight several main findings: (1) Tactile stimulation evokes robust and reproducible contralateral cortical activations, whereas pain‐evoked activations are less reliable. (2) A threshold‐independent analysis can uncover more reproducible tactile‐ and pain‐related responses (based on ICCs) than the standard method of thresholding and voxel counting. (3) Tactile stimuli evoke stronger and larger activations within S1 compared with painful stimuli. (4) Tactile and painful stimulation elicit smaller and less reliable activation within ipsilateral ROIs in the S1, S2, and thalamus. (5) Ipsilateral deactivation of S1 occurs fairly consistently with tactile stimulation, and is further enhanced, in terms of frequency and extent of activation, with painful stimulation. Furthermore, these ipsilateral deactivations have high ICCs indicating good within‐subject reproducibility.
The reproducibility of fMRI data has been investigated in response to motor, visual, language, and cognitive stimuli [Cohen and DuBois, 1999; Fernandez et al., 2003; Machielsen et al., 2000; Marshall et al., 2004; McGonigle et al., 2000; Miki et al., 2001a; Tegeler et al., 1999; Wagner et al., 2005; Waldvogel et al., 2000; Wexler et al., 1997; Yetkin et al., 1996]. In general these systems were found to be “satisfactorily reproducible” [Wagner et al., 2005]; however, the choice of an appropriate index of activation can lead to different conclusions. For example, substantial variability has been demonstrated in studies that have examined the measure “number of voxels above threshold”. However, if other measures, such as “percent signal change” within a thresholded region of interest, are utilized reproducible outcomes are attained [Waldvogel et al., 2000]. This variability in the number of suprathreshold voxels may be related to differences in background noise which could directly effect statistical calculations. For example an increase in the variance results in smaller t‐scores, which could render a voxel active in one imaging session but inactive in another session. There are several potential sources of noise such as the variation because of scanner shimming, partial volume effects, and patient motion, attention, arousal, and habituation [Cohen and DuBois, 1999; McGonigle et al., 2000; Wagner et al., 2005]. In our study head motion was determined to be within an acceptable range (<2 mm for all subjects across all sessions). An attempt to maintain a stable level of arousal and attention was made by ensuring that scanning was performed at the same time of day for each subject over repeated sessions and by limiting caffeine intake prior to scanning. However, although scanner performance was not measured to determine if intersession variance could be attributed to instability in data acquisition, this possibility is unlikely as several brain regions demonstrated excellent reproducibility with high ICCs.
In an attempt to monitor subjective pain from one session to the next, pain ratings were acquired at the end of each painful imaging run. ICCs revealed that the pain ratings for stimulation of the right hand were stable, whereas pain ratings for stimulation of the left were not. Rosier et al. [ 2002] studied the reproducibility of pain measurements over four repeated testing sessions with painful thermal stimuli. The authors reported session‐to‐session variations in pain ratings on the order of 1–1.5 points (on a scale from 0 to 10) depending on whether brief or prolonged heat pain was applied [Rosier et al., 2002]. In our study, ICCs indicated that pain ratings were not consistent when the left hand was stimulated. However, examination of individual pain ratings demonstrates that no subject had session‐to‐session variability greater than 1.5 VAS points. Furthermore, because average pain ratings were 3 ± 0.7 for both left and right hands with a range across subjects of 2–5, it is likely that this small spread combined with the small sample size (six subjects) resulted in unstable ICCs.
Imaging studies of somatosensation employing electrical stimulation, vibration, proprioception, and touch [Blankenburg et al., 2003; Davis et al., 1998; Disbrow et al., 2001; Hlushchuk and Hari, 2006; Moore and Schady, 2000] have consistently reported activation in the contralateral S1 and S2. Although it was not our intention to directly compare tactile and pain related activations, our findings of less pronounced pain‐related activation in S1 compared with tactile activations add to the growing body of literature that debate whether S1 is the primary sensory‐discriminative cortical area for pain. Arguably, our finding could be slightly confounded by the difference in surface area stimulated as the brush extended over a somewhat larger surface area than the von Frey stimuli. However, previous imaging studies have also noted inconsistent activation of this region with painful stimuli [Bushnell et al., 1999]. Furthermore, although nociceptive neurons do exist within the primate S1, the number of cells identified are small and are far outnumbered by tactile encoding neurons [Kenshalo and Isensee, 1983; Kenshalo et al., 1988, 2000] (for a discussion of these issues see see [Davis, 2003]). However, support of a role for S1 in nociception comes from a recent meta‐analysis that combined multiple imaging modalities to find S1 activation in ∼75% of imaging studies [Apkarian et al., 2005].
This study also has important implications for protocol design. It has become common practice in fMRI studies to contrast the condition of interest with a second condition that lacks the specific attribute under investigation. For example, in a pain experiment a non‐noxious tactile “baseline” may be contrasted against the pain‐related stimuli to reveal brain regions responding to pain. However, if a tactile stimulus results in greater activation than the noxious stimulus the resulting map may reveal no activation or deactivations. Therefore an appropriate task‐free baseline is required (see Davis, 2003 and Davis, 2006 for a review of these issues).
Studies of cortical plasticity in human and animal studies have demonstrated that additional ipsilateral brain areas become active following a wide range of interventions such as peripheral nerve deafferentation and during recovery from stroke [Lindberg et al., 2007; Pelled et al., 2007]. Thus, ipsilateral responses, be it activations or deactivations, and an understanding of their stability in healthy controls may be important for a complete understanding of plasticity in pathological and nonpathological conditions. Currently, there is some debate as to the involvement of ipsilateral S1 and S2 during contralateral sensory stimulation in healthy controls. Several recent studies have reported ipsilateral activations and deactivations following unilateral tactile stimulation of the hand and/or face. For example, a recent study by Blatow et al. [ 2007] demonstrated ipsilateral S1 and S2 activation 67 and 100% of the time in response to pneumatically driven tactile stimulation of digits 1 and 2 [Blatow et al., 2007]. While we found scant consistent ipsilateral S1 activations, ipsilateral S2 was found to be consistently active 50–60% of the time regardless of the type of stimulation. One interesting finding was the deactivation of the ipsilateral S1 evoked by tactile stimulation ∼50% of the time, and by painful tactile stimulation nearly 90% of the time. Moreover, the ICCs corresponding to these painful and tactile deactivations within ipsilateral S1 demonstrated very good within‐subject reproducibility (ICCs > 0.6). A recent study by Kastrup et al. [ 2008] also identified negative BOLD signals within ipsilateral S1, elicited by electrical median nerve stimulation, in eight out of nine subjects [Kastrup et al., 2008]. Furthermore, Hlushchuk and Hari [ 2006], identified ipsilateral deactivations within the primary sensory cortex following pneumatic tactile stimulation. The authors attribute these deactivations to transcallosal inhibition [Hlushchuk and Hari, 2006]. Additionally, these authors reported contralateral deactivation of the primary motor cortex [Hlushchuk and Hari, 2006]. Although it was not our aim to specifically investigate this brain region we also observed deactivation of contralateral motor cortex during painful stimulation. One could speculate that these deactivations are related to an attempt to suppress withdrawal movements, as painful stimuli elicit the desire to withdraw the limb from the stimulus.
To date, thresholded analysis techniques have been the standard in fMRI data processing. Using this method the number of voxels above threshold or the mean percent signal change within the suprathreshold region of interest can be interrogated. The disadvantage of this method is that a fairly conservative P‐value is usually implemented. Any data below this threshold is discarded which can lead to false negatives. The other option is to use a threshold‐independent technique, such as the unthresholded method described in this article. This method assesses the percent signal change within an anatomically or functionally defined region of interest. The disadvantage of this technique is that the results may be influenced by the size of the designated ROI; larger ROIs may result in a “wash‐out” effect where the signal is diluted with the signal of the entire ROI. Thus consideration must be given to choice of size and location of the ROI. Furthermore, the lack of thresholding may lead to increased type 1 errors. The advantage of the unthresholded method is that no arbitrary threshold is required and no data is discarded. Therefore, one can examine changes over time within subthreshold responsive portions of the ROI.
In this study, we demonstrated that the unthresholded method produces higher ICCs than standard thresholding and voxel counting, indicating that in healthy controls the choice of an unthresholded data analysis technique leads to more reproducible results than with standard thresholding and voxel counting. We also identified ipsilateral deactivations evoked by tactile stimulation and (more profoundly) by painful mechanical stimulation.
Acknowledgements
The authors thank Mr. Geoff Pope for his technical expertise in constructing the “count map” format and Drs. Adrian Crawley and David Seminowicz for their scientific and technical advice. Karen D. Davis is a Canada Research Chair in Brain and Behavior.
REFERENCES
- Apkarian AV,Bushnell MC,Treede RD,Zubieta JK ( 2005): Human brain mechanisms of pain perception and regulation in health and disease. Eur J Pain 9: 463–484. [DOI] [PubMed] [Google Scholar]
- Blankenburg F,Ruben J,Meyer R,Schwiemann J,Villringer A ( 2003): Evidence for a rostral‐to‐caudal somatotopic organization in human primary somatosensory cortex with mirror‐reversal in areas 3b and 1. Cereb Cortex 13: 987–993. [DOI] [PubMed] [Google Scholar]
- Blatow M,Nennig E,Durst A,Sartor K,Stippich C ( 2007): fMRI reflects functional connectivity of human somatosensory cortex. Neuroimage 37: 927–936. [DOI] [PubMed] [Google Scholar]
- Bushnell MC,Duncan GH,Hofbauer RK,Ha B,Chen JI,Carrier B ( 1999): Pain perception: Is there a role for primary somatosensory cortex? Proc Natl Acad Sci USA 96: 7705–7709. [DOI] [PMC free article] [PubMed] [Google Scholar]
- Cohen MS,DuBois RM ( 1999): Stability, repeatability, and the expression of signal magnitude in functional magnetic resonance imaging. J Magn Reson Imaging 10: 33–40. [DOI] [PubMed] [Google Scholar]
- Davis KD ( 2003): Neurophysiological and anatomical considerations in functional imaging of pain. Pain 105: 1–3. [DOI] [PubMed] [Google Scholar]
- Davis KD ( 2006): Recent advances and future prospects in neuroimaging of acute and chronic pain. Future Neurol 1: 203–213. [Google Scholar]
- Davis KD,Kwan CL,Crawley AP,Mikulis DJ ( 1998): Functional MRI study of thalamic and cortical activations evoked by cutaneous heat, cold, and tactile stimuli. J Neurophysiol 80: 1533–1546. [DOI] [PubMed] [Google Scholar]
- Disbrow E,Roberts T,Poeppel D,Krubitzer L ( 2001): Evidence for interhemispheric processing of inputs from the hands in human S2 and PV. J Neurophysiol 85: 2236–2244. [DOI] [PubMed] [Google Scholar]
- Downar J,Mikulis DJ,Davis KD ( 2003): Neural correlates of the prolonged salience of painful stimulation. Neuroimage 20: 1540–1551. [DOI] [PubMed] [Google Scholar]
- Fernandez G,Specht K,Weis S,Tendolkar I,Reuber M,Fell J,Klaver P,Ruhlmann J,Reul J,Elger CE ( 2003): Intrasubject reproducibility of presurgical language lateralization and mapping using fMRI. Neurology 60: 969–975. [DOI] [PubMed] [Google Scholar]
- Hlushchuk Y,Hari R ( 2006): Transient suppression of ipsilateral primary somatosensory cortex during tactile finger stimulation. J Neurosci 26: 5819–5824. [DOI] [PMC free article] [PubMed] [Google Scholar]
- Johnstone T,Somerville LH,Alexander AL,Oakes TR,Davidson RJ,Kalin NH,Whalen PJ ( 2005): Stability of amygdala BOLD response to fearful faces over multiple scan sessions. Neuroimage 25: 1112–1123. [DOI] [PubMed] [Google Scholar]
- Karni A,Meyer G,Jezzard P,Adams MM,Turner R,Ungerleider LG ( 1995): Functional MRI evidence for adult motor cortex plasticity during motor skill learning. Nature 377: 155–158. [DOI] [PubMed] [Google Scholar]
- Kastrup A,Baudewig J,Schnaudigel S,Huonker R,Becker L,Sohns JM,Dechent P,Klingner C,Witte OW ( 2008): Behavioral correlates of negative BOLD signal changes in the primary somatosensory cortex. Neuroimage 41: 1364–1371 [DOI] [PubMed] [Google Scholar]
- Kenshalo DR Jr.,Isensee O ( 1983): Responses of primate SI cortical neurons to noxious stimuli. J Neurophysiol 50: 1479–1496. [DOI] [PubMed] [Google Scholar]
- Kenshalo DR Jr.,Chudler EH,Anton F,Dubner R ( 1988): SI nociceptive neurons participate in the encoding process by which monkeys perceive the intensity of noxious thermal stimulation. Brain Res 454: 378–382. [DOI] [PubMed] [Google Scholar]
- Kenshalo DR,Iwata K,Sholas M,Thomas DA ( 2000): Response properties and organization of nociceptive neurons in area 1 of monkey primary somatosensory cortex. J Neurophysiol 84: 719–729. [DOI] [PubMed] [Google Scholar]
- Lindberg PG,Schmitz C,Engardt M,Forssberg H,Borg J ( 2007): Use‐dependent up‐ and down‐regulation of sensorimotor brain circuits in stroke patients. Neurorehabil Neural Repair 21: 315–326. [DOI] [PubMed] [Google Scholar]
- Loubinoux I,Carel C,Pariente J,Dechaumont S,Albucher JF,Marque P,Manelfe C,Chollet F ( 2003): Correlation between cerebral reorganization and motor recovery after subcortical infarcts. Neuroimage 20: 2166–2180. [DOI] [PubMed] [Google Scholar]
- Machielsen WC,Rombouts SA,Barkhof F,Scheltens P,Witter MP ( 2000): FMRI of visual encoding: Reproducibility of activation. Hum Brain Mapp 9: 156–164. [DOI] [PMC free article] [PubMed] [Google Scholar]
- Manduch M,Bezuhly M,Anastakis DJ,Crawley AP,Mikulis DJ ( 2002): Serial fMRI of adaptive changes in primary sensorimotor cortex following thumb reconstruction. Neurology 59: 1278–1281. [DOI] [PubMed] [Google Scholar]
- Manoach DS,Halpern EF,Kramer TS,Chang Y,Goff DC,Rauch SL,Kennedy DN,Gollub RL ( 2001): Test‐retest reliability of a functional MRI working memory paradigm in normal and schizophrenic subjects. Am J Psychiatry 158: 955–958. [DOI] [PubMed] [Google Scholar]
- Marshall I,Simonotto E,Deary IJ,Maclullich A,Ebmeier KP,Rose EJ,Wardlaw JM,Goddard N,Chappell FM ( 2004): Repeatability of motor and working‐memory tasks in healthy older volunteers: Assessment at functional MR imaging. Radiology 233: 868–877. [DOI] [PubMed] [Google Scholar]
- McGonigle DJ,Howseman AM,Athwal BS,Friston KJ,Frackowiak RS,Holmes AP ( 2000): Variability in fMRI: An examination of intersession differences. Neuroimage 11: 708–734. [DOI] [PubMed] [Google Scholar]
- Miki A,Liu GT,Englander SA,Raz J,van Erp TG,Modestino EJ,Liu CJ,Haselgrove JC ( 2001a): Reproducibility of visual activation during checkerboard stimulation in functional magnetic resonance imaging at 4 Tesla. Jpn J Ophthalmol 45: 151–155. [DOI] [PubMed] [Google Scholar]
- Miki A,Raz J,Englander SA,Butler NS,van Erp TG,Haselgrove JC,Liu GT ( 2001b): Reproducibility of visual activation in functional magnetic resonance imaging at very high field strength (4 Tesla). Jpn J Ophthalmol 45: 1–4. [DOI] [PubMed] [Google Scholar]
- Moore CE,Schady W ( 2000): Investigation of the functional correlates of reorganization within the human somatosensory cortex. Brain 123(Pt 9): 1883–1895. [DOI] [PubMed] [Google Scholar]
- Napadow V,Kettner N,Ryan A,Kwong KK,Audette J,Hui KK ( 2006): Somatosensory cortical plasticity in carpal tunnel syndrome‐a cross‐sectional fMRI evaluation. Neuroimage 31: 520–530 [DOI] [PubMed] [Google Scholar]
- Oldfield RC ( 1971): The assessment and analysis of handedness: The Edinburgh inventory. Neuropsychologia 9: 97–113. [DOI] [PubMed] [Google Scholar]
- Pelled G,Chuang KH,Dodd SJ,Koretsky AP ( 2007): Functional MRI detection of bilateral cortical reorganization in the rodent brain following peripheral nerve deafferentation. Neuroimage 37: 262–273. [DOI] [PMC free article] [PubMed] [Google Scholar]
- Pineiro R,Pendlebury S,Johansen‐Berg H,Matthews PM ( 2001): Functional MRI detects posterior shifts in primary sensorimotor cortex activation after stroke: Evidence of local adaptive reorganization? Stroke 32: 1134–1139. [DOI] [PubMed] [Google Scholar]
- Rosier EM,Iadarola MJ,Coghill RC ( 2002): Reproducibility of pain measurement and pain perception. Pain 98: 205–216. [DOI] [PubMed] [Google Scholar]
- Shrout PE,Fleiss JL ( 1979): Intraclass correlations: uses in assessing rater reliability. Psychol Bull 86: 420–428. [DOI] [PubMed] [Google Scholar]
- Small SL,Hlustik P,Noll DC,Genovese C,Solodkin A ( 2002): Cerebellar hemispheric activation ipsilateral to the paretic hand correlates with functional recovery after stroke. Brain 125: 1544–1557. [DOI] [PubMed] [Google Scholar]
- Tegeler C,Strother SC,Anderson JR,Kim SG ( 1999): Reproducibility of BOLD‐based functional MRI obtained at 4 T. Hum Brain Mapp 7: 267–283. [DOI] [PMC free article] [PubMed] [Google Scholar]
- Wagner K,Frings L,Quiske A,Unterrainer J,Schwarzwald R,Spreer J,Halsband U,Schulze‐Bonhage A ( 2005): The reliability of fMRI activations in the medial temporal lobes in a verbal episodic memory task. Neuroimage 28: 122–131. [DOI] [PubMed] [Google Scholar]
- Waldvogel D,van GP,Immisch I,Pfeiffer C,Hallett M ( 2000): The variability of serial fMRI data: Correlation between a visual and a motor task. Neuroreport 11: 3843–3847. [DOI] [PubMed] [Google Scholar]
- Wexler BE,Fulbright RK,Lacadie CM,Skudlarski P,Kelz MB,Constable RT,Gore JC ( 1997): An fMRI study of the human cortical motor system response to increasing functional demands. Magn Reson Imaging 15: 385–396. [DOI] [PubMed] [Google Scholar]
- Yetkin FZ,McAuliffe TL,Cox R,Haughton VM ( 1996): Test‐retest precision of functional MR in sensory and motor task activation. AJNR Am J Neuroradiol 17: 95–98. [PMC free article] [PubMed] [Google Scholar]


