

Abstract
Pain is a complex experience subserved by an extended network of brain areas. However, the functional integration among these brain areas, i.e., how they interact and communicate to generate a coherent pain percept and an adequate behavioral response is largely unknown. Here, we used magnetoencephalography to investigate functional integration among pain‐related cortical activations in terms of Granger causality and compared it with tactile‐related activations. The results show causal influences of primary somatosensory cortex on secondary somatosensory cortex for tactile‐related but not for pain‐related activations, which supports the proposition of a partially parallel organization of pain processing in the human brain. Furthermore, during a simple reaction time task, the strength of causal influences between somatosensory areas but not the latencies between activations correlated significantly with the speed of reaction times. These findings show how the analysis of functional integration complements traditional analyses of electrophysiological data and provides novel and behaviorally relevant information about the organization of the human pain system. Hum Brain Mapp, 2009. © 2009 Wiley‐Liss, Inc.
Keywords: pain, tactile, Granger causality, connectivity, somatosensory cortices, magnetoencephalography, cutaneous laser stimulation
INTRODUCTION
Pain is an exceptional and highly subjective sensory experience. It provides vital sensory information and initiates a complex cascade of cognitive, affective and motor processes to evaluate, respond to and cope with physical threat. Accordingly, research during the last decades has revealed an extended network of brain areas related to different aspects of pain [Bushnell and Apkarian, 2006; Craig, 2003; Tracey and Mantyh, 2007; Willis and Westlund, 2004]. This network essentially comprises the primary (S1) and secondary (S2) somatosensory cortices, the insular cortex, the anterior cingulate cortex (ACC) and prefrontal areas.
However, comparatively little is known about the functional integration [Friston, 2002] within this network, i.e., how different parts of the network connect and interact to generate a coherent percept and an adequate behavioral response. Traditional electrophysiological approaches inferred possible routes of information flow from the temporal order of activations. The results of these studies showed nearly simultaneous pain‐evoked activations in S1, S2 and ACC [Frot et al., 2008; Ohara et al., 2004; Ploner et al., 1999], which differ from more sequential activation patterns in other modalities and suggest a partly parallel organization of pain processing in the human brain. Other studies applied coherence analyses and showed pain‐related changes in functional connectivity between brain areas related to pain [Llinas et al., 1999; Ohara et al., 2006, 2008; Sarnthein and Jeanmonod, 2008]. However, temporal sequences and correlations do not directly imply information on causal relationships between neural activations. Recent methodological advances now allow us to characterize the causality between neuronal activations more directly in terms of effective connectivity [Baccala and Sameshima, 2001; Friston et al., 2003; Kaminski et al., 2001; McIntosh and Gonzalez‐Lima, 1994; Roebroeck et al., 2005]. One of the underlying concepts is Granger causality [Granger, 1969] which is based on the assumption that a signal X 1 causes a signal X 2 if previous values of X 1 help to predict future values of X 2. Only recently, a related method has been applied to the human pain system [Weiss et al., 2008] showing pain‐related causal interactions between medial and lateral centroparietal areas.
Here, we further investigated functional integration within the human pain system by applying Partial directed coherence (PDC) [Baccala and Sameshima, 2001], a frequency domain extension of Granger causality, to single trials. Using magnetoencephalography (MEG), we determined causal influences between neural activations during a simple reaction time task to painful stimuli and compared them with tactile‐related activations. Our single trial based approach implies a sensitivity of the analysis to phase‐locked as well as to nonphase‐locked neuronal phenomena. The results show different causality patterns for pain and touch providing support for a partially parallel organization of pain processing in the human brain. Moreover, the strength of causal influences correlated significantly with the speed of reaction times to painful stimuli. These findings show how understanding functional integration among brain areas provides behaviorally relevant information about the representation of pain in the human brain.
METHODS
Twelve healthy male subjects with a mean age of 30 years (range 22–39 years) participated in the study. Informed consent was obtained from all subjects before participation. The study was approved by the local ethics committee and conducted in conformity with the declaration of Helsinki. Two subjects had to be excluded from the analysis due to an extremely low signal‐to‐noise ratio. Thus, analysis was based on 10 subjects. Evoked responses to painful and nonpainful stimuli have been reported in a previous analysis of the experimental data [Ploner et al., 2006b].
Procedure
In a simple reaction time experiment each 60 painful and nonpainful stimuli were randomly applied to the right hand. The interstimulus interval was varied between 6 and 10 seconds. Subjects were instructed to react as fast as possible to each stimulus by pressing a button with the index finger of the left hand. Before the experiment a practice block of at least 20 stimuli was performed.
Stimulation
Painful stimuli were applied to the dorsum of the right hand by using cutaneous laser stimulation, which selectively activates nociceptive Aδ‐ und C‐afferents (for review see [Treede, 2003]). The laser device was a Tm:YAG‐laser (Carl BAASEL Lasertechnik, Starnberg, Germany) with a wavelength of 2,000 nm, a pulse duration of 1 ms and a spot diameter of 6 mm. The laser beam was led through an optical fiber into the recording room. Stimulation site was slightly changed within an area of 4 × 3 cm after each stimulus. Applied stimulus intensity was twice pain threshold intensity which resulted in stimulus intensities between 550 and 700 mJ evoking moderately painful sensations. Mean pain rating on a numerical rating scale from 0 to 10 with end points “no pain” and “worst possible pain” was 3.5.
Tactile stimuli were constant voltage electrical pulses of 0.3 ms duration delivered to the middle and end phalanx of the right index finger by using ring electrodes. Stimulus intensity was adjusted to twice detection threshold intensity, i.e. 12–16 V, thus inducing clear and consistent nonpainful sensations.
The present comparison of the functional integration among pain‐related and tactile‐related cortical activations essentially depends on the selective activation of peripheral nociceptive and tactile pathways. However, since it is conceptually impossible to activate the different pathways selectively by using the same mode of stimulation, we have applied cutaneous laser stimuli and transcutaneous electrical stimuli. Cutaneous laser stimuli were applied to the dorsum of the right hand which yields robust cortical responses and allows to slightly change the stimulation site after each stimulus to avoid tissue damage. Electrical stimuli were applied to the finger to yield an optimum signal‐to‐noise ratio of tactile responses. Thus, these modes and sites of stimulation were chosen to selectively activate the nociceptive and tactile pathways and to yield cortical responses with an optimum signal‐to‐noise ratio.
Recordings and Analysis
Subjects were comfortably seated with eyes closed in a magnetically shielded room. Environmental noise was masked by white noise applied to both ears.
Reaction times to painful and tactile stimuli were calculated as latency between stimulus application and button press. Reaction times shorter than 100 ms or longer than 800 ms were discarded. Mean reaction times were calculated and outliers below or above two standard deviations of the mean were discarded.
Cortical activity was recorded with a Neuromag‐122 whole‐head neuromagnetometer containing 122 planar SQUID gradiometers. Signals were digitized at 1,020 Hz, high‐pass filtered at 1 Hz and visually inspected for artifacts. Contaminated epochs were excluded, leaving a minimum of 49 trials per subject and condition.
Locations of somatosensory and motor cortices were obtained from a spatiotemporal source model [Hämäläinen et al., 1993]. To this end, data were averaged with respect to application of painful and nonpainful stimuli, respectively. Primary (S1) and secondary (S2) somatosensory cortices were localized from these stimulus‐evoked responses. Primary motor cortex (M1) was localized based on movement‐evoked responses averaged with respect to button presses. Sources of evoked responses were modeled as equivalent current dipoles identified during clearly dipolar field patterns. Only sources accounting for more than 85% of the local field variance were accepted. Source locations, orientations and strengths were calculated within a realistic head model (boundary‐element model) of each subject's head determined from the individual magnetic resonance images acquired on a 1.5‐T Siemens‐Magnetom. For further details on the source localization procedure please refer to [Hämäläinen et al., 1993]. Individual locations of responses were transformed to normalized Talairach space and group mean Talairach coordinates were calculated. For visualization group mean locations were transposed on a standard brain using AFNI/SUMA software (National Institute of Mental Health, Bethesda, MD; available at: http://afni.nimh.nih.gov/afni).
Time‐courses of activity in S1, bilateral S2 and M1 with respect to stimulus application were computed by using a linearly constrained minimum variance beamformer [Gross et al., 2001; Sekihara et al., 2001]. Analysis of time‐courses was based on modality‐specific locations of tactile and pain‐related responses as obtained from the spatiotemporal source model (see above). The usage of modality‐specific locations of responses accounts for differences between locations of pain‐evoked and tactile‐evoked responses [Kanda et al., 2000, Ploner et al., 2000, 2006b] and, thus, allows for a valid comparison between the modes of stimulation. Data of each single trial were cut into 1,500 ms segments, running from 500 ms before the stimulus until 1,000 ms after the stimulus. We applied a bandstopfilter (fourth‐order Butterworth filter, stopband 33–36 Hz) to remove a well‐known laboratory artifact. The powerline artifact was removed by estimating the 50, 100 and 150 Hz fluctuations by means of a discrete Fourier transform and subtracting these estimated fluctuations. Finally, the mean value was subtracted from each of the segments, to remove the DC‐offset.
PDC analysis of Granger causality was applied to the data based on multivariate autoregressive (MVAR) models computed from single trials. In order to compute MVAR model coefficients, data were downsampled to 250 Hz. Subsequently, we applied a sliding window (100 ms, Hanning‐tapered) in steps of 20 ms. For each window, single trial data were concatenated and MVAR model coefficients were computed, using the Vieira‐Morf algorithm in the Biosig‐toolbox [Schlogl and Supp, 2006] with a model order of 12. Specifically, the first 100 ms window contained data from −500 ms to −400 ms before the stimulus. The 100 ms data window from all trials were concatenated and subjected to the computation of MVAR coefficients. Next, MVAR coefficients were computed for the second window that covered data between −480 ms and −380 ms before the stimulus. The 100 ms window was, thus, iteratively shifted across the whole time interval from 500 ms before the stimulus until 1,000 ms after the stimulus. The 100 ms sliding window implies that responses are integrated over the length of the window which accounts for possible differences in latency jitter between responses to tactile and painful stimuli. The model coefficients were Fourier‐transformed to obtain the frequency specific transfer functions. We computed the transfer functions for frequencies between 0 and 100 Hz in steps of 1 Hz, for each time window. These functions were used to compute time–frequency representations (TFR) of local power spectra, as well as the PDC spectra between all combinations of local activity. Power spectra and PDC spectra were expressed as relative change with respect to a prestimulus baseline from 260 to 150 ms before stimulus onset. We obtained a variance estimate across trials by applying a jackknife procedure. We recomputed the powerspectra and PDC spectra on a leave‐one‐out basis, and used the resulting variance estimate to z‐transform the PDC spectra.
Statistics were done on the group level by using a nonparametric permutation test, using a cluster‐based test statistic to control the false alarm rate. The individual z‐transformed PDC spectra were pooled across subjects. The null‐hypothesis to be tested was that the pooled z‐transformed change in PDC was equal to 0. We obtained a reference distribution by repeating the following steps multiple times. We swapped the sign of the z‐transformed PDC for random subsets of subjects before pooling. The resulting TFR spectra were thresholded and cluster‐based test‐statistics were computed by summing the suprathreshold time–frequency points which were continuous in time and/or frequency. For each of the randomizations, we added the cluster with the highest value to the reference distribution. The a priori threshold was computed to yield 5% suprathreshold time–frequency points across all virtual channels and randomizations. The clusters in the actually observed data were tested against this reference distribution.
Individual peaks of PDC as a measure of the efficiency of communication were correlated with individual reaction times by calculating Pearson's correlation coefficients. Due to the limited number of trials, no intraindividual correlations between PDC and reaction times or time binned trials are reported.
RESULTS
Laser stimuli yielded moderately painful pinprick‐like sensations with a mean rating of 3.5, mean reaction time was 394 ms. Electrical stimuli elicited clear and consistent nonpainful sensations, mean reaction time was 365 ms. The longer reaction times to painful than to tactile stimuli are due to the lower conduction velocity of nociceptive peripheral pathways (10–20 m/s) compared with tactile pathways [Meyer et al., 2006; Vallbo et al., 1979].
Figure 1 shows locations and time‐courses of evoked neuromagnetic responses during the simple reaction time paradigm. Painful and nonpainful tactile stimuli applied to the right hand‐evoked activations of the left, contralateral, S1 and the bilateral S2 cortices. Pain‐evoked S1 activations were located more medially and posteriorly than tactile‐evoked activations as shown in previous studies which directly compared locations of responses with painful and tactile stimuli [Kanda et al., 2000, Ploner et al., 2000, 2006b]. The button press with the left index finger yielded additional activation of the right M1 cortex. No further activations were consistently observed across subjects. Time‐courses show typical response patterns with simultaneous pain‐evoked activations of contralateral S1 and S2, followed by activations of ipsilateral S2 and M1 whereas nonpainful tactile stimuli sequentially activated S1, contralateral S2, ipsilateral S2 and M1. These results replicate the well‐known spatiotemporal patterns of responses to painful [Kakigi et al., 2005] and tactile [Hari and Forss, 1999] stimuli and provide an elementary neural network subserving simple reaction times to painful and tactile stimuli.
Figure 1.
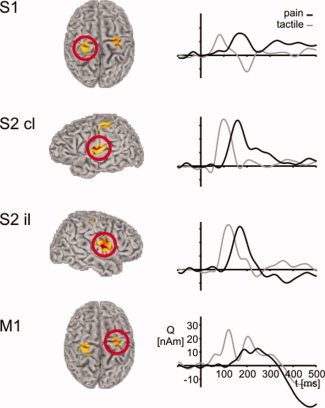
Group mean locations and time‐courses of evoked cortical activations during the simple reaction time paradigm. Locations are group mean normalized locations of equivalent current dipoles (ECD). Time‐courses were computed using a linearly constrained minimum variance beamformer applied to the ECD locations. Mean locations of pain‐related activations are −30, −34, 65 (contralateral S1), −52, −4, 18 (contralateral S2), 50, −8, 15 (ipsilateral S2) and 27, −17, 56 (ipsilateral M1 [contralateral to button press]). Time‐courses of pain‐related activations (black lines) are compared with tactile‐related activations (grey lines). All time‐courses are calculated with respect to stimulus application. Mean coordinates of tactile‐related activations (which, for the sake of clarity, are not shown) are −46, −23, 58 (contralateral S1), −56, −14, 21 (contralateral S2), 49, −10, 20 (ipsilateral S2), 31, −21, 57 (ipsilateral M1).
Next, we investigated functional integration within the network comprising S1, bilateral S2 and M1. We calculated PDC as a measure of feedforward causal influences of S1 on contralateral S2, of contralateral S2 on ipsilateral S2 and of ipsilateral S2 on M1. Figure 2 shows time–frequency representations of PDC averaged across trials and subjects. The plots show increases of causal influences at latencies between 100 and 300 ms and at frequencies below 10 Hz. In the tactile domain, these increases were observed in all three connections indicating a serial information flow from S1 via contralateral S2 and ipsilateral S2 to M1. Cluster analysis confirmed the statistical significance of these increases. In contrast, painful stimuli did not yield a significant increase of causal influences of S1 on contralateral S2 but only between contralateral S2, ipsilateral S2 and M1. The lack of causal influence of S1 on S2 suggests an independent activation of these areas which is well compatible with the proposition of a parallel activation of these areas in human pain processing.
Figure 2.
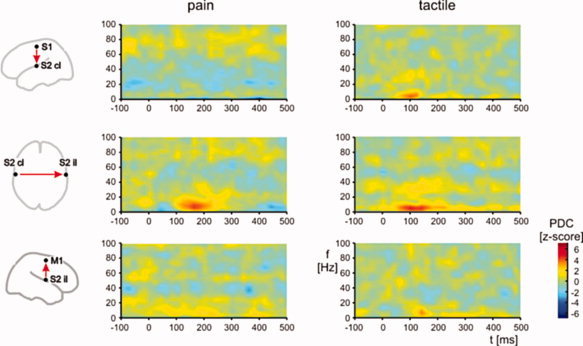
Time–frequency representations of Partial directed coherence (PDC) as a measure of causal influences between brain areas averaged across trials and subjects. The plots show causal influences between S1 and contralateral S2 (S2 cl), S2 cl and ipsilateral S2 (S2 il), and S2 il and primary motor cortex (M1) as a function of time and frequency. Left and right columns show PDC for pain‐related and tactile‐related activations, respectively. Each pair‐wise PDC computation accounted for activity of all four areas. Significance of causal influences was determined performing cluster analyses (see Methods for details).
Additionally, we tested whether the efficiency of functional integration among brain areas relates to differences in behavior. We therefore correlated individual reaction times with the individual strengths of causal influences between S1 and contralateral S2, contralateral S2 and ipsilateral S2 and between ipsilateral S2 and M1. The results show a significant correlation between reaction times and causal influences of contralateral S2 on ipsilateral S2 for both modalities (see Fig. 3) suggesting that a high efficiency of communication between these brain areas allows for fast behavioral responses to painful and tactile stimuli. Correlations for other connections were not statistically significant (S1 → contralateral S2, pain r = −0.37, p = 0.29, tactile r = −0.18, P = 0.61; ipsilateral S2 → M1, pain r = 0.57, P = 0.09, tactile r = −0.08, P = 0.81). No significant correlation was observed between reaction times and latencies between evoked actications of contralateral S2 and ipsilateral S2 (pain, r = 0.37, P = 0.30; tactile: r = 0.42, P = 0.23). Correlation analyses thus show that the strength of causal influences provides behaviorally relevant information which complements latency measures from traditional analyses of evoked activations.
Figure 3.
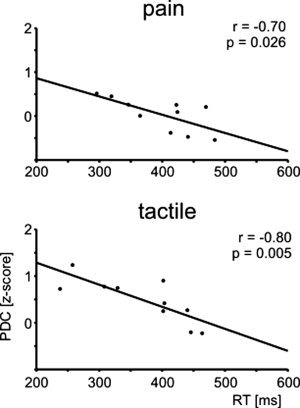
Correlation plots between individual mean reaction times and individual strengths of causal influences of contralateral S2 on ipsilateral S2 to painful (upper panel) and tactile (lower panel) stimuli. Each dot represents a single subject.
DISCUSSION
Here, we used MEG to investigate functional integration within the human pain system. We determined Granger causality between activations of sensorimotor areas during simple reaction times to painful and tactile stimuli. Our results show different causality patterns for processing of painful and tactile stimuli. The lack of causal influences of S1 on S2 in pain processing provides support for a partially parallel organization of somatosensory cortices in human pain processing which differs from the serial organization of these areas in tactile processing. Moreover, the strength of causal influences between local activations relate significantly to behavioral performance in a reaction time task highlighting the behavioral relevance of functional integration among brain areas.
In the present study, we investigated functional integration in terms of effective connectivity. Effective connectivity is commonly understood as the influence of one neural system over another [Friston, 2002]. During the last years, different measures of effective connectivity have been applied to electropyhsiological and neuroimaging data [Baccala and Sameshima, 2001; Friston et al., 2003; Kaminski et al., 2001; McIntosh and Gonzalez‐Lima, 1994; Roebroeck et al., 2005]. The method used here is an application of Granger causality [Granger, 1969]. Granger causality is based on the assumption that a signal X 1 causes a signal X 2 if previous values of X 1 help to predict future values of X 2. Most electrophysiological studies used PDC [Baccala and Sameshima, 2001], Directed transfer function [Kaminski et al., 2001] or related variants as applications of Granger causality. A direct comparison of these different measures of Granger causality showed that they yield comparable results [Astolfi et al., 2007]. Other measures of effective connectivity which are more often used in the analysis of functional imaging data are Structural equation modeling [McIntosh and Gonzalez‐Lima, 1994] and Dynamic causal modeling [Friston et al., 2003]. Particularly the latter method has theoretical advantages in modeling functional imaging data [Stephan, 2004]. However, direct comparisons of the different models of effective connectivity have not yet been carried out.
A single previous electrophysiological study investigated Granger causality in the human pain system yet [Weiss et al., 2008]. The results of the study showed directed connections between medial and lateral centroparietal electrodes during passive perception of pain. However, in this study, electroencephalography was used and analysis was based on connectivity measures between electrodes. Since in the present study we used MEG, performed the analysis in source space and applied it to a reaction time paradigm the present findings can not be directly compared to the previous results.
Here, we analyzed Granger causality in a simple network of cortical areas subserving a reaction time task to painful and tactile stimuli. The analysis of Granger causality was applied to single trials which implies a sensitivity of the analysis to both phase‐locked evoked as well as to non‐phase‐locked induced neuronal phenomena. Causal influences were mainly observed at frequencies below 10 Hz. It is thus likely that our observations represent causal influences between phase‐locked evoked activations which dominate this frequency band [Mouraux et al., 2003; Ploner et al., 2006a]. No causal influences were observed at higher frequencies where local neuronal phenomena rather than interareal communication predominate [Buzsaki and Draguhn, 2004]. However, our findings do not preclude pain‐related causal relationships at higher frequencies or other latencies which may not be detected by our frequency‐domain analysis. Particularly, effects at higher frequencies, e.g. in the gamma frequency range may have been obscured by the application of a 100 ms sliding window in 20 ms steps which can yield a loss of sensitivity to higher frequency responses. Moreover, latencies of pain‐related activations and causal influences between 100 and 300 ms indicate that these phenomena are due to activation of nociceptive Aδ‐afferents and can not necessarily be generalized to the activation of C‐fibers.
The analysis of tactile‐related activations confirms a causal sequence of activations from S1 to contralateral S2, ipsilateral S2 and M1. It is an inherent characteristic of PDC that the analysis addresses but does not rule out that the causal sequence of activations may be influenced by activations which are not included in the model. However, considering converging evidence from anatomical and neurophysiological studies for a predominantly serial organization of these areas in tactile processing [Iwamura, 1998; Kaas, 2004] the present findings further validate the applied methods. In contrast, in response to painful stimuli, no significant causal influence of S1 on contralateral S2 was observed. The lack of a causal influence suggests that pain‐related information is not conveyed via S1 to S2 but via independent, most probably direct thalamic connections to S2. This parallel organization of pain processing in S1 and S2 is in line with anatomical studies showing direct nociceptive projections from the thalamus to S2 [Friedman and Murray, 1986; Stevens et al., 1993]. Other evidence is provided by the simultaneous pain‐evoked activation of these areas which is consistently reported in neurophysiological recordings [Frot et al., 2008; Ohara et al., 2004; Ploner et al., 1999]. The present study complements and extends these observations by showing directly the causal interactions, or better, the lack of causal interactions between these areas and thereby provides further confirmatory evidence for a parallel organization of S1 and S2 in human pain processing. Functionally, the parallel organization of pain may represent an evolutionary old, simple and robust substrate for fast and effective behavioral reactions to threatening and behaviorally relevant stimuli [Ploner et al., 2006b].
It should be noted that the present analyses of pathways from S1 and S2 to M1 do not preclude transfer of pain‐ and tactile‐related information via other neural pathways, e.g. cingulate areas [Vogt et al., 2004]. However, since stimuli were applied to the right hand and motor responses were performed with the left hand the task necessarily implies information transfer between hemispheres. Considering the strong interhemispheric connections between the S2 areas [Disbrow et al., 2003] it, thus, appears reasonable that the communication between these areas represents an important part of a somatomotor pathway subserving a reaction time task to painful and tactile stimuli. In addition, the location and the time‐course of the ipsilateral precentral activation indicates that this activation represents an activation of M1. However, a contribution of S1 to this activation which could well reflect a pain‐evoked activation ipsilateral to the painful stimulus and/or a movement‐associated reafferent activation contralateral to the button press can not be ruled out.
The correlation between the strength of causal influences between brain areas and reaction times highlights the behavioral significance of functional integration among brain areas related to pain. The more effective different brain areas communicate the faster can a behavioral response be initiated. The lack of a correlation between latencies of evoked activations in bilateral S2 and reaction times indicate that the functional integration among brain areas do not directly relate to the latencies of evoked responses. Instead, functional integration appears to provide complementary and behaviorally relevant information about the functional organization of human pain processing. Functional integration may be particularly relevant in the processing of pain which comprises multiple different sensory, affective and emotional processes [Melzack and Casey, 1968], which need to be integrated for a coherent percept and a fast and appropriate behavioral response. Dysbalances in activations and alterations in the functional integration among brain areas related to pain may be important for the pathogenesis of chronic pain syndromes [Apkarian et al., 2005; Tracey and Mantyh, 2007].
In conclusion, the present investigation of functional integration within the human pain system shows that the analysis of causal influences between brain areas provides evidence for the parallel organization of pain processing in the human brain. Moreover, our findings indicate that the efficiency of functional integration relates to the speed of behavioral responses to pain. Taken together, these results show how the analysis of functional integration complements traditional analyses of electrophysiological data and provides novel and behaviorally relevant information about the highly distributed cerebral representation of pain in health and possibly also in disease.
Acknowledgements
The authors thank Irene Tracey and Ray Dolan for hosting and mentoring the Feodor Lynen Research Fellowship of M.P., respectively.
REFERENCES
- Apkarian AV, Bushnell MC, Treede RD, Zubieta JK ( 2005): Human brain mechanisms of pain perception and regulation in health and disease. Eur J Pain 9: 463–484. [DOI] [PubMed] [Google Scholar]
- Astolfi L, Cincotti F, Mattia D, Marciani MG, Baccala LA, de Vico Fallani F, Salinari S, Ursino M, Zavaglia M, Ding L and others ( 2007): Comparison of different cortical connectivity estimators for high‐resolution EEG recordings. Hum Brain Mapp 28: 143–157. [DOI] [PMC free article] [PubMed] [Google Scholar]
- Baccala LA, Sameshima K ( 2001): Partial directed coherence: A new concept in neural structure determination. Biol Cybern 84: 463–474. [DOI] [PubMed] [Google Scholar]
- Bushnell MC, Apkarian AV ( 2006): Representation of pain in the brain In: McMahon SB, Koltzenburg M, editors. Wall and Melzack's Textbook of Pain. Philadelphia: Elsevier; pp 107–124. [Google Scholar]
- Buzsaki G, Draguhn A ( 2004): Neuronal oscillations in cortical networks. Science 304: 1926–1929. [DOI] [PubMed] [Google Scholar]
- Craig AD ( 2003): Pain mechanisms: Labeled lines versus convergence in central processing. Annu Rev Neurosci 26: 1–30. [DOI] [PubMed] [Google Scholar]
- Disbrow E, Litinas E, Recanzone GH, Padberg J, Krubitzer L ( 2003): Cortical connections of the second somatosensory area and the parietal ventral area in macaque monkeys. J Comp Neurol 462: 382–399. [DOI] [PubMed] [Google Scholar]
- Friedman DP, Murray EA ( 1986): Thalamic connectivity of the second somatosensory area and neighboring somatosensory fields of the lateral sulcus of the macaque. J Comp Neurol 252: 348–373. [DOI] [PubMed] [Google Scholar]
- Friston K ( 2002): Beyond phrenology: What can neuroimaging tell us about distributed circuitry? Annu Rev Neurosci 25: 221–250. [DOI] [PubMed] [Google Scholar]
- Friston KJ, Harrison L, Penny W ( 2003): Dynamic causal modelling. Neuroimage 19: 1273–1302. [DOI] [PubMed] [Google Scholar]
- Frot M, Mauguiere F, Magnin M, Garcia‐Larrea L ( 2008): Parallel processing of nociceptive A‐delta inputs in SII and midcingulate cortex in humans. J Neurosci 28: 944–952. [DOI] [PMC free article] [PubMed] [Google Scholar]
- Granger CWJ ( 1969): Investigating causal relations by econometric models and cross‐spectral methods. Econometrica 37: 424–438. [Google Scholar]
- Gross J, Kujala J, Hämäläinen M, Timmermann L, Schnitzler A, Salmelin R ( 2001): Dynamic imaging of coherent sources: Studying neural interactions in the human brain. Proc Natl Acad Sci USA 98: 694–699. [DOI] [PMC free article] [PubMed] [Google Scholar]
- Hämäläinen M, Hari R, Ilmoniemi RJ, Knuutila J, Lounasmaa OV ( 1993): Magnetoencephalography—Theory, instrumentation, and applications to noninvasive studies of the working human brain. Rev Mod Phys 65: 413–497. [Google Scholar]
- Hari R, Forss N ( 1999): Magnetoencephalography in the study of human somatosensory cortical processing. Phil Trans R Soc Lond B 354: 1145–1154. [DOI] [PMC free article] [PubMed] [Google Scholar]
- Iwamura Y ( 1998): Hierarchical somatosensory processing. Curr Opin Neurobiol 8: 522–528. [DOI] [PubMed] [Google Scholar]
- Kaas JH ( 2004): Somatosensory system In: Paxinos G, Mai JK, editors. The Human Nervous System. Amsterdam: Elsevier; pp 1061–1093. [Google Scholar]
- Kakigi R, Inui K, Tamura Y ( 2005): Electrophysiological studies on human pain perception. Clin Neurophysiol 116: 743–763. [DOI] [PubMed] [Google Scholar]
- Kaminski M, Ding M, Truccolo WA, Bressler SL ( 2001): Evaluating causal relations in neural systems: Granger causality, directed transfer function and statistical assessment of significance. Biol Cybern 85: 145–157. [DOI] [PubMed] [Google Scholar]
- Kanda M, Nagamine T, Ikeda A, Ohara S, Kunieda T, Fujiwara N, Yazawa S, Sawamoto N, Matsumoto R, Taki W, Shibasaki H ( 2000): Primary somatosensory cortex is actively involved in pain processing in human. Brain Res 853: 282–289. [DOI] [PubMed] [Google Scholar]
- Llinas RR, Ribary U, Jeanmonod D, Kronberg E, Mitra PP ( 1999): Thalamocortical dysrhythmia: A neurological and neuropsychiatric syndrome characterized by magnetoencephalography. Proc Natl Acad Sci USA 96: 15222–15227. [DOI] [PMC free article] [PubMed] [Google Scholar]
- McIntosh A, Gonzalez‐Lima F ( 1994): Structural equation modelling and its application to network analysis in functional brain imaging. Hum Brain Mapp 2: 2–22. [Google Scholar]
- Melzack R, Casey KL ( 1968): Sensory, motivational, and central control determinants of pain: A new conceptual model in pain In: Kenshalo DRJ, editor. The Skin Senses. Springfield, IL: Charles C. Thomas. [Google Scholar]
- Meyer RA, Ringkamp M, Campbell JN, Raja SN ( 2006): Peripheral mechanisms of cutaneous nociception In: McMahon SB. and Koltzenburg M, editors. Wall and Melzack's Textbook of Pain. Philadelphia: Elsevier; pp 3–34. [Google Scholar]
- Mouraux A, Guerit JM, Plaghki L ( 2003): Non‐phase locked electroencephalogram (EEG) responses to CO2 laser skin stimulations may reflect central interactions between A partial partial differential‐ and C‐fibre afferent volleys. Clin Neurophysiol 114: 710–722. [DOI] [PubMed] [Google Scholar]
- Ohara S, Crone NE, Weiss N, Kim JH, Lenz FA ( 2008): Analysis of synchrony demonstrates that the presence of “pain networks” prior to a noxious stimulus can enable the perception of pain in response to that stimulus. Exp Brain Res 185: 353–358. [DOI] [PubMed] [Google Scholar]
- Ohara S, Crone NE, Weiss N, Lenz FA ( 2006): Analysis of synchrony demonstrates ‘pain networks’ defined by rapidly switching, task‐specific, functional connectivity between pain‐related cortical structures. Pain 123: 244–253. [DOI] [PubMed] [Google Scholar]
- Ohara S, Crone NE, Weiss N, Treede RD, Lenz FA ( 2004): Amplitudes of laser evoked potential recorded from primary somatosensory, parasylvian and medial frontal cortex are graded with stimulus intensity. Pain 110: 318–328. [DOI] [PubMed] [Google Scholar]
- Ploner M, Gross J, Timmermann L, Pollok B, Schnitzler A ( 2006a): Pain suppresses spontaneous brain rhythms. Cereb Cortex 16: 537–540. [DOI] [PubMed] [Google Scholar]
- Ploner M, Gross J, Timmermann L, Schnitzler A ( 2006b): Pain processing is faster than tactile processing in the human brain. J Neurosci 26: 10879–10882. [DOI] [PMC free article] [PubMed] [Google Scholar]
- Ploner M, Schmitz F, Freund HJ, Schnitzler A ( 1999): Parallel activation of primary and secondary somatosensory cortices in human pain processing. J Neurophysiol 81: 3100–3104. [DOI] [PubMed] [Google Scholar]
- Ploner M, Schmitz F, Freund HJ, Schnitzler A ( 2000). Differential organization of touch and pain in human primary somatosensory cortex. J Neurophysiol 83: 1770–1776. [DOI] [PubMed] [Google Scholar]
- Roebroeck A, Formisano E, Goebel R ( 2005): Mapping directed influence over the brain using Granger causality and fMRI. Neuroimage 25: 230–242. [DOI] [PubMed] [Google Scholar]
- Sarnthein J, Jeanmonod D ( 2008): High thalamocortical theta coherence in patients with neurogenic pain. Neuroimage 39: 1910–1917. [DOI] [PubMed] [Google Scholar]
- Schlogl A, Supp G ( 2006): Analyzing event‐related EEG data with multivariate autoregressive parameters. Prog Brain Res 159: 135–147. [DOI] [PubMed] [Google Scholar]
- Sekihara K, Nagarajan SS, Poeppel D, Marantz A, Miyashita Y ( 2001): Reconstructing spatio‐temporal activities of neural sources using an MEG vector beamformer technique. IEEE Trans Biomed Eng 48: 760–771. [DOI] [PubMed] [Google Scholar]
- Stephan KE ( 2004): On the role of general system theory for functional neuroimaging. J Anat 205: 443–470. [DOI] [PMC free article] [PubMed] [Google Scholar]
- Stevens RT, London SM, Apkarian AV ( 1993): Spinothalamocortical projections to the secondary somatosensory cortex (SII) in squirrel monkey. Brain Res 631: 241–246. [DOI] [PubMed] [Google Scholar]
- Tracey I, Mantyh PW ( 2007): The cerebral signature for pain perception and its modulation. Neuron 55: 377–391. [DOI] [PubMed] [Google Scholar]
- Treede RD ( 2003): Neurophysiological studies of pain pathways in peripheral and central nervous system disorders. J Neurol 250: 1152–1161. [DOI] [PubMed] [Google Scholar]
- Vallbo AB, Hagbarth KE, Torebjork HE, Wallin BG ( 1979): Somatosensory, proprioceptive, and sympathetic activity in human peripheral nerves. Physiol Rev 59: 919–957. [DOI] [PubMed] [Google Scholar]
- Vogt BA, Hof PR, Vogt LJ ( 2004): Cingulate gyrus In: Paxinos G, Mai JK, editors. The Human Nervous System. Amsterdam: Elsevier; pp 915–949. [Google Scholar]
- Weiss T, Hesse W, Ungureanu M, Hecht H, Leistritz L, Witte H, Miltner WH ( 2008): How do brain areas communicate during the processing of noxious stimuli? An analysis of laser evoked event‐related potentials using the Granger Causality Index. J Neurophysiol 99: 2220–2231. [DOI] [PubMed] [Google Scholar]
- Willis WD, Westlund KN ( 2004): Pain system In: Paxinos G, Mai JK, editors. The Human Nervous System. Amsterdam: Elsevier; pp 1125–1170. [Google Scholar]