

Abstract
Previous research has shown that information from one sensory modality has the potential to influence activity in a different modality, and these crossmodal interactions can occur early in the cortical sensory processing stream within sensory‐specific cortex. In addition, it has been shown that when sensory information is relevant to the performance of a task, there is an upregulation of sensory cortex. This study sought to investigate the effects of simultaneous bimodal (visual and vibrotactile) stimulation on the modulation of primary somatosensory cortex (SI), in the context of a delayed sensory‐to‐motor task when both stimuli are task‐relevant. It was hypothesized that the requirement to combine visual and vibrotactile stimuli would be associated with an increase in SI activity compared to vibrotactile stimuli alone. Functional magnetic resonance imaging (fMRI) was performed on healthy subjects using a 3T scanner. During the scanning session, subjects performed a sensory‐guided motor task while receiving visual, vibrotactile, or both types of stimuli. An event‐related design was used to examine cortical activity related to the stimulus onset and the motor response. A region of interest (ROI) analysis was performed on right SI and revealed an increase in percent blood oxygenation level dependent signal change in the bimodal (visual + tactile) task compared to the unimodal tasks. Results of the whole‐brain analysis revealed a common fronto‐parietal network that was active across both the bimodal and unimodal task conditions, suggesting that these regions are sensitive to the attentional and motor‐planning aspects of the task rather than the unimodal or bimodal nature of the stimuli. Hum Brain Mapp, 2010. © 2009 Wiley‐Liss, Inc.
Keywords: somatosensory cortex, sensorimotor integration, crossmodal interactions, task‐relevance, visual‐tactile
INTRODUCTION
Previous studies suggest that a number of factors can modulate neural activity in modality‐specific sensory cortex, including attention [Johansen‐Berg et al., 2000; Steinmetz et al., 2000] and cross‐modal influences [Burton et al., 1997; Macaluso et al., 2000]. More recently, the interaction between these two factors has emerged as a promising area of research for understanding how sensory information is processed in the cortex [Driver and Spence, 1998; Eimer and Driver, 2000; Spence, 2002]. Presumably, the goal of these interactions is to facilitate the extraction of relevant sensory information early in the processing stream to ensure task‐relevant information is passed on for further processing in higher‐order cortical areas. Evidence for attentional modulation is most abundant in studies of visual [Andersen et al., 2008; Corbetta et al., 1991; Gazzaley et al., 2007; Moran and Desimone, 1985; Watanabe et al., 1998] and auditory [Jancke et al., 1999; Petkov et al., 2004; Sussman et al., 2005; Woldorff et al., 1993] modalities; however, similar findings are emerging within primary somatosensory cortex (SI). For example, some studies have reported that attending to a relevant tactile stimulus increases activity in SI relative to ignoring an irrelevant tactile stimulus [Johansen‐Berg et al., 2000; Staines et al., 2002; Van de Winckel et al., 2005], but other studies have not found a task‐relevant modulation within SI [Burton et al., 2008; Fujiwara et al., 2002; Mima et al., 1998]. Further to this discrepancy, Meehan and Staines [2007] found that the requirement to perform a continuous motor‐tracking task in the presence of bimodal (visual and vibrotactile) stimuli produced differential modulation of activity in contralateral SI when the vibrotactile stimulus was relevant to the task compared to when it was irrelevant to the task, such that the volume of activity in SI decreased when subjects attended to the vibrotactile stimulus compared to when they ignored it and tracked the visual stimulus. These results suggest that the specific requirements of the task may determine the nature of SI modulation; in this case, the continuous motor task and the presence of a crossmodal distractor may have been mitigating factors in the observed suppression of SI.
The possibility of crossmodal attention effects in primary sensory cortex has been raised by previous observations of such effects on early modality‐specific event‐related potential (ERP) components [Eimer, 2001; Eimer and van Velzen, 2005; Kennett et al., 2001; McDonald et al., 2001a; Murray et al., 2005; Teder‐Salejarvi et al., 2002]. For example, Ghazanfar et al. [2005] demonstrated facilitation of neurons in auditory cortex when visual stimuli were presented in addition to auditory stimuli as well as some cells that responded to the visual stimulus alone. Similar results were found for somatosensory stimuli by Murray et al. [2005], who observed enhancement of auditory evoked responses as early as 50 ms after a somatosensory stimulus was applied to the hand. Using evoked potentials (EPs), Schurmann et al. [2002] found a facilitation of EP components over midline and ipsilateral electrode sites beginning at 75 ms when visual stimuli were presented simultaneously with electrical median nerve stimulation. Further evidence of early multisensory interactions comes from functional imaging of monkey auditory cortex, revealing regions that show response enhancement to visual plus auditory stimulation and somatosensory plus auditory stimulation [Kayser et al., 2005; Kayser and Logothetis, 2007]. In humans, Schurmann et al. [2006] found that passive vibrotactile stimuli enhanced blood oxygenation level dependent (BOLD) activity in auditory cortex, both during auditory stimulation and in isolation. In contrast, when information from one modality is irrelevant to the task cross‐modal suppression can be observed, for example, a decrease in blood flow to SI was found during tasks requiring visual processing [Haxby et al., 1991] or auditory discrimination [Fiez et al., 1996].
Taken together, the findings of task‐relevant and cross‐modal modulation of primary sensory cortex suggest that both relevance and modality of stimuli can affect the excitability of sensory cortex. It remains unclear how these two factors interact to modulate incoming sensory information, and thus the goal of the present study was to determine whether bimodal (visual and tactile) sensory stimulation differentially modulates SI compared to unimodal stimulation when task‐relevancy requirements are held constant. To investigate whether activity in SI is modulated by bimodal sensory stimulation, we used a task that required subjects to extract sensory information either within or across modalities and use this information to plan and execute an accurate motor response. On the basis of the growing body of evidence suggesting that information from different modalities interacts within primary sensory cortex, we hypothesized that the requirement to process both visual and tactile stimuli would enhance activity in SI compared to using visual or tactile stimuli alone.
Our secondary hypothesis was targeted at gaining insight into what may drive this facilitation if observed. In functional magnetic resonance imaging (fMRI) studies, multisensory tasks are often associated with increased BOLD activity in higher‐order frontal and parietal association regions, including dorsolateral prefrontal cortex (DLPFC), temporoparietal junction, superior temporal sulcus, and inferior parietal sulcus [Beauchamp et al., 2004, 2008; Calvert, 2001; Downar et al., 2001; McDonald et al., 2001b]. In particular, DLPFC appears to be a strong candidate for top‐down modulation of multisensory information. Johnson and Zatorre [2006] found increased signal change in left DLPFC when attention was divided between auditory and visual stimuli compared to passive bimodal stimulation and selective attention to either modality. Given the connections between frontal heteromodal areas and sensory cortex, it is possible that activity in areas like DLPFC may modulate activity in primary sensory cortex in a top‐down manner to enhance the extraction and processing of relevant sensory information [Knight et al., 1999; Yamaguchi and Knight, 1990]. Support for the role of parietal associative regions in the processing of task‐relevant information comes from studies of visual and tactile attention, which suggest that these processes are mediated by a fronto‐parietal network that is involved in selecting behaviorally relevant stimuli for further processing [Burton et al., 1997, 1999; Corbetta, 1998; Corbetta et al., 1998; Mesulam, 1990; Posner and Petersen, 1990]. In particular, the posterior parietal cortex has been implicated in mediating attention to sensory information in different modalities [Andersen et al., 1997; Nakashita et al., 2008; Rushworth and Taylor, 2006]. Thus, we hypothesized that frontal and parietal associative regions would show increased BOLD activation when visual and tactile stimuli are presented together compared to presentation of visual or tactile stimuli alone and that this would be associated with an upregulation of activity in primary SI.
METHODS
Subjects
fMRI was performed on 10 healthy participants (mean age, 25; range, 22–37; 5 females). Experimental procedures were approved by the Sunnybrook Health Sciences Centre Ethics Committee and the University of Waterloo Office of Research Ethics. All subjects provided informed written consent.
Experimental Task and Conditions
The experimental task required participants to judge the amplitude of two stimuli, either visual, tactile, or both, and make a graded motor response to represent the sum of these amplitudes by squeezing a pressure‐sensitive bulb with their right hand. Prior to the functional scans, participants underwent a 7‐min training session with visual feedback to learn the relationship between the amplitudes of the stimuli and the corresponding force required to apply to the bulb. During training, a horizontal target bar appeared on the visual display, and subjects were instructed to squeeze the pressure‐sensitive bulb with enough force to raise another visual horizontal bar to the same level as the target bar. At the same time, as subjects applied force to the bulb with their right hand, a vibrotactile device vibrated against the volar surface of their left index finger with corresponding changes in amplitude, that is, as they squeezed harder on the bulb, the amplitude of the vibration increased proportionately. Subjects were instructed to pay attention to these changes in amplitude as they related to the force they were applying to the bulb, and, in this way, subjects became familiar with the relationship between the vibrotactile stimulus amplitude and the corresponding force applied to the bulb. To control for force‐related trial‐to‐trial differences, stimulus amplitudes were scaled such that no single stimulus required a squeeze of more than 25% of an individual's maximum force, thus the response for adding two stimuli was never more than 50% of an individual's maximum force.
Stimulus presentation was manipulated in two ways: timing and modality. Stimuli were presented either sequentially for 2 s each, or simultaneously for 4 s, such that, in both cases, the total stimulation period was 4 s. Pairs of stimuli were either unimodal (two visual or two tactile stimuli) and sequentially presented, or bimodal (one visual and one tactile stimuli) and presented simultaneously for a total of three experimental conditions: two unimodal conditions, visual and tactile, and one bimodal condition, visual + tactile.
Experimental Design
An event‐related design was used to investigate changes in blood flow at different stages of the sensorimotor integration process. Stimuli were presented for 4 s followed by a 4‐s delay, at which point a brief (500 ms) cue was given to signal participants to make their motor response during a 2‐s window, followed by 10 s of rest prior to the start of the next trial, for a total of 20 s per trial. Figure 1A illustrates the time course of a typical trial in the simultaneous bimodal condition, and Figure 1B shows the timing for the sequential unimodal conditions. This design yielded three event‐related time periods (stimulus, delay, and response) with the remainder of each trial serving as the baseline (off). For the purposes of addressing the hypotheses of this study, the stimulus period was the primary time point of interest, and all analyses were performed on the volumes corresponding to the stimulus presentation period. Each task condition was performed in a block of 15 trials with each block lasting 5 min.
Figure 1.
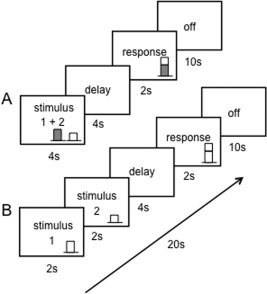
Timing of experimental task. (A) shows timing for the bimodal visual + tactile condition; (B) depicts the timing for trials in the unimodal task conditions.
Experimental Stimuli
Visual stimuli consisted of a centrally presented horizontal bar at varying heights representing different amplitudes. Visual stimuli were back‐projected onto a white screen placed over the subjects' feet that was visible to subjects via an angled mirror in the head coil. Vibrotactile stimuli consisted of discrete vibrations at a constant frequency of 25 Hz, delivered by a custom MRI‐compatible device [Graham et al., 2001] applied to the volar surface of the left index finger. Vibrotactile stimulation was controlled by converting digitally generated waveforms to an analog signal (DAQCard 6024E, National Instruments, Austin, TX) and then amplifying the signal (Bryston 2B‐LP, Peterborough, Ontario) using a custom program written in LabVIEW (version 7.1, National Instruments, Austin, TX). Varying the amplitude of the driving voltage to the vibrotactile device produced proportional changes in vibration amplitude of the device on the finger in the MR environment [Graham et al., 2001]. The amplitude of each discrete vibration was constant within a trial and varied between trials. The average stimulus amplitude across all 15 trials of a run did not differ between the experimental conditions. The frequency of the vibration was held constant at 25 Hz. Output from the computer was routed through a penetration panel to the magnet room using a filtered nine‐pin D sub‐connector and shielded cable to ensure that no perceptible torque was produced by currents induced by radio‐frequency transmit pulses or time‐varying magnetic field gradients during imaging.
Scanning Parameters
Functional and anatomical images were collected at Sunnybrook Health Sciences Centre on a 3T MRI scanner (GE HealthCare, Milwaukee, Wisconsin) using a standard birdcage head coil. Prior to the functional scans, high‐resolution anatomical scans were acquired for each subject (TR = 12.4 ms, TE = 5.4 ms, flip angle θ = 35°, FOV = 20 × 16.5, 124 slices, slice thickness = 1.4 mm) for later coregistration with functional maps. BOLD images were acquired using gradient echo imaging with single‐shot spiral in‐out readout (TR = 2,000 ms, TE = 30 ms, flip angle θ = 70°, FOV = 20, 26 slices, slice thickness = 5 mm). Total scan time for each subject was ∼60 min.
Data Analysis
Raw data were reconstructed offline and a time series of 154 images per slice was generated for each functional scan. The resulting time courses were analyzed using BrainVoyager QX 1.9 software (Brain Innovation, Mastricht, The Netherlands). The first four volumes of each time series were excluded to prevent artifact from transient signal changes as the brain reached a steady magnetized state. Prior to coregistration, the functional data was preprocessed by linear trend removal, temporal high‐pass filtering to remove nonlinear low frequency drift, and three‐dimensional motion correction using trilinear interpolation to detect and correct for small head movements during the scan by spatially realigning all subsequent volumes to the fifth volume. Estimated translation and rotation measures were visually inspected and never exceeded 1 mm and 1°, respectively. The functional data sets were transformed into Talairach space [Talairach and Tournoux, 1988] by coregistering the functional data with the anatomical data for each subject. The resulting volume time courses were filtered using a 6‐mm Gaussian kernel at full‐width half‐maximum.
A multiple regression analysis was used to determine the statistical differences across the three experimental conditions (visual–visual, tactile–tactile, and visual + tactile) for the stimulus presentation period as well as the delay and response periods for a total of five predictors, with the 10 s of “off” in each condition serving as the baseline. The event of interest for this study was the stimulus presentation period; thus, three stimulation protocols were applied using dummy‐predictors for those predictors not present in a given scan. The protocols were convolved with a boxcar hemodynamic response function [Boynton et al., 1996] to account for the expected response and temporal delay of the changes in blood flow. The resulting reference functions served as the model for the response time course functions used in the general linear model. Two different general linear models were used to carry out a region of interest (ROI) analysis on the right SI and a whole‐brain analysis.
ROI Analysis
Given that the primary hypothesis of the study focused on changes in SI, a region of interest (ROI) analysis was used to assess the effects of the experimental manipulations on right SI (contralateral to vibrotactile stimulation) in each subject. A mask of each subject's right SI was created using the following anatomical boundaries: the central sulcus anteriorly, the medial wall of the “hand knob” medially, the most lateral edge of the postcentral gyrus laterally, and the postcentral sulcus posteriorly [Nelson et al., 2004]. After applying the general linear model using the mask restriction, any significant voxels that exceeded the Bonferroni corrected value of P < 0.05 for the total number of voxels contained in the ROI and that were part of a cluster greater than three contiguous voxels were included in the ROI analyses. Task‐related changes were quantified as changes in the intensity and volume of the activated clusters in the ROI. To quantify differences in intensity, the individual time course data for all significantly activated voxels within a cluster were extracted and averaged across each subject and condition to produce one time series per subject per condition representing signal changes for the event relative to the off period for a given scan; thus, BOLD signal changes are expressed as a percentage relative to the baseline off. To quantify volume of activation, the total number of voxels reaching the significance threshold was represented as a percentage of the total number of voxels in each subject's SI mask. Volume measurements were analyzed using a paired t‐test to assess differences between task conditions. A repeated‐measures ANOVA was carried out using SPSS (v.17, SPSS, Chicago, IL) to test for a main effect of task condition on percent signal change at the point of peak stimulus‐related activity. Differences in signal change between the three task conditions (visual, tactile, and visual + tactile) were assessed using Tukey's post hoc tests.
Whole‐Brain Analysis
A random effects analysis was used to investigate regions that were sensitive to the experimental manipulations. Contrast maps were created using a voxel‐based approach to show relative changes for stimulus versus off and response versus off. An additional a priori contrast was performed to compare tactile versus visual + tactile conditions. Activated voxels were considered significant if the threshold exceeded P < 0.001 uncorrected and formed a cluster of 14 contiguous voxels, based on a cluster size threshold estimator simulation using BrainVoyager QX 1.9 software (Brain Innovation, Mastricht, The Netherlands), corresponding to a corrected threshold of P < 0.05 [Forman et al., 1995]. The center of gravity and t‐statistics were extracted for each significant cluster. Event‐related averaging was applied to each cluster to determine the BOLD response characteristics for each task condition, and peak stimulus‐related signal change was extracted and averaged across subjects.
Behavioral Data Analysis
Behavioral data was analyzed by summing the amplitudes of the two target stimuli and comparing this to the amplitude of the response (i.e. the force applied to the bulb). The percent difference between the summed target stimulus amplitude and the actual response amplitude was calculated and a repeated measures ANOVA was conducted to assess statistical differences across the experimental conditions.
RESULTS
ROI Analysis
Clusters of activation were found in the tactile and the visual + tactile task, but not surprisingly not for the visual task. This was true for all subjects except one who had no active voxels survive the thresholding criteria in any of the task conditions, thus regions of interest (ROI) analyses were performed on the remaining nine subjects. The results of the ROI analysis on right S1 (contralateral to vibrotactile stimulation) are shown in Figure 2, which illustrates a significant increase in percent signal change in the tactile + visual condition compared to the tactile condition at the point of peak stimulus‐related activity (8‐s poststimulus onset). This difference was confirmed by a significant main effect of task in a repeated measures ANOVA (F 2,16 = 36.4, P < 0.001). Post hoc tests revealed significant differences between each task: tactile > visual (P < 0.001), visual + tactile > visual (P < 0.001), and most relevant to our hypothesis, visual + tactile > tactile (P = 0.009). No task‐related difference was found for volume of activation between the tactile and visual + tactile conditions (t 8 = 0.471, P > 0.05).
Figure 2.
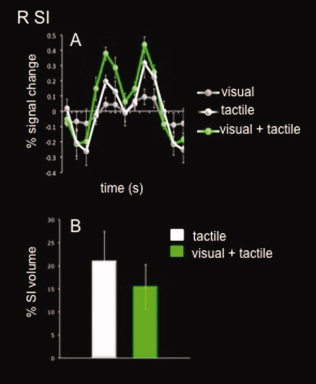
Region of interest (ROI) results for right somatosensory cortex (R SI). White bar/line represents the unimodal tactile task, green bar/line represents the bimodal visual + tactile task, and the gray line represents the unimodal visual task. Error bars depict SEM, asterisk indicates a significant difference (P < 0.05).
Whole Brain Analysis
Group activation maps for the stimulus and response periods contrasted versus baseline are displayed in Figures 3 and 4, respectively. For the stimulus presentation period, a common network of activation can be seen across all conditions, regardless of stimulus modality. This network includes the medial frontal gyrus (BA 6), bilateral precentral and middle frontal gyri (BA 9), right superior temporal gyrus (BA 41), left inferior temporal gyrus (BA 37), and left inferior parietal lobule (BA 40). For a complete list of activations for the stimulus and response periods with center of gravity coordinates and t‐statistics see Tables I and II respectively. Figure 3B depicts the event‐related average plots for clusters in the observed fronto‐parietal network, illustrating the BOLD signal (represented as percent signal change relative to baseline) for each task condition. Time zero corresponds to the onset of the stimulus, with the stimulus‐related activity peaking ∼8 s later. The second peak in BOLD signal occurs around 16 s and corresponds to the motor response‐related activity.
Figure 3.
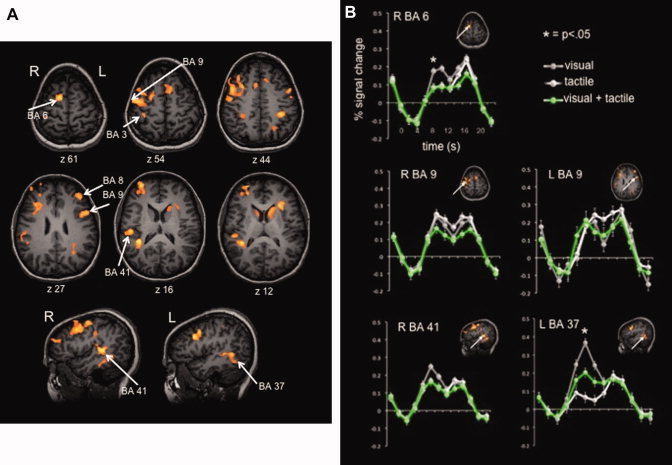
Group activation maps and event‐related average plots for the stimulus presentation relative to baseline. Panel A depicts areas with greater activity during the 4‐s stimulus “on” time compared to baseline, shown on orange color scale, significant at P < 0.001 with a cluster threshold of 14 voxels. Panel B shows event‐related averaging plots for clusters of interest, illustrating the BOLD response of each task condition; gray lines represent the visual task, white lines show the tactile task, and green lines depict the visual + tactile task. Bars represent SEM, and asterisks indicates a significant difference (P < 0.05).
Figure 4.
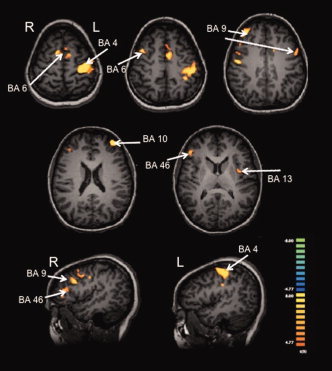
Group activation maps for the motor response relative to baseline. Orange color scale depicts areas with greateer activity during the motor response compared of baseline, significant at P < 0.001 with a cluster threshold of 14 voxels.
Table I.
Regions demonstrating stimulus‐related activity > baseline
| Anatomical region/Brodmann area | x | y | z | t‐Statistic | Task‐related difference (P < 0.05) |
|---|---|---|---|---|---|
| Stimulus > baseline P < 0.001 cluster threshold = 14 | |||||
| R superior temporal gyrus (BA 41) | 44 | −35 | 13 | 5.77 | n.s. |
| R precentral gyrus (BA 9) | 40 | 20 | 36 | 5.66 | n.s. |
| R medial frontal gyrus (BA 6) | 18 | 2 | 58 | 5.84 | v > t, v > vt |
| R caudate | 9 | 11 | 10 | 5.19 | n.s. |
| R claustrum | 34 | −3 | −9 | 5.65 | n.s. |
| L superior frontal gyrus (BA 8) | −4 | 16 | 50 | 5.23 | n.s. |
| L inferior parietal lobule (BA 40) | −38 | −34 | 45 | 5.78 | n.s. |
| L middle frontal gyrus (BA 9) | −40 | 43 | 27 | 5.39 | n.s. |
| −49 | 8 | 34 | 6.12 | n.s. | |
| L inferior temporal gyrus (BA 37) | −50 | −48 | −4 | 5.45 | v > t, v > vt, vt > t |
| L caudate | −15 | 17 | 8 | 5.32 | vt > v, vt > t |
| L insula (BA 13) | −31 | 25 | 13 | 5.96 | n.s. |
Table II.
Regions demonstrating motor response‐related activity > baseline
| Anatomical region/Brodmann area | x | y | z | t‐Statistic |
|---|---|---|---|---|
| Response > baseline P < 0.001 cluster threshold = 14 | ||||
| R precentral gyrus (BA 6) | 52 | −9 | 39 | 7.23 |
| R inferior frontal gyrus (BA 46) | 47 | 35 | 10 | 6.69 |
| R middle frontal gyrus (BA 6) | 45 | 8 | 43 | 6.58 |
| R middle frontal gyrus (BA 9) | 46 | 19 | 31 | 6.91 |
| R superior frontal gyrus (BA 9) | 35 | 46 | 31 | 7.07 |
| R medial frontal gyrus (BA 6) | 9 | 4 | 63 | 7.01 |
| L superior frontal gyrus (BA 10) | −39 | 51 | 24 | 7.61 |
| L medial frontal gyrus (BA 6) | −9 | 5 | 51 | 6.76 |
| L precentral gyrus (BA 4) | −41 | −24 | 53 | 7.89 |
| L postcentral gyrus (BA 2) | −51 | −21 | 29 | 6.93 |
| L middle frontal gyrus (BA 9) | −55 | 9 | 34 | 7.07 |
| L insula (BA 13) | −37 | 3 | 6 | 6.60 |
Event‐related Averages
To determine the stimulus‐related BOLD response for each task condition, event‐related averaging was performed on all significant ROIs from the whole brain analysis. Repeated measures ANOVAs with post hoc tests were run on each peak to determine task‐related differences, and these results are shown in Table I. Significant task effects were observed in the R premotor cortex (BA 6) (F 2,18 = 3.541; P < 0.05) R inferior temporal gyrus (BA 37) (F 2,18 = 3.775; P < 0.05, and L caudate (F 2,18 = 3.347 P < 0.05). The visual task produced greater signal change in the R premotor cortex compared to the tactile and visual + tactile conditions. Similarly, in the R inferior temporal gyrus, the visual task was also associated with greater signal change than the tactile and visual + tactile conditions; however, the visual + tactile condition also showed greater peak signal change compared to the tactile task. Last, in the L caudate, the visual + tactile condition produced greater peak signal change than either the visual or tactile conditions. All post hoc tests reported were significant at P < 0.05.
Behavioral Results
A one‐way repeated measures ANOVA was performed on the error differences across all three conditions and yielded no main effect (F 2,20 = 0.070, P > 0.05). Thus, all tasks were performed with equivalent accuracy as illustrated in Figure 5.
Figure 5.
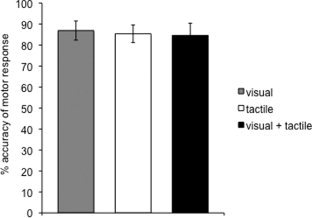
Behavioral results. Bars depict mean percent accuracy of all subjects in each task condition. Error bars represent standard error of the mean.
DISCUSSION
This study sought to investigate how cross‐modal information, in this case, visual and somatosensory stimuli, interacts within primary SI for the purpose of performing a delayed sensory‐to‐motor task. Specifically, we asked whether activity in SI is modulated by the requirement to use both visual and vibrotactile information to guide a motor response, and if so to identify regions that may contribute to or drive this modulation. Our first hypothesis that we would see a modulation of SI activity in the bimodal visual + tactile task relative to the unimodal visual and tactile tasks was supported by the results of our ROI analysis, which revealed an increase in peak percent BOLD signal change in the visual + tactile condition compared to the tactile‐only and visual‐only conditions. This finding of bimodal upregulation of SI aligns with similar observations made with fMRI of auditory‐somatosensory convergence in early auditory cortex [Foxe et al., 2002; Kayser et al., 2005], and visual‐auditory interactions in auditory cortex [Kayser et al., 2008; Miller and D'Esposito, 2005b; van Atteveldt et al., 2004] as well as visual processing areas [Macaluso et al., 2000]. The SI modulation seen in this study is also inline with ERP studies finding evidence of crossmodal interactions across auditory and somatosensory modalaties less than 100‐ms poststimulus [Ghazanfar et al., 2005; Lakatos et al., 2007; Molholm et al., 2002; Murray et al., 2005; Teder‐Salejarvi et al., 2005], a timeline that is consistent with processing within primary sensory cortex [Allison et al., 1992]. Relatively, few studies have specifically investigated the role of crossmodal effects in SI. Schurmann et al. [2002] combined visual evoked potentials (VEPs) and somatosensory evoked potentials (SEPs) and observed a bimodal enhancement at multiple electrode sites beginning at 75 ms, with a maximal effect at 225–275 ms. Zhou and Fuster [2000] found that in monkeys trained to make visual‐haptic or auditory‐haptic associations, a subset of SI neurons responded to both the visual/auditory cue and the tactile stimulus. This study provides further evidence for crossmodal interactions within sensory‐specific cortex and is the first to demonstrate an upregulation of SI with simultaneous visual and tactile stimulation using fMRI.
These findings diverge from those of Meehan and Staines [2007] who observed a decrease in volume of SI activity during bimodal visual and tactile stimulation when subjects tracked the tactile stimulus (and ignored the visual) compared to when they tracked the visual stimulus (and ignored the tactile). However, this discrepancy can likely be explained by differences in the nature of the task, the most salient being that in this study both the visual and tactile stimuli were relevant to the performance of the motor task and thus both had to be attended to, as opposed to one stimulus being a target and the other a distractor. The latter requires selective intermodal attention. This difference in relevancy/attention has been shown to have an effect in both sensory modality‐specific cortex [Eimer and van Velzen, 2005; Johnson and Zatorre, 2005; Kennett et al., 2001; Macaluso et al., 2002] and in heteromodal frontal and parietal areas [Downar et al., 2001]. The disparity in findings between these two studies may also be accounted for by differences in the motor task such that in the previous study subjects were required to continuously track a fluctuating stimulus over a period of time, whereas, in this study, subjects made a discrete motor response after receiving two static stimuli. The continuous nature of the tracking task may have altered the attentional demands of the task, likely by requiring more sustained attention over a longer period of time.
Our secondary hypothesis that we would see differential patterns of activation in frontal and parietal regions between task conditions was not supported, and, instead, we observed a common fronto‐parietal network, including the right precentral gyrus (BA 9), left middle frontal gyrus (BA 9), right medial frontal gyrus (BA 6), left inferior parietal lobule (BA 40), and right superior temporal gyrus (BA 41) that was active after the stimuli were presented for all three task conditions compared to rest. A comparable network of activation has often been observed in tasks that require shifts of attention [Corbetta, 1998; Mesulam, 1990; Rushworth et al., 2001], and this network has been implicated in the top‐down modulation of relevant and irrelevant stimuli [Gazzaley et al., 2007; Ghatan et al., 1998; Miller and D'Esposito, 2005a; Shulman et al., 1997; Staines et al., 2002]. However, in this study, stimuli in all task conditions were always relevant to the performance of the motor task, which may account for why we observed relatively few task‐related changes in frontal and parietal regions typically associated with top‐down modulation. However, the event‐related averaging plots did reveal some areas that were differentially sensitive to the task manipulation, including the right premotor cortex, left inferior temporal gyrus, and left caudate. The right premotor cortex showed greater peak signal change in response to the visual condition, and no difference between the tactile condition and the visual + tactile condition, suggesting that the premotor cortex is not sensitive to tactile stimuli or the combination of visual and tactile stimuli, but it does appear to show preferential activity for visual stimuli presented alone. There are two possible explanations for this observation: the first being that the visual processing demands are greater in the visual condition due to the presence of two visual cues and this drives an upregulation of premotor cortex. An alternative but not mutually exclusive explanation could be that the presence of tactile stimuli in the other two task conditions may have produced a relative suppression in this region compared to the visual condition. The similarity between the BOLD activity evoked by the cued response in all three conditions (the second peak in the signal plots in Fig. 3B) supports the view that this is a stimulus‐dependent effect rather than a difference in the motor requirements of the tasks.
In addition, the left inferior temporal gyrus showed preferential activity for visual stimuli such that peak signal change was greater for the visual + tactile condition than the tactile task, and greater still for the visual task. This region is thought to play a role in higher‐level visual processing such as stimulus recognition and visual working memory [Axmacher et al., 2008; Ranganath and D'Esposito, 2005; Rissman et al., 2008], which may account for why we observed increased BOLD signal as the visual processing requirements increased across tasks. A task‐related effect was also seen in the left caudate, which responded with greater peak signal change during the visual + tactile task compared to the unimodal tasks. Although the caudate nucleus has been implicated in response selection for goal‐directed action [Grahn et al., 2008], there is no evidence to date that it is sensitive to crossmodal stimuli; thus, this study may be the first to demonstrate such an effect.
The results of this study suggest that while a fronto‐parietal network may be involved in the attentional and motor‐planning aspects of the task, which were equivalent across all conditions, such a network is not likely to be differentially involved in processing simultaneously presented visual and tactile stimuli. Given this observation, our secondary hypothesis that modulation of SI activity would coincide with increased activation in multimodal association regions such as the DLPFC, temporal parietal junction, and inferior parietal lobule was not supported by the data from the whole‐brain analysis, and thus the crossmodal SI enhancement seen in this study was likely not driven by feedback from a higher‐order multimodal area. An alternative explanation for the increase in BOLD signal in SI during the bimodal task may lie in the anatomical connectivity between visual and somatosensory processing areas. Evidence for these connections comes from a retrograde tracer study in marmosets, revealing projections from visual areas, specifically the ventral and dorsal fundus of the superior temporal area and middle temporal crescent (areas FST and MT) toward somatosensory areas 1 and 3b [Cappe and Barone, 2005]. The existence of these connections supports the possibility that incoming visual and tactile information may interact in a bottom‐up manner via low‐level sensory to sensory connections. Evidence for feedforward crossmodal interactions has been reported in audio‐visual modalities in ERP experiments, in which interactions between these modalities have been observed as early as 40‐ms poststimulus over unisensory recording sites [Giard and Peronnet, 1999; Murray et al., 2005; Schroeder and Foxe, 2005], which is typically considered to be too early for feedback from higher‐level cortical areas to reach these areas [Foxe and Schroeder, 2005; Giard and Peronnet, 1999]. This study is the first to find evidence of visual‐somatosensory interactions within SI, but the precise mechanisms driving this interaction are not yet clear.
A similar but more frontally focused network was observed related to the motor response, including bilateral middle frontal gyri (BA 9), bilateral medial frontal gyri (BA 6), right inferior frontal gyrus (BA 46), left superior frontal gyrus (BA 10), and left precentral and postcentral gyri (BA 4 and 2, respectively). Comparable networks of activation are often associated with movement preparation and execution [Deiber et al., 1996; Thoenissen et al., 2002; Toni et al., 2001, 2002], and, in particular, the frontal motor areas have been reported to show similar levels of activity regardless of the contribution of vision to motor planning [Deiber et al., 1996]; thus, we would not expect these areas to be differentially modulated by the modality of the stimulus. From a behavioral standpoint, we also did not observe any difference in how well subjects performed the motor task across conditions. Previous studies of multisensory interactions have reported faster reaction times in multisensory conditions compared to unisensory conditions [Martuzzi et al., 2007; Molholm et al., 2002]; however, dual‐task studies report decrements in task performance when subjects have to divide their attention between modalities [Alsius et al., 2005, 2007; Spence and Read, 2003]. Johnson and Zatorre [2006] found that splitting attention between modalities produced equivalent memory performance compared to attending to selective bimodal attention. In this study, accuracy was emphasized over speed of response. Also, given the high level of accuracy with which subjects performed the motor task, it is possible that a ceiling effect may have limited the ability to detect task‐related differences, but further studies are needed to more precisely determine the behavioral effects of crossmodal interactions.
Our findings extend the observation of multisensory interactions in sensory cortex to the visual‐somatosensory domain and provide further evidence that the requirement to use information from different modalities can modulate sensory processing at early stages. It is important to note that the task used in this experiment was not designed to meet the requirements for multisensory integration across modalities, but instead was intended to explore how crossmodal stimuli interact within sensory‐specific cortex. The strength of this task is that it allowed us to manipulate the modality of the stimuli while keeping the relevance of the stimuli and the motor requirements constant. Limitations of this study include the temporal resolution of fMRI, which constrained our ability to investigate the precise timing of the observed crossmodal modulations, and the nature of the behavioral task within the fMRI environment, may have limited the sensitivity of this measure. Future studies will be required to investigate the temporal nature of crossmodal interactions in sensory cortex and to determine the consequences of this modulation for sensory‐guided movement.
Acknowledgements
The authors thank Amaya Singh, Caron Murray, and Ruby Endre for technical assistance.
REFERENCES
- Allison T, McCarthy G, Wood CC ( 1992): The relationship between human long‐latency somatosensory evoked potentials recorded from the cortical surface and from the scalp. Electroencephalogr Clin Neurophysiol 84: 301–314. [DOI] [PubMed] [Google Scholar]
- Alsius A, Navarra J, Campbell R, Soto‐Faraco S ( 2005): Audiovisual integration of speech falters under high attention demands. Curr Biol 15: 839–843. [DOI] [PubMed] [Google Scholar]
- Alsius A, Navarra J, Soto‐Faraco S ( 2007): Attention to touch weakens audiovisual speech integration. Exp Brain Res 183: 399–404. [DOI] [PubMed] [Google Scholar]
- Andersen RA, Snyder LH, Bradley DC, Xing J ( 1997): Multimodal representation of space in the posterior parietal cortex and its use in planning movements. Annu Rev Neurosci 20: 303–330. [DOI] [PubMed] [Google Scholar]
- Andersen SK, Hillyard SA, Muller MM ( 2008): Attention facilitates multiple stimulus features in parallel in human visual cortex. Curr Biol 18: 1006–1009. [DOI] [PubMed] [Google Scholar]
- Axmacher N, Schmitz DP, Wagner T, Elger CE, Fell J ( 2008): Interactions between medial temporal lobe, prefrontal cortex, and inferior temporal regions during visual working memory: a combined intracranial EEG and functional magnetic resonance imaging study. J Neurosci 28: 7304–7312. [DOI] [PMC free article] [PubMed] [Google Scholar]
- Beauchamp MS, Lee KE, Argall BD, Martin A ( 2004): Integration of auditory and visual information about objects in superior temporal sulcus. Neuron 41: 809–823. [DOI] [PubMed] [Google Scholar]
- Beauchamp MS, Yasar NE, Frye RE, Ro T ( 2008): Touch, sound and vision in human superior temporal sulcus. Neuroimage 41: 1011–1020. [DOI] [PMC free article] [PubMed] [Google Scholar]
- Boynton GM, Engel SA, Glover GH, Heeger DJ ( 1996): Linear systems analysis of functional magnetic resonance imaging in human V1. J Neurosci 16: 4207–4221. [DOI] [PMC free article] [PubMed] [Google Scholar]
- Burton H, Abend NS, MacLeod AM, Sinclair RJ, Snyder AZ, Raichle ME ( 1999): Tactile attention tasks enhance activation in somatosensory regions of parietal cortex: A positron emission tomography study. Cereb Cortex 9: 662–674. [DOI] [PubMed] [Google Scholar]
- Burton H, Sinclair RJ, Hong SY, Pruett JR Jr, Whang KC ( 1997): Tactile‐spatial and cross‐modal attention effects in the second somatosensory and 7b cortical areas of rhesus monkeys. Somatosens Mot Res 14: 237–267. [DOI] [PubMed] [Google Scholar]
- Burton H, Sinclair RJ, McLaren DG ( 2008): Cortical network for vibrotactile attention: A fMRI study. Hum Brain Mapp 29: 207–221. [DOI] [PMC free article] [PubMed] [Google Scholar]
- Calvert GA ( 2001): Crossmodal processing in the human brain: Insights from functional neuroimaging studies. Cereb Cortex 11: 1110–1123. [DOI] [PubMed] [Google Scholar]
- Cappe C, Barone P ( 2005): Heteromodal connections supporting multisensory integration at low levels of cortical processing in the monkey. Eur J Neurosci 22: 2886–2902. [DOI] [PubMed] [Google Scholar]
- Corbetta M ( 1998): Frontoparietal cortical networks for directing attention and the eye to visual locations: Identical, independent, or overlapping neural systems? Proc Natl Acad Sci USA 95: 831–838. [DOI] [PMC free article] [PubMed] [Google Scholar]
- Corbetta M, Akbudak E, Conturo TE, Snyder AZ, Ollinger JM, Drury HA, Linenweber MR, Petersen SE, Raichle ME, Van Essen DC, Shulman GL ( 1998): A common network of functional areas for attention and eye movements. Neuron 21: 761–773. [DOI] [PubMed] [Google Scholar]
- Corbetta M, Miezin FM, Shulman GL, Petersen SE ( 1991): Selective attention modulates extrastriate visual regions in humans during visual feature discrimination and recognition. Ciba Found Symp 163: 165–75; discussion 175–180. [DOI] [PubMed] [Google Scholar]
- Deiber MP, Ibanez V, Sadato N, Hallett M ( 1996): Cerebral structures participating in motor preparation in humans: A positron emission tomography study. J Neurophysiol 75: 233–247. [DOI] [PubMed] [Google Scholar]
- Downar J, Crawley AP, Mikulis DJ, Davis KD ( 2001): The effect of task relevance on the cortical response to changes in visual and auditory stimuli: An event‐related fMRI study. Neuroimage 14: 1256–1267. [DOI] [PubMed] [Google Scholar]
- Driver J, Spence C ( 1998): Crossmodal attention. Curr Opin Neurobiol 8: 245–253. [DOI] [PubMed] [Google Scholar]
- Eimer M ( 2001): Crossmodal links in spatial attention between vision, audition, and touch: Evidence from event‐related brain potentials. Neuropsychologia 39: 1292–1303. [DOI] [PubMed] [Google Scholar]
- Eimer M, Driver J ( 2000): An event‐related brain potential study of cross‐modal links in spatial attention between vision and touch. Psychophysiology 37: 697–705. [PubMed] [Google Scholar]
- Eimer M, van Velzen J ( 2005): Spatial tuning of tactile attention modulates visual processing within hemifields: An ERP investigation of crossmodal attention. Exp Brain Res 166: 402–410. [DOI] [PMC free article] [PubMed] [Google Scholar]
- Fiez JA, Raichle ME, Balota DA, Tallal P, Petersen SE ( 1996): PET activation of posterior temporal regions during auditory word presentation and verb generation. Cereb Cortex 6: 1–10. [DOI] [PubMed] [Google Scholar]
- Forman SD, Cohen JD, Fitzgerald M, Eddy WF, Mintun MA, Noll DC ( 1995): Improved assessment of significant activation in functional magnetic resonance imaging (fMRI): Use of a cluster‐size threshold. Magn Reson Med 33: 636–647. [DOI] [PubMed] [Google Scholar]
- Foxe JJ, Schroeder CE ( 2005): The case for feedforward multisensory convergence during early cortical processing. Neuroreport 16: 419–423. [DOI] [PubMed] [Google Scholar]
- Foxe JJ, Wylie GR, Martinez A, Schroeder CE, Javitt DC, Guilfoyle D, Ritter W, Murray MM ( 2002): Auditory‐somatosensory multisensory processing in auditory association cortex: an fMRI study. J Neurophysiol 88: 540–543. [DOI] [PubMed] [Google Scholar]
- Fujiwara N, Imai M, Nagamine T, Mima T, Oga T, Takeshita K, Toma K, Shibasaki H ( 2002): Second somatosensory area (SII) plays a significant role in selective somatosensory attention. Brain Res Cogn Brain Res 14: 389–397. [DOI] [PubMed] [Google Scholar]
- Gazzaley A, Rissman J, Cooney J, Rutman A, Seibert T, Clapp W, D'Esposito M ( 2007): Functional interactions between prefrontal and visual association cortex contribute to top‐down modulation of visual processing. Cereb Cortex 17( Suppl 1): i125–i135. [DOI] [PMC free article] [PubMed] [Google Scholar]
- Ghatan PH, Hsieh JC, Petersson KM, Stone‐Elander S, Ingvar M ( 1998): Coexistence of attention‐based facilitation and inhibition in the human cortex. Neuroimage 7: 23–29. [DOI] [PubMed] [Google Scholar]
- Ghazanfar AA, Maier JX, Hoffman KL, Logothetis NK ( 2005): Multisensory integration of dynamic faces and voices in rhesus monkey auditory cortex. J Neurosci 25: 5004–5012. [DOI] [PMC free article] [PubMed] [Google Scholar]
- Giard MH, Peronnet F ( 1999): Auditory‐visual integration during multimodal object recognition in humans: A behavioral and electrophysiological study. J Cogn Neurosci 11: 473–490. [DOI] [PubMed] [Google Scholar]
- Graham SJ, Staines WR, Nelson A, Plewes DB, McIlroy WE ( 2001): New devices to deliver somatosensory stimuli during functional MRI. Magn Reson Med 46: 436–442. [DOI] [PubMed] [Google Scholar]
- Grahn JA, Parkinson JA, Owen AM ( 2008): The cognitive functions of the caudate nucleus. Prog Neurobiol 86: 141–155. [DOI] [PubMed] [Google Scholar]
- Haxby JV, Grady CL, Horwitz B, Ungerleider LG, Mishkin M, Carson RE, Herscovitch P, Schapiro MB, Rapoport SI ( 1991): Dissociation of object and spatial visual processing pathways in human extrastriate cortex. Proc Natl Acad Sci USA 88: 1621–1625. [DOI] [PMC free article] [PubMed] [Google Scholar]
- Jancke L, Mirzazade S, Shah NJ ( 1999): Attention modulates activity in the primary and the secondary auditory cortex: A functional magnetic resonance imaging study in human subjects. Neurosci Lett 266: 125–128. [DOI] [PubMed] [Google Scholar]
- Johansen‐Berg H, Christensen V, Woolrich M, Matthews PM ( 2000): Attention to touch modulates activity in both primary and secondary somatosensory areas. Neuroreport 11: 1237–1241. [DOI] [PubMed] [Google Scholar]
- Johnson JA, Zatorre RJ ( 2005): Attention to simultaneous unrelated auditory and visual events: Behavioral and neural correlates. Cereb Cortex 15: 1609–1620. [DOI] [PubMed] [Google Scholar]
- Johnson JA, Zatorre RJ ( 2006): Neural substrates for dividing and focusing attention between simultaneous auditory and visual events. Neuroimage 31: 1673–1681. [DOI] [PubMed] [Google Scholar]
- Kayser C, Logothetis NK ( 2007): Do early sensory cortices integrate cross‐modal information? Brain Struct Funct 212: 121–132. [DOI] [PubMed] [Google Scholar]
- Kayser C, Petkov CI, Augath M, Logothetis NK ( 2005): Integration of touch and sound in auditory cortex. Neuron 48: 373–384. [DOI] [PubMed] [Google Scholar]
- Kayser C, Petkov CI, Logothetis NK ( 2008): Visual modulation of neurons in auditory cortex. Cereb Cortex 18: 1560–1574. [DOI] [PubMed] [Google Scholar]
- Kennett S, Eimer M, Spence C, Driver J ( 2001): Tactile‐visual links in exogenous spatial attention under different postures: Convergent evidence from psychophysics and ERPs. J Cogn Neurosci 13: 462–478. [DOI] [PubMed] [Google Scholar]
- Knight RT, Staines WR, Swick D, Chao LL ( 1999): Prefrontal cortex regulates inhibition and excitation in distributed neural networks. Acta Psychol (Amst) 101: 159–178. [DOI] [PubMed] [Google Scholar]
- Lakatos P, Chen CM, O'Connell MN, Mills A, Schroeder CE ( 2007): Neuronal oscillations and multisensory interaction in primary auditory cortex. Neuron 53: 279–292. [DOI] [PMC free article] [PubMed] [Google Scholar]
- Macaluso E, Frith CD, Driver J ( 2000): Modulation of human visual cortex by crossmodal spatial attention. Science 289: 1206–1208. [DOI] [PubMed] [Google Scholar]
- Macaluso E, Frith CD, Driver J ( 2002): Directing attention to locations and to sensory modalities: Multiple levels of selective processing revealed with PET. Cereb Cortex 12: 357–368. [DOI] [PubMed] [Google Scholar]
- Martuzzi R, Murray MM, Michel CM, Thiran JP, Maeder PP, Clarke S, Meuli RA ( 2007): Multisensory interactions within human primary cortices revealed by BOLD dynamics. Cereb Cortex 17: 1672–1679. [DOI] [PubMed] [Google Scholar]
- McDonald JJ, Teder‐Salejarvi WA, Heraldez D, Hillyard SA ( 2001a): Electrophysiological evidence for the “missing link” in crossmodal attention. Can J Exp Psychol 55: 141–149. [DOI] [PubMed] [Google Scholar]
- McDonald JJ, Teder‐Salejarvi WA, Ward LM ( 2001b): Multisensory integration and crossmodal attention effects in the human brain. Science 292: 1791. [DOI] [PubMed] [Google Scholar]
- Meehan SK, Staines WR ( 2007): The effect of task‐relevance on primary somatosensory cortex during continuous sensory‐guided movement in the presence of bimodal competition. Brain Res 1138: 148–158. [DOI] [PubMed] [Google Scholar]
- Mesulam MM ( 1990): Large‐scale neurocognitive networks and distributed processing for attention, language, and memory. Ann Neurol 28: 597–613. [DOI] [PubMed] [Google Scholar]
- Miller BT, D'Esposito M ( 2005a): Searching for “the top” in top‐down control. Neuron 48: 535–538. [DOI] [PubMed] [Google Scholar]
- Miller LM, D'Esposito M ( 2005b): Perceptual fusion and stimulus coincidence in the cross‐modal integration of speech. J Neurosci 25: 5884–5893. [DOI] [PMC free article] [PubMed] [Google Scholar]
- Mima T, Nagamine T, Nakamura K, Shibasaki H ( 1998): Attention modulates both primary and second somatosensory cortical activities in humans: A magnetoencephalographic study. J Neurophysiol 80: 2215–2221. [DOI] [PubMed] [Google Scholar]
- Molholm S, Ritter W, Murray MM, Javitt DC, Schroeder CE, Foxe JJ ( 2002): Multisensory auditory‐visual interactions during early sensory processing in humans: A high‐density electrical mapping study. Brain Res Cogn Brain Res 14: 115–128. [DOI] [PubMed] [Google Scholar]
- Moran J, Desimone R ( 1985): Selective attention gates visual processing in the extrastriate cortex. Science 229: 782–784. [DOI] [PubMed] [Google Scholar]
- Murray MM, Molholm S, Michel CM, Heslenfeld DJ, Ritter W, Javitt DC, Schroeder CE, Foxe JJ ( 2005): Grabbing your ear: Rapid auditory‐somatosensory multisensory interactions in low‐level sensory cortices are not constrained by stimulus alignment. Cereb Cortex 15: 963–974. [DOI] [PubMed] [Google Scholar]
- Nakashita S, Saito DN, Kochiyama T, Honda M, Tanabe HC, Sadato N ( 2008): Tactile‐visual integration in the posterior parietal cortex: A functional magnetic resonance imaging study. Brain Res Bull 75: 513–525. [DOI] [PubMed] [Google Scholar]
- Nelson AJ, Staines WR, Graham SJ, McIlroy WE ( 2004): Activation in SI and SII: The influence of vibrotactile amplitude during passive and task‐relevant stimulation. Brain Res Cogn Brain Res 19: 174–184. [DOI] [PubMed] [Google Scholar]
- Petkov CI, Kang X, Alho K, Bertrand O, Yund EW, Woods DL ( 2004): Attentional modulation of human auditory cortex. Nat Neurosci 7: 658–663. [DOI] [PubMed] [Google Scholar]
- Posner MI, Petersen SE ( 1990): The attention system of the human brain. Annu Rev Neurosci 13: 25–42. [DOI] [PubMed] [Google Scholar]
- Ranganath C, D'Esposito M ( 2005): Directing the mind's eye: Prefrontal, inferior and medial temporal mechanisms for visual working memory. Curr Opin Neurobiol 15: 175–182. [DOI] [PubMed] [Google Scholar]
- Rissman J, Gazzaley A, D'Esposito M ( 2008): Dynamic adjustments in prefrontal, hippocampal, and inferior temporal interactions with increasing visual working memory load. Cereb Cortex 18: 1618–1629. [DOI] [PMC free article] [PubMed] [Google Scholar]
- Rushworth MF, Paus T, Sipila PK ( 2001): Attention systems and the organization of the human parietal cortex. J Neurosci 21: 5262–5271. [DOI] [PMC free article] [PubMed] [Google Scholar]
- Rushworth MF, Taylor PC ( 2006): TMS in the parietal cortex: Updating representations for attention and action. Neuropsychologia 44: 2700–2716. [DOI] [PubMed] [Google Scholar]
- Schroeder CE, Foxe J ( 2005): Multisensory contributions to low‐level, “unisensory” processing. Curr Opin Neurobiol 15: 454–458. [DOI] [PubMed] [Google Scholar]
- Schurmann M, Caetano G, Hlushchuk Y, Jousmaki V, Hari R ( 2006): Touch activates human auditory cortex. Neuroimage 30: 1325–1331. [DOI] [PubMed] [Google Scholar]
- Schurmann M, Kolev V, Menzel K, Yordanova J ( 2002): Spatial coincidence modulates interaction between visual and somatosensory evoked potentials. Neuroreport 13: 779–783. [DOI] [PubMed] [Google Scholar]
- Shulman GL, Corbetta M, Buckner RL, Raichle ME, Fiez JA, Miezin FM, Petersen SE ( 1997): Top‐down modulation of early sensory cortex. Cereb Cortex 7: 193–206. [DOI] [PubMed] [Google Scholar]
- Spence C ( 2002): Multisensory attention and tactile information‐processing. Behav Brain Res 135: 57–64. [DOI] [PubMed] [Google Scholar]
- Spence C, Read L ( 2003): Speech shadowing while driving: on the difficulty of splitting attention between eye and ear. Psychol Sci 14: 251–256. [DOI] [PubMed] [Google Scholar]
- Staines WR, Graham SJ, Black SE, McIlroy WE ( 2002): Task‐relevant modulation of contralateral and ipsilateral primary somatosensory cortex and the role of a prefrontal‐cortical sensory gating system. Neuroimage 15: 190–199. [DOI] [PubMed] [Google Scholar]
- Steinmetz PN, Roy A, Fitzgerald PJ, Hsiao SS, Johnson KO, Niebur E ( 2000): Attention modulates synchronized neuronal firing in primate somatosensory cortex. Nature 404: 187–190. [DOI] [PubMed] [Google Scholar]
- Sussman ES, Bregman AS, Wang WJ, Khan FJ ( 2005): Attentional modulation of electrophysiological activity in auditory cortex for unattended sounds within multistream auditory environments. Cogn Affect Behav Neurosci 5: 93–110. [DOI] [PubMed] [Google Scholar]
- Talairach J, Tournoux P. 1988. Co‐Planar Stereotaxic Atlas of the Human Brain: 3‐Dimensional Proportional System: An Approach to Cerebral Imaging. New York, NY: Stuttgart; 122 p. [Google Scholar]
- Teder‐Salejarvi WA, Di Russo F, McDonald JJ, Hillyard SA ( 2005): Effects of spatial congruity on audio‐visual multimodal integration. J Cogn Neurosci 17: 1396–1409. [DOI] [PubMed] [Google Scholar]
- Teder‐Salejarvi WA, McDonald JJ, Di Russo F, Hillyard SA ( 2002): An analysis of audio‐visual crossmodal integration by means of event‐related potential (ERP) recordings. Brain Res Cogn Brain Res 14: 106–114. [DOI] [PubMed] [Google Scholar]
- Thoenissen D, Zilles K, Toni I ( 2002): Differential involvement of parietal and precentral regions in movement preparation and motor intention. J Neurosci 22: 9024–9034. [DOI] [PMC free article] [PubMed] [Google Scholar]
- Toni I, Shah NJ, Fink GR, Thoenissen D, Passingham RE, Zilles K ( 2002): Multiple movement representations in the human brain: an event‐related fMRI study. J Cogn Neurosci 14: 769–784. [DOI] [PubMed] [Google Scholar]
- Toni I, Thoenissen D, Zilles K ( 2001): Movement preparation and motor intention. Neuroimage 14: S110–S117. [DOI] [PubMed] [Google Scholar]
- van Atteveldt N, Formisano E, Goebel R, Blomert L ( 2004): Integration of letters and speech sounds in the human brain. Neuron 43: 271–282. [DOI] [PubMed] [Google Scholar]
- Van de Winckel A, Sunaert S, Wenderoth N, Peeters R, Van Hecke P, Feys H, Horemans E, Marchal G, Swinnen SP, Perfetti C, De Weerdt W ( 2005): Passive somatosensory discrimination tasks in healthy volunteers: Differential networks involved in familiar versus unfamiliar shape and length discrimination. Neuroimage 26: 441–453. [DOI] [PubMed] [Google Scholar]
- Watanabe T, Sasaki Y, Miyauchi S, Putz B, Fujimaki N, Nielsen M, Takino R, Miyakawa S ( 1998): Attention‐regulated activity in human primary visual cortex. J Neurophysiol 79: 2218–2221. [DOI] [PubMed] [Google Scholar]
- Woldorff MG, Gallen CC, Hampson SA, Hillyard SA, Pantev C, Sobel D, Bloom FE ( 1993): Modulation of early sensory processing in human auditory cortex during auditory selective attention. Proc Natl Acad Sci USA 90: 8722–8726. [DOI] [PMC free article] [PubMed] [Google Scholar]
- Yamaguchi S, Knight RT ( 1990): Gating of somatosensory input by human prefrontal cortex. Brain Res 521: 281–288. [DOI] [PubMed] [Google Scholar]
- Zhou YD, Fuster JM ( 2000): Visuo‐tactile cross‐modal associations in cortical somatosensory cells. Proc Natl Acad Sci USA 97: 9777–9782. [DOI] [PMC free article] [PubMed] [Google Scholar]