

Abstract
This study investigates the (re‐)organization of somatosensory functions following early brain lesions. Using functional magnetic resonance imaging (fMRI), passive hand movement was studied. Transcranial magnetic stimulation (TMS) and magnetoencephalography (MEG) were used as complementary methods. fMRI data was analyzed on the first level with regard to topographical variability; second‐level group effects as well as the overall integrity of the somatosensory circuitry were also assessed. Subjects with unilateral brain lesions occurring in the third trimester of pregnancy or perinatally with different types of motor reorganization were included: patients with regular, contralateral motor organization following middle cerebral artery strokes (CONTRAMCA, n = 6) and patients with reorganized, ipsilateral motor functions due to periventricular lesions (IPSIPL, n = 8). Motor impairment was similar, but sensory impairment was more pronounced in the CONTRAMCA group. Using fMRI and MEG, both groups showed a normal pattern with a contralateral somatosensory representation, despite the transhemispherically reorganized primary motor cortex in the IPSIPL group, as verified by TMS. Activation topography for the paretic hands was more variable than for the nonparetic hand in both groups. The cortico‐cerebellar circuitry was well‐preserved in almost all subjects. We conclude that in both models of motor reorganization, no interhemispheric reorganization of somatosensory functions occurred. Also, no relevant intrahemispheric reorganization was observed apart from a higher topographical variability of fMRI activations. This preserved pattern of somatosensory organization argues in favor of a differential lesion effect on motor and somatosensory functions and demonstrates a limited compensatory potential for the latter. Hum Brain Mapp, 2009. © 2008 Wiley‐Liss, Inc.
Keywords: brain plasticity, somatosensory reorganization, motor reorganization, congenital hemiparesis, early brain lesions
INTRODUCTION
The developing brain shows great potential for self‐repair when confronted with early insults [Kennard, 1936; Krägeloh‐Mann, 2004]. Such neuronal plasticity is well‐described in the motor domain, where unilateral brain lesions typically cause a contralateral hemiparesis [Back, 2006; Small et al., 2002; Uvebrant, 1988]. Timing is known to play a major role: children are more able to compensate for such insults than adults [Teuber and Reudel, 1962], in line with animal studies [Kennard, 1936; Tower, 1940]. Furthermore, postnatally‐acquired insults are less‐well compensated than insults occurring during pregnancy [Carr et al., 1993], and even within pregnancy, the compensatory potential decreases towards term [Staudt et al., 2004].
In recent years, several groups have shown a special mechanism of compensation in the motor domain: following unilateral early brain lesions, the neuronal representation of the primary motor region (M1) is reorganized to the ipsilateral hemisphere [i.e., both motor representations are located in the contralesional hemisphere; Carr et al., 1993, Guzzetta et al., 2007a; Jang et al., 2001; Ragazzoni et al., 2002]. This pattern of motor reorganization is influenced by lesion size [only larger lesions will induce this “shift”; Staudt et al., 2000, 2002]; it is nicely explained by neuroembryological studies showing that the adult pattern of contralateral motor representation is preceded by early bilateral motor projections which are only “withdrawn” later, depending on activity [Carr et al., 1993; Eyre et al., 2001].
While the motor system has been studied extensively, the impact of such a lesion on the somatosensory domain is much less clear. Somatosensory impairment may be present in children with lesion‐induced hemiparesis, but is much more difficult to assess than the more obvious and defining motor impairment [Cooper et al., 1995; Rosenbaum et al., 2007]. For example, Maegaki et al. described such a case where the somatosensory cortex was reorganized into the contralesional hemisphere [1995]. In another single‐case observation, Ragazzoni et al. suggested that sensory function is preserved through slow‐conducting connections to ipsilateral, nonprimary somatosensory cortex areas [2002]. In contrast to this, we could show that, despite a reorganized, ipsilateral M1, the primary somatosensory cortex (S1) still resides in the affected, contralateral hemisphere in subjects with periventricular lesions [Staudt et al., 2006], and a similar pattern was present in 5/12 subjects with different brain lesions in a recent study [Guzzetta et al., 2007a]. It is now accepted that a hemispheric dissociation between primary motor and somatosensory representations may occur under special circumstances [Cohen et al., 1991; Staudt et al., 2006; Thickbroom et al., 2001].
Such disparate reorganization of motor and somatosensory functions could be due to a number of reasons. First, the initially bilateral motor projections could offer “a way out” for the damaged motor but not somatosensory cortex [Eyre et al., 2001]. Furthermore, the later‐developing ascending somatosensory fiber tracts [Kostovic and Judas, 2002] may be able to bypass primarily white‐matter lesion to still reach their original cortical target region [Staudt et al., 2006]. However, an interplay between motor and somatosensory reorganization could also be hypothesized, in so far as a lesioned hemisphere might be unable to fully support both motor and somatosensory functions, as observed within other domains [Lidzba et al., 2006].
The aim of this study was therefore to investigate the individual topography and the group pattern of somatosensory representation of the paretic hand following early brain injury, as well as their relation with clinical characteristics. As one group alone would not allow disentangling the effects of lesion type and motor reorganization, we examined two groups of patients with carefully‐defined early brain lesions but different patterns of motor reorganization. The first group comprised subjects without evidence of motor reorganization and the regular, contralateral representation of the primary motor cortex; this is typically found following middle cerebral artery infarcts occurring during the late third trimester of pregnancy or perinatally (CONTRAMCA). The second group included subjects with a reorganized, ipsilateral motor system, typically found following early third trimester periventricular white matter lesions [IPSIPL; Staudt et al., 2004]. It is important to note that despite these fundamental differences in motor organization, both lesions lead to a comparable motor deficit, namely a contralateral hemiparesis of moderate degree [Claeys et al., 1983; Uvebrant, 1988]. We believe that it is imperative to control for this confound, although it must be admitted that this choice is arguable; we will discuss below our rationale for proceeding as we did. Between these two complementary groups, the interrelation between lesion and motor and somatosensory reorganization can be investigated, especially as the nonparetic hand in each subject constitutes an additional reference point.
SUBJECTS AND METHODS
Subjects
Subjects with a unilateral brain lesion (MCA stroke or periventricular lesion [PL] due to unilateral periventricular leukomalacia or white matter hemorrhage) and clinically apparent hemiparesis were recruited as part of an ongoing study [Staudt et al., 2000, 2002, 2003, 2004, 2006]. MCA strokes typically occur late in the third trimester or peri/neonatally while PL occur early in the third trimester [Krägeloh‐Mann, 2004]. Subjects with MCA stroke were only included if they had a preserved contralateral motor representation (CONTRAMCA); for the PL group, a purely ipsilateral representation of the primary motor cortex was required (IPSIPL). Institutional review board approval and informed consent were obtained for all subjects. Exclusion criteria were as follows: mental retardation, pregnancy, epilepsy, or technical contraindications to an MRI‐examination (including orthodontic braces).
Clinical Characteristics
Motor function was characterized using a standardized, video‐documented neurological assessment as described earlier [Staudt et al., 2002, 2004]. The grading was normal performance of a sequential finger opposition task, (1): slow or incomplete performance, (2): inability to perform any independent finger movement, but with a preserved grasp function, (3): no active grasping, (4): higher values reflect stronger impairment.
Somatosensory functions were characterized by the distance below which two points of tactile stimulation on both thumbs could not be distinguished anymore (2‐point discrimination, 2pd; higher values reflect stronger impairment). This parameter was shown to correlate well with extensive sensory assessments batteries [Williams et al., 2006]. Additionally, the threshold for detecting vibration stemming from a tuning fork was assessed [vibratory sense, vib; Pestronk et al., 2004]. Upon placing the tuning fork on the radial epicondylus, subjects had to report when they ceased to feel the vibration, measured on a scale from 0 to 8 as inscribed on the tuning fork (lower values indicate stronger impairment).
TMS and MEG
To identify primary motor cortex (M1), transcranial magnetic stimulation (TMS) was employed [Currà et al., 2002]. This method tests for the presence of descending corticospinal projections by applying a short single pulse over the hand area of each motor cortex [Staudt et al., 2002]. Short‐latency motor evoked potentials (MEP) were recorded using surface EMG electrodes, attached over the M. abductor pollicis brevis. Absence of corticospinal projections from one hemisphere was assumed when stimulation with either 100% stimulator output or 200% of the individual motor threshold did not yield reproducible MEP responses [Staudt et al., 2002].
The primary somatosensory cortex (S1) was identified using magnetoencephalography [MEG; Simos et al., 2000], employing a passive stimulation paradigm [Staudt et al., 2006]. Somatosensory evoked fields (SEFs) were generated by tactile stimulation to each thumb. With stimulus duration of 50 ms and a randomly‐varying interstimulus interval (500–750 ms), 500 epochs were recorded; digitization frequency was 625 Hz. The data was low‐pass filtered at 208 Hz and, off‐line, high‐pass filtered at 10 Hz. The N20m response was used to identify the primary somatosensory representation of the stimulated hand [Kakigi, 1994]. Source localization was performed on the basis of a spherical head model derived from the individual anatomical MRI scan (see below), using a single equivalent dipole.
Imaging Procedure
Imaging was done using an Avanto 1.5T MR‐scanner equipped with a standard quadrature head coil (Siemens, Erlangen, Germany). A whole‐brain echo‐planar, T2* weighted sequence (TR = 3.75 s, TE = 50 ms, 36 axial slices, 3 × 3 mm2 in‐plane resolution, and 0.75 mm gap) was used to acquire functional image of passive movement of either the paretic hand or the nonparetic hand, contrasted with rest (four epochs each). Passive hand movement is preferable over active tasks when determining the somatosensory cortex as the motor contribution is minimal [Guzzetta et al., 2007b; Thickbroom et al., 2001]. A block design was used lasting 4 min (64 scans), and the scanner's online tracking feature was used to check data quality immediately (experiments were repeated in the case of visible motion artifacts). A T1‐weighted 3D anatomical whole‐brain dataset was also acquired (FLASH, TR/TE = 11/4.94 ms, resolution = 1 mm3).
Image Data Processing
Image processing was done using statistical parametrical mapping software, SPM5 (Wellcome Department of Imaging Neuroscience, University College London, UK) running in MATLAB (The MathWorks, Natick, USA). As some brain lesions were on the left and others on the right side of the brain, images in the CONTRAMCA group were flipped so that all lesions were on the right side of the image; those in the IPSIPL group were flipped so that all lesions were on the left side of the image (see also Fig. 1); this artificial homogenization allows for later voxel‐wise analyses. To preclude preferential segmentation and normalization of the nonflipped images, the prior probability tissue‐maps used by SPM5 were also flipped and rendered symmetrical. The 3D dataset was segmented in native‐space, using a unified segmentation approach [Ashburner and Friston, 2005]. The segmented tissue maps were coregistered to the mean functional image from the first session. Using custom scripts, nonbrain and lesioned tissue was excluded, taking advantage of the fact that the lesions were consistently classified as CSF. The resulting lesion mask was then applied during spatial normalization where the individual GM map was mapped to the symmetrical gray matter prior, minimizing the influence from nonbrain or lesioned tissue. Default values were used (12‐parameter affine, followed by 16 nonlinear iterations using basis functions with a cutoff of 25 mm). Such a cost‐function masking effectively precludes the lesion from influencing spatial normalization [Brett et al., 2001]. These parameters were then used to normalize the functional series to a final resolution of 3 × 3 × 3 mm3 which were then smoothed with a Gaussian filter of FWHM = 15 mm to account for interindividual differences and to increase signal to noise. Despite some large lesions, normalization worked well in all subjects, as visually judged by one expert rater. Each lesion was manually delineated to illustrate lesion topography, using MRIcro (http://www.mricro.com), see Figure 1.
Figure 1.
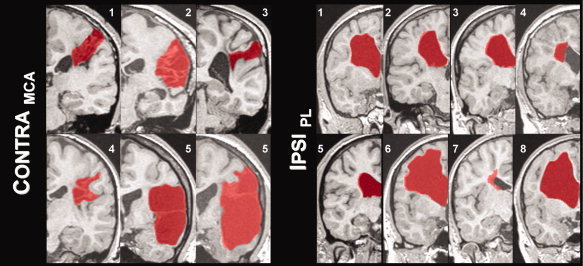
Illustration of lesion type and individual size (normalized images after flipping): lesions are marked in red in one representative coronal slice. Subject numbers correspond to those in Table I; see text for details.
Data Analysis
Because of sample sizes, clinical characteristics were analyzed using a nonparametrical Mann‐Whitney U‐test; correlations were assessed using Kendall's rank correlation. In all cases, the maximum number of permutations was computed. Significance was assumed at P ≤ 0.05.
Functional MRI data was statistically analyzed using SPM5 (first level) and snpm3 on SPM5 [second level; Nichols and Holmes, 2001]. For each individual (first level), conventional analyses were done, testing for the difference between the active and the control condition and applying the framework of the general linear model [Friston et al., 1995]. A corrected cutoff of P ≤ 0.05 [Genovese et al., 2002] was used. Analyses were designed to answer three distinct questions: one, to assess the topographical variability of activations between subjects; two, to illustrate group effects, uninfluenced by possible outliers; and three, to investigate the overall integrity of the neuronal circuitry by relating cortical and cerebellar activations. These analyses shall now be described in more detail.
To assess the individual variability of the activation patterns, we assessed the significant cluster within Rolandic cortex. We used a weighted center of mass (comw) according to
such that the individual coordinate (coordi) is weighted by its t‐value (t i) before being scaled by the overall sum of t‐values (sumt) within the cluster [Ramsey et al., 1996; Tzourio et al., 1998].
Group analyses (second level) were done using a nonparametric approach [Friston et al., 1999; Nichols and Holmes, 2001] and employing permutation‐based statistics. These were calculated for each hand in each group, applying a threshold of P ≤ 0.05, corrected for multiple comparisons.
To assess if reorganization occurred on another level of the somatosensory system, activation in the primary sensory cortex was related to activation in the cerebellum as, in the healthy brain, contralateral activation in S1 will be accompanied by ipsilateral cerebellar activation [Gao et al., 1996]. We therefore expected an inverse relation between lateralization indices obtained from central and cerebellar regions, respectively, for the nonparetic hands; a similar pattern would be seen for the paretic hands if no reorganization of primary or cerebellar sensory regions occurred. To this effect, lateralization indices were generated from the raw statistical maps [Holland et al., 2001] from the first level analyses, using a designated toolbox [Wilke and Lidzba, 2007]. Rolandic cortex and cerebellum were defined as regions of interest, using standard anatomical delineations available within MARINA (http://www.bion.de) which were preprocessed as described before [Wilke et al., 2003b]. The statistical values within these regions of interest were then used to calculate a lateralization index between −1 (pure right) and +1 [pure left; Wilke and Lidzba, 2007]. Plotting the lateralization indices from both regions allows to describe their relation [expected: leftward cortical is accompanied by rightward cerebellar activation, and vice versa; Gao et al., 1996].
RESULTS
Subjects
Overall, 15 patients were recruited, but one subject from the MCA group was excluded because of excessive motion during the fMRI. Therefore, six subjects could be included in the CONTRAMCA group and eight in the IPSIPL group. Within the CONTRAMCA group, all subjects had radiological evidence of an involvement of the postcentral gyrus in the lesion, mainly in lateral aspects. No cortical involvement could be seen in the IPSIPL group. Demographic details are summarized in Table I; an illustration of each individual lesion (outlined in red) is shown in Figure 1.
Table I.
Demographic data from both groups
| Group | Subj.# | Sex | Age [yr] | Lesion side [L/R] | M1 [TMS] | S1 [MEG] | 2PD [ph/nph] | VIB [ph/nph] | Motor dysfunction [0–4] |
|---|---|---|---|---|---|---|---|---|---|
| CONTRAMCA | 1 | F | 16 | L | contra | contra | 2.5/0.15 | 8/8 | 2 |
| 2 | F | 19 | L | contra | contra | 4.4/0.2 | 6/8 | 3 | |
| 3 | M | 20 | R | contra | contra | 8.5/0.1 | 4/8 | 2 | |
| 4 | M | 12 | L | contra | contra | 6/0.5 | 4/8 | 2 | |
| 5 | M | 30 | R | contra | contra | 4.3/0.4 | 4/6 | 3 | |
| 6 | F | 11 | L | contra | contra | 1.2/0.2 | 8/8 | 2 | |
| IPSIPL | 1 | F | 11 | R | ipsi | contra | 0.4/0.2 | 7.5/8 | 2 |
| 2 | F | 21 | L | ipsi | contra | 0.6/0.1 | 7.5/8 | 2 | |
| 3 | M | 19 | R | ipsi | contra | 0.3/0.1 | 8/8 | 2 | |
| 4 | F | 30 | L | ipsi | contra | 0.8/0.5 | 8/8 | 2 | |
| 5 | M | 12 | R | ipsi | contra | 0.3/0.2 | 8/8 | 2 | |
| 6 | M | 12 | L | ipsi | contra | 0.7/0.4 | 8/8 | 2 | |
| 7 | M | 16 | R | ipsi | contra | 0.5/0.3 | 8/8 | 2 | |
| 8 | M | 11 | L | ipsi | contra | 1.5/0.4 | 8/8 | 2 |
Patient numbers correspond to those in Figure 1; see text for details. Yr, year; L/R, left, right; ph/nph, paretic hand, nonparetic hand.
Clinical Characteristics
Motor impairment was comparable between groups, with a motor function score of 2.3 ± 0.5 (CONTRAMCA) versus 2 ± 0 (IPSIPL; z = 1.58; not significant).
Sensory impairment (2‐point discrimination) in the paretic hand was significantly stronger in the CONTRAMCA group than in the IPSIPL group (z = 3.15, P = 0.0016). It also was significantly stronger in the paretic hand than in the nonparetic hand in both groups (CONTRAMCA: 4.5 ± 2.4 versus 0.3 ± 0.1, z = 3.05, P = 0.0023; IPSIPL: 0.6 ± 0.4 versus 0.3 ± 0.1, z = 2.39, P = 0.016). Motor and 2‐point‐discrimination impairment did not correlate in the CONTRAMCA group (z = 0); lack of variability prohibited calculating the correlation in the IPSIPL group. See also Table I.
Sensory impairment of the vibratory sense was less pronounced; the difference between the paretic hands was significant, again with the CONTRAMCA group showing a stronger impairment (z = 1.96, P = 0.049). However, the differences between the paretic hand and the nonparetic hand did not reach significance in either group (CONTRAMCA: 5.7 ± 1.8 versus 7.7 ± 0.7, z = 1.81; IPSIPL: 7.9 ± 0.2 versus 8.0 ± 0, z = 1.36). When comparing the two groups, motor and vibratory sense impairment did not correlate in the CONTRAMCA group (z = 0.6); again, no analysis was possible for the IPSIPL group due to lack of variability.
TMS and MEG
All TMS exams could be completed in all subjects and demonstrated a contralateral M1 for both the paretic and the nonparetic hand in the CONTRAMCA group. In the IPSIPL group, all included subjects showed a reorganized, purely ipsilateral primary motor representation for the paretic hand and a contralateral primary motor representation for the nonparetic hand.
All MEG exams could be completed in all subjects and confirmed contralateral sensory evoked fields, indicative for the primary somatosensory representation S1, for both the paretic and the nonparetic hand in all subjects, in both groups; see also Table I.
fMRI: Variability of Activations
The analysis of the single‐case activation patterns for passive hand movement confirmed contralateral activation for each subject in both groups, as shown in Figure 2. The mean activation foci (averaged comw coordinates) were located at the MNI coordinates [x, y, z] = −38 ± 3.3, −27 ± 2.4, 67.5 ± 2.9, and [x, y, z] = 42 ± 4.9, −27.5 ± 8.7, 65.5 ± 5.6 for the CONTRAMCA group (nonparetic and paretic hand, respectively). For the IPSIPL group, the coordinates were [x, y, z] = 40.9 ± 4.2, −28.1 ± 4.5, 64.5 ± 5.4, and [x, y, z] = −40.9 ± 5.2, −26.6 ± 8.9, 63 ± 5.8 (nonparetic and paretic hand, respectively). When comparing the paretic hand in each group with the nonparetic counterpart in the other group, there were no significant differences for either dimension (CONTRAMCA, paretic hand vs. IPSIPL, nonparetic hand: z = 0.32, 0.57, 0.51; CONTRAMCA, non‐paretic hand vs IPSIPL, paretic hand: z = 0.9, 0.32, 1.63).
Figure 2.
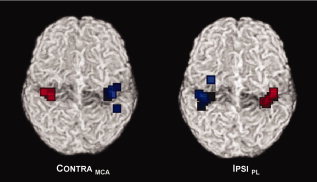
Weighted center of mass of fMRI activation for the paretic hands (blue squares) and the nonparetic hands (red squares), in response to passive movement; note more scattered activation foci for the paretic hands in both groups; see text for details.
Topographically, the variability of the activation foci of the paretic hand (blue squares) is higher than that from the nonparetic hands (red squares) in both groups, as also indicated by the standard deviations. On the basis of this measure, more than 2/3 of the activation foci are expected within a sphere of r = 0.6 voxels versus r = 5.6 voxels, and r = 2.4 voxels versus r = 6.3 voxels (CONTRAMCA vs. IPSIPL, nonparetic and paretic hand).
fMRI: Second‐Level Results
The second‐level fMRI group results are shown in Figure 3, rendered on an individual brain: the somatosensory cortical representation of the nonparetic hand (yellow‐red) is similar to the pattern seen for the paretic hand (blue‐green) in both groups, confirming a contralateral primary somatosensory representation (S1) for both hands in both groups. The clusters were located at the MNI coordinates [x, y, z] = −42, −27, 63; [x, y, z] = 33, −24, 69 for the CONTRAMCA group (nonparetic and paretic hand, respectively). For the IPSIPL group, the coordinates were [x, y, z] = 39, −27, 63; and [x, y, z] = −36, −33, 60 (nonparetic and paretic hand, respectively).
Figure 3.
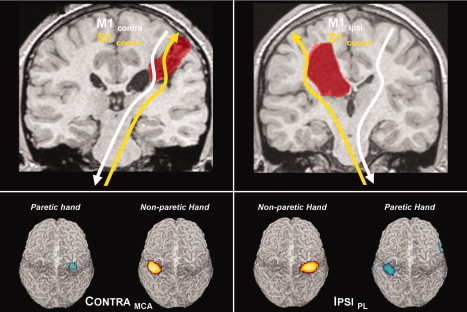
Top panels: illustration of the organization patterns for motor (white) and somatosensory (yellow) cortical representations. Note dissociation in the IPSIPL group. Bottom panels: Second‐level random effects results from passive hand movements in both groups. Note retained contralateral somatosensory representation for both hands in both groups.
fMRI: Somatosensory Networks
Correlating the lateralization of somatosensory activation in central and cerebellar brain regions shows the predicted “opposite” pattern for the nonparetic hands (the open triangles fall within the light gray areas; Fig. 4). An overall very similar but more variable pattern is seen for the paretic hands (dark squares, dark gray areas), in both groups.
Figure 4.
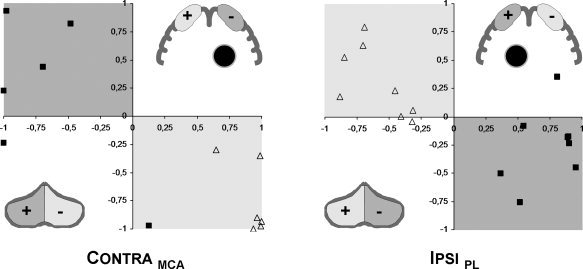
Comparison of lateralization: lateralization in Rolandic (X‐axis) versus cerebellar (Y‐axis) regions of interest for the nonparetic (open triangles) and paretic hand (closed squares). The shaded regions delineate the predicted division (light gray: non‐paretic hand; dark gray: paretic hand): overall preserved “crossed‐over” somatosensory representation in central and cerebellar regions. Inserts: schematic illustration of regions of interest; +/− corresponds to the lateralization indices, the black circle denotes the lesion; shading is as above.
DISCUSSION
This study investigated somatosensory organization following early brain lesions in two different types of motor (re‐)organization. In summary, our two groups showed a comparable motor deficit, but a more pronounced sensory deficit was found in the group with preserved contralateral motor projections (CONTRAMCA). Using fMRI, we found a more variable, but in each case preserved pattern of a contralateral somatosensory representation, which was confirmed in random‐effects group analyses. MEG confirmed that this activation corresponded to S1 in all subjects. Somatosensory reorganization thus was independent of the pattern or motor (re‐)organization. Additionally, we found an overall preserved central‐cerebellar somatosensory circuitry. The results shall now be discussed in more detail.
Subjects
We investigated two groups of subjects with unilateral brain lesions stemming from a defined time period and exhibiting one of two a distinct patterns of motor reorganization. Subjects in the first group had a preserved contralateral M1 following an insult in the territory of the middle cerebral artery (CONTRAMCA). Patients in the second group showed a reorganized, ipsilateral M1 following a periventricular lesion (IPSIPL). These two models are also distinct with regard to the site of the insult (medial vs. lateral) and the structures involved (white matter vs. white and gray matter). However, the time window for both lesions comprises only the short span of the early third trimester of pregnancy (PL) and the peri‐ and neonatal period [MCA infarcts; Krägeloh‐Mann, 2004], our subjects are therefore very homogenous in this regard. Additionally, a recent study including subjects with various types of early and later brain lesions found no influence of the timing of lesion on the type of somatosensory reorganization [Guzzetta et al., 2007a]. The absence of epilepsy in our subjects is of special relevance as this disorder, independently of anatomical lesions, is able to induce neuronal reorganization [Morimoto et al., 2004; Voets et al., 2006]; additionally, all of our subjects had strictly unilateral brain lesions. Removing such confounds is a decisive advantage when relating neuronal reorganization to lesion effects [Lidzba et al., 2006].
Well‐defined though these groups may be, it must be admitted that the effects of motor reorganization and lesion type cannot fully be disentangled when only two groups are investigated: unequivocal evidence regarding the pivotal effect (lesion vs. reorganization) cannot be obtained from the present samples. Ideally, subjects with an MCA infarct and ipsilateral projections and subjects with a PL with contralateral motor projections would serve as additional reference points. However, these subjects were specifically not included in this study: in the latter case, the motor deficit is only slight, while in the former, it is often substantial [to the point of not permitting any useful hand function; Staudt et al., 2004]. A comparable clinical impact and the exploration of all types of reorganization are two distinct, but irreconcilable aims; both would be desirable but cannot be achieved at the same time. On the basis of our experience, we are convinced that exploring all possible types of reorganization would not be helpful as the overall impact of the lesion (and the thus‐ensuing clinical disability) would be very wide, effectively disallowing to compare these subjects. Instead, we opted to investigate two patient groups with a similar clinical impairment in the motor domain. Overall, we believe that our two groups, albeit small and each only reflecting a part of the spectrum, are still particularly suited to address the questions at hand.
Clinical Characteristics
Our two indicators of sensory impairment reflect different sensory qualities [epicritic [2pd] vs. protopathic [vib]; Freeman and Okun, 2002]; they reach the thalamus via the posterior column and the medial lemniscus. The tracts then traverse the periventricular white matter and project to distinct regions within S1 [Kaas et al., 1979]. Not surprisingly, sensory impairment (2‐point‐discrimination distance) was higher in the paretic hand in both groups, but interestingly, the CONTRAMCA group showed a significantly stronger impairment than the IPSIPL group. While the impairment in vibratory sense was less prominent in both groups, the CONTRAMCA group was again significantly more impaired than the IPSIPL group. It is interesting that despite the interplay between M1/S1 in the physiological setting [Tecchio et al., 2006], the group with M1/S1 dissociation shows a less pronounced clinical deficit, suggesting that somatosensory integration is not a predominant factor for the preservation of somatosensory functions, as assessed here. Again, it is important to note that both groups had similar motor impairment, despite different lesion origin and motor organization pattern.
There are two obvious explanations for the less‐impaired sensory functions in the IPSIPL group. While in both groups, S1 is located in the lesioned hemisphere (see below and Fig. 3 for an illustration), only in the CONTRAMCA group this hemisphere also carries M1; this would be compatible with a detrimental influence of M1 on S1, in the sense that motor functions are preserved on account of somatosensory functions. However, no inverse correlation between preserved motor and impaired sensory functions was present, in line with recent results [Guzzetta et al., 2007a]. Currently, it therefore seems more likely that the direct cortical damage (occurring in the CONTRAMCA group but not in the IPSIPL group) plays a more important role in determining the somatosensory outcome than the pattern of motor reorganization. The limited potential for intrahemispheric reorganization (see below) would then be a factor further aggravating this impact. Additionally, it seems plausible to assume a reduced compensatory potential of white matter fiber tracts for the later MCA lesions when compared with the earlier PLs [Staudt et al., 2006], which may also contribute to a more pronounced deficit. However, more refined analyses systematically testing different sensory qualities and employing fine‐tuned stimulation paradigms [Gelnar et al., 1999] are certainly necessary to shed further light on this.
Guzzetta et al. 2007 a reported a correlation between the number of activated voxels and sensory impairment in their patients, as demonstrated before in single cases [Pleger et al., 2005; Ward et al., 2006]. However, exploratory analyses relating sensory impairment to the individual fMRI activation in our patients showed no significant results, in line with earlier observations where no consistent correlation was found between the level of activation and long‐term motor recovery [Loubinoux et al., 2007; Small et al., 2002]. This may be due to our rather unspecific stimulation only yielding a “global” somatosensory activation [Thickbroom et al., 2001], and neither of our distinct sensory scores may adequately reflect this. Moreover, caution is advised when assessing spatial extent in fMRI studies as smoothing may severely and unpredictably influence results [Reimold et al., 2006]; finally, such correlations do not take into account individual effects like subject motion etc. We therefore believe that fMRI [which is also feasible in children and adolescents; Wilke et al., 2003a] is well suited to study the topography of (re‐)organization, but other modalities [like advanced analyses of the MEG signal; Gerloff et al., 2006] and well‐designed clinical studies may be more appropriate if the quality of neuronal reorganization is at the center of a study.
TMS and MEG
Functional MRI allows assessing the spatial location of somatosensory activation but is not able to directly differentiate between primary and secondary cortical activation because of its low temporal resolution. Thus, as part of a multimodal assessment, we employed TMS and MEG as the methods of choice to independently and unequivocally confirm the hemispheric location of the primary motor (M1) and somatosensory cortex (S1), respectively [Currà et al., 2002; Darvas et al., 2004]. While TMS is hard to standardize and the MEGs spatial resolution is limited and restricted to the cerebral surface, both methods offer the advantage of high temporal resolution [Currà et al., 2002; Darvas et al., 2004; Simos et al., 2000]. Detecting monosynaptic neuronal connections by assessing the latency within which the signal is conveyed, TMS and MEG excellently complement fMRI. We believe that only the combined use of these methods allows assessing “the whole picture” in such complex subjects.
To identify M1, we used single‐pulse TMS. This technique is well‐tolerated and has been shown to be extremely useful in the study of the motor system [Currà et al., 2002]. It is an accepted tool for neurological diagnostics and research in children and adolescents [Quintana, 2005; Staudt et al., 2002], with minimal risk [Gilbert et al., 2004]. Unequivocal TMS results in the form of short‐latency motor‐evoked potentials were obtained from all subjects, categorizing them with regard to ipsi‐ or contralateral primary motor representation (see also Table I). Apart from using it to identify M1 (and thus, motor re‐organization), no further analyses were done on the TMS data.
In a second step, all subjects were examined using MEG. We used the N20m response which is the accepted indicator for the neuronal input into S1 [Kakigi, 1994]. MEG has been shown before to be an excellent tool to investigate neuronal plasticity [Simos et al., 2000], especially in the setting of a dissociated M1/S1 [Gerloff et al., 2006; Staudt et al., 2006]. Compared with somatosensory evoked potentials (SEP), it is much less susceptible to effects from skull tissue [Okada et al., 1999] which is especially relevant when investigating children and adolescents as nonbrain tissue changes substantially during this time [Giedd et al., 1996; Wilke et al., 2002]. Our analyses demonstrated that in all subjects and for both the paretic and the nonparetic hand, S1 was located in the contralateral hemisphere (see Table I); the significance of these findings will be discussed below. Similar to TMS, no further analyses were done on the MEG results as this was not the focus of this study. Such further analyses may be able to detect long‐latency responses beyond N20 as hypothesized earlier [Ragazzoni et al., 2002] and would allow investigating further the (primary and secondary) spatial pattern of sensory activation for both the lesional and the contralesional hemisphere.
fMRI‐Results
To further investigate the topography of somatosensory activations, we employed fMRI, first aiming to assess the activation on the individual level. As the localizing accuracy of functional MRI is dependent on the smoothing employed [Reimold et al., 2006], we used a spatially less‐biased measure of activation by computing a weighted center of mass from the individual analyses, allowing to identify foci of activation [Nunn et al., 2002; Ramsey et al., 1996, Tzourio et al., 1998].
These activation foci are more scattered for the paretic hands, for both groups (see Fig. 2). This demonstrates that, while similar brain regions are activated, the spatial variability of these activations is larger, causing a lesser overlap between individuals. In fact, a standard database yields primary somatosensory cortex as the nearest gray matter structure for each hand in both groups [Lancaster et al., 2000]; therefore, only looking at the average voxel location does not convey the whole picture. It is interesting to note that an increase in variability has been observed before after early brain lesions [Wong et al., 1982], using evoked potentials. The authors had suggested that neuronal damage leads to an erratic neuronal firing, consequently resulting in a higher variability; however, in the light of our results it would be interesting to relate this electrical to the here‐observed morphological inhomogeneity.
Overall, however, the activation pattern of the paretic hand strongly resembles the pattern from the nonparetic hand, illustrating an only limited potential for intrahemispheric reorganization of somatosensory functions at the cortical level. Naturally, for this to occur some aspects of the post‐central gyrus need to be spared from the cortical destruction stemming from the arterial insult in the MCA group, as neuronal reorganization cannot take place in the complete absence of neuronal substrate. That this was possible in our subjects actually enhances comparability between the subcortical (PL) and the cortico‐subcortical lesions (MCA) as the confounding influence of the cortical damage in the latter group is not decisive. The added spatial variability information, while not replacing a formal group‐level statistical analysis (see below), is important to take into account: a larger variability of activations may preclude group activation from reaching significance [Mumford and Nichols, 2006]. Such first‐level inference therefore still has its place in lesion studies [Rorden and Karnath, 2004], especially in inhomogeneous groups [Friston et al., 1999]. Incidentally, the tight clustering of activation foci for the nonparetic hands suggests that spatial normalization did indeed work well, demonstrating that our masking approach [Brett et al., 2001] succeeded in compensating the lesion effect. This is of considerable relevance as only adequate spatial normalization allows performing group analyses [Toga and Thompson, 2001; Wilke et al., 2002].
The second‐level group effects were consistent with the MEG findings and the first‐level analyses as significant contralateral activation could be shown for both groups in response to passive hand movement (see Fig. 3); the hemispheric location of the paretic hand's S1 is similar to the location of the nonparetic hand's S1. This confirms that the primary somatosensory cortex was not transhemispherically reorganized in either group. Only such random‐effects analyses allow to generalize findings from group imaging studies [Friston et al., 1999; Thirion et al., 2007], our results therefore are a significant addition to and extension of the recent case‐based results [Guzzetta et al., 2007a]. We could previously demonstrate that S1 remained contralateral despite a reorganized M1 in subjects with a PL [Staudt et al., 2006] but the situation was still unclear on the group level, in subjects with later lesions, and without evidence of motor reorganization. Likely owing to the larger variability of activation patterns as described earlier, the group activation “blob” of the paretic hand is smaller in both groups (although this difference should not be over interpreted, considering the sample sizes). The preserved location in both groups is very interesting when taking into account the differences between the lesion types: while being similar with regard to timing, they differ regarding motor reorganization, site of the insult, and affected structures [Back, 2006; Staudt et al., 2004; Uvebrant, 1988]. Overall, however, these features do not seem to exert a decisive influence on the global topographical location of the primary somatosensory cortex in our subjects. Specifically, motor reorganization does not seem to alter the location of S1 as the lesioned hemisphere in the CONTRAMCA group still supports both M1 and S1. Conversely, the mean layout of S1 in the hemisphere carrying “two M1's” is likewise unchanged, at least on the macroscopic level. Considering the slightly higher variability of S1 in the nonparetic hand in the IPSIPL group when compared with the non‐paretic hand in the CONTRAMCA group, it is tempting to speculate on a possible influence of the reorganized M1 on the layout of S1, as suggested before [Guzzetta et al., 2007a]. However, lacking more data from normal controls, this can currently not be investigated further.
As to the underlying neurobiological mechanisms, the initially bilateral motor, but not somatosensory projections, offer a plausible explanation for the obvious ability of M1 to reorganize [Eyre et al., 2001]. An inability to reorganize on the cortical level is also supported by the observation that the ascending somatosensory projections literally go to great lengths to reach their original neuronal target site [Staudt et al., 2006]. It should be noted that conflicting case reports of intra‐ [Gondo et al., 2000] or interhemispheric [Maegaki et al., 1995] somatosensory reorganization described patients with earlier‐occurring cortical malformations [Krägeloh‐Mann, 2004]. These results were also not reproduced in six other patients with cortical malformations [Guzzetta et al., 2007a]. Additionally allowing for the epileptogenic potential of such lesions [Sisodiya, 2004] and the effects of such activity on brain (re‐)organization [Morimoto et al., 2004; Voets et al., 2006], comparability of these cases with our present results is low. We therefore suggest that neither inter‐ nor relevant intrahemispheric reorganization occurs within the somatosensory system following early brain lesions, at the cortical level.
Considering the reorganized primary motor cortex, the necessity to use a passive hand movement task in such a setting cannot be stressed enough: an active hand movement in the IPSIPL group will lead to a bilateral activation: ipsilaterally, the reorganized M1 will activate, while the not‐reorganized S1 will activate contralaterally [Staudt et al., 2006]. Definitively disentangling such bilateral activation is therefore only possible when complementary methods are used, like TMS and MEG [Currà et al., 2002; Simos et al., 2000]. Alternatively, a passive task can be contrasted with an active task [Guzzetta et al., 2007b] but the reliability obtainable from such a contrast alone will always be lower than a direct detection of M1 or S1 by another method.
We finally aimed at assessing the overall integrity of the somatosensory network with regard to the relation between Rolandic and cerebellar regions. This was motivated by observations of an immediate influence on the contralateral cerebellum [Baron et al., 1980] in the setting of an acute cortical stroke. This “crossed cerebellar diaschisis” indicates a decreased cortical input; it has both immediate and long‐term components [Niimura et al., 1999; Pantano et al., 1986]. Its early presence was associated with a worse clinical outcome [Takasawa et al., 2002], while ipsilateral activation was linked to an improved motor outcome following adult stroke [Small et al., 2002], suggesting a compensatory potential for this brain region. Here, we therefore assessed the correlation between cortical and cerebellar activation for both the paretic and the nonparetic hand. Our analyses show that the predicted pattern [i.e., sensory input to one hand evokes contralateral activation in S1 and ipsilateral activation in the cerebellum; Gao et al., 1996] is nicely demonstrated for the nonparetic hand in both groups (open triangles in Fig. 4). For the paretic hand, the pattern is more inhomogeneous (closed squares in Fig. 4), in line with the larger variability of cortical activation described earlier. This finding hints towards an overall intact somatosensory cortico‐cerebellar circuitry in both groups. In each group, one subject does not “fit the pattern,” but this does not seem to have a clinical correlate: while subject No. 2 from the CONTRAMCA group is more impaired, subject No. 5 from the IPSIPL group shows almost no sensory and an only moderate motor impairment, in line with the rest of the group. These outliers are therefore difficult to interpret on their own. Methodologically, it should also be kept in mind that the calculations were done on unthresholded maps [Holland et al., 2001] which emphasizes sensitivity but also may be more vulnerable to artifacts [Wilke and Lidzba, 2007]. Overall, the preserved patterns suggest that activation in the ipsilesional cerebellum does not contribute to recovery in the chronic setting, as shown before for the motor domain [Small et al., 2002].
Possible Limitations of This Study
The most obvious limitation of this study is the rather small group size. Although many confounding factors were controlled for, heterogeneity between patients, as evident from Figure 1, is unavoidable: brain lesions in humans may be similar but they are never standardized. However, the timing of injury, the clinical correlates and several confounding factors were carefully defined and controlled for, resulting in a group that was quite homogeneous with regard to the parameters of interest for this study [Krägeloh‐Mann, 2004; Lidzba et al., 2006; Uvebrant, 1988]. Thorough characterization was also ensured by using an extensive and multimodal methodological repertoire, and the converging evidence across methods further substantiates their credibility. Whether larger groups, potentially enabling parametrical analysis approaches [Friston et al., 1999], would have been able to shed more light on the question at hand, though, is difficult to tell. First, an inherently inhomogeneous sample with an “unusual” pattern of activation constitutes the classical case where first‐level inference may be informative and is thus justified [Friston et al., 1999]. Secondly, nonparametrical statistics on the second level have only recently been suggested to be superior even for larger group sizes [Thirion et al., 2007], so we think that our methodological approach is adequate. A larger group also would have allowed to investigate in more detail possible structure‐function relationships, e.g., lesion size and exact location vs. functional impairment, as done before [Staudt et al., 2000, 2003], or the assessment of further cerebellar subdivisions [Niimura et al., 1999]. However, this was not the focus of this study; therefore, no attempt was made to investigate such effects.
SUMMARY AND CONCLUSIONS
Clinically, we found a more pronounced sensory deficit in the MCA group showing a co‐localized M1/S1 within the lesioned hemisphere than in the PL group with a hemispheric dissociation of M1/S1. On the one hand, this might argue against a functional disadvantage of M1/S1 dissociation; on the other hand, due to the here‐observed limited potential for intrahemispheric reorganization of somatosensory functions, the additional cortical damage in the MCA group might not be compensable. Furthermore, detrimental effects on the developing fiber tracts may also be more effectively counterbalanced in the earlier lesion type (PL). Thus, more refined studies are necessary to further describe this interaction.
Using TMS, MEG, and fMRI, we could demonstrate that the primary somatosensory region is not transhemispherically reorganized following two types of early brain lesions occurring in the last trimester of pregnancy or peri/neonatally. Moreover, only minimal intrahemispheric cortical reorganization occurs, detectable as an increased spatial variability of activations. Consequently, the lesioned hemisphere retains control over somatosensory functions in all of our subjects. This is true despite different motor reorganization patterns, different lesion location and affected structures. Motor reorganization (as a function of lesion size and topography) is likely possible due to the initially bilateral motor projections from M1 whereas such an ipsilateral “way out” is apparently not available for the primary somatosensory cortex. The overall circuitry of the somatosensory system, connecting the contralateral S1 with the ipsilateral cerebellum, remained intact. Future studies should assess different somatosensory qualities in order to gain further insights into the nature of somatosensory reorganization following early brain lesions.
Acknowledgements
We would like to thank all participants for their patience and their willingness to contribute to this study. We would also like to thank Jeroen Vermeulen, MD, Vrije Universitet Amsterdam, for helpful discussions.
REFERENCES
- Ashburner J,Friston KJ ( 2005): Unified segmentation. Neuroimage 26: 839–851. [DOI] [PubMed] [Google Scholar]
- Back SA ( 2006): Perinatal white matter injury: the changing spectrum of pathology and emerging insights into pathogenetic mechanisms. Ment Retard Dev Disabil Res Rev 12: 129–140. [DOI] [PubMed] [Google Scholar]
- Baron JC,Bousser MG,Comar D,Castaigne P ( 1980): Crossed cerebellar diaschisis in human supratentorial infarction. Trans Am Neurol Assoc 105: 459–461. [PubMed] [Google Scholar]
- Brett M,Leff AP,Rorden C,Ashburner J ( 2001): Spatial normalization of brain images with focal lesions using cost function masking. Neuroimage 14: 486–500. [DOI] [PubMed] [Google Scholar]
- Carr LJ,Harrison LM,Evans AL,Stephens JA ( 1993): Patterns of central motor reorganization in hemiplegic cerebral palsy. Brain 116: 1223–1247. [DOI] [PubMed] [Google Scholar]
- Claeys V,Deonna T,Chrzanowski R ( 1983): Congenital hemiparesis: The spectrum of lesions. A clinical and computerized tomographic study of 37 cases. Helv Paediatr Acta 38: 439–455. [PubMed] [Google Scholar]
- Cooper J,Majnemer A,Rosenblatt B,Birnbaum R ( 1995): The determination of sensory deficits in children with hemiplegic cerebral palsy. J Child Neurol 10: 300–309. [DOI] [PubMed] [Google Scholar]
- Cohen LG,Meer J,Tarkka I,Bierner S,Leiderman DB,Dubinsky RM,Sanes JN,Jabbari B,Branscum B,Hallett M ( 1991): Congenital mirror movements. Abnormal organization of motor pathways in two patients. Brain 114: 381–403. [DOI] [PubMed] [Google Scholar]
- Currà A,Modugno N,Inghilleri M,Manfredi M,Hallett M,Berardelli A ( 2002): Transcranial magnetic stimulation techniques in clinical investigation. Neurology 59: 1851–1859. [DOI] [PubMed] [Google Scholar]
- Darvas F,Pantazis D,Kucukaltun‐Yildirim E,Leahy RM ( 2004): Mapping human brain function with MEG and EEG: Methods and validation. Neuroimage 23: 289–299. [DOI] [PubMed] [Google Scholar]
- Eyre JA,Taylor JP,Villagra F,Smith M,Miller S ( 2001): Evidence of activity‐dependent withdrawal of corticospinal projections during human development. Neurology 57: 1543–1554. [DOI] [PubMed] [Google Scholar]
- Freeman C,Okun MS ( 2002): Origins of the sensory examination in neurology. Semin Neurol 22: 399–408. [DOI] [PubMed] [Google Scholar]
- Friston KJ,Holmes AP,Worsley KJ,Poline JB,Frith CD,Frackowiak RSJ ( 1995): Statistical parametric maps in functional imaging: A general linear approach. Hum Brain Mapp 2: 189–210. [Google Scholar]
- Friston KJ,Holmes AP,Worsley KJ ( 1999): How many subjects constitute a study? Neuroimage 10: 1–5. [DOI] [PubMed] [Google Scholar]
- Gao LM,Parson JM,Bower J,Xiong JL,Fox PT ( 1996): Cerebellum implicated in sensory acquisition and discrimination rather than motor control. Science 272: 545–547. [DOI] [PubMed] [Google Scholar]
- Gelnar PA,Krauss BR,Sheehe PR,Szeverenyi NM,Apkarian AV ( 1999): A comparative fMRI study of cortical representations for thermal painful, vibrotactile, and motor performance tasks. Neuroimage 10: 460–482. [DOI] [PubMed] [Google Scholar]
- Genovese RC,Lazar AL,Nichols T ( 2002): Thresholding of statistical maps in functional neuroimaging using the false discovery rate. Neuroimage 15: 870–878. [DOI] [PubMed] [Google Scholar]
- Gerloff C,Braun C,Staudt M,Hegner YL,Dichgans J,Krägeloh‐Mann I ( 2006): Coherent corticomuscular oscillations originate from primary motor cortex: Evidence from patients with early brain lesions. Hum Brain Mapp 27: 789–798. [DOI] [PMC free article] [PubMed] [Google Scholar]
- Giedd JN,Snell JW,Lange N,Rajapakse JC,Casey BJ,Kozuch PL,Vaituzis AC,Vauss YC,Hamburger SD,Kaysen D,Rapoport JL ( 1996): Quantitative magnetic resonance imaging of human brain development: ages 4–18. Cereb Cortex 6: 551–560. [DOI] [PubMed] [Google Scholar]
- Gilbert DL,Garvey MA,Bansal AS,Lipps T,Zhang J,Wassermann EM ( 2004): Should transcranial magnetic stimulation research in children be considered minimal risk? Clin Neurophysiol 115: 1730–1739. [DOI] [PubMed] [Google Scholar]
- Gondo K,Kira H,Tokunaga Y,Harashima C,Tobimatsu S,Yamamoto T,Hara T ( 2000): Reorganization of the primary somatosensory area in epilepsy associated with focal cortical dysplasia. Dev Med Child Neurol 42: 839–842. [DOI] [PubMed] [Google Scholar]
- Guzzetta A,Bonanni P,Biagi L,Tosetti M,Montanaro D,Guerrini R,Cioni G ( 2007a): Reorganisation of the somatosensory system after early brain damage. Clin Neurophysiol 118: 1110–1121. [DOI] [PubMed] [Google Scholar]
- Guzzetta A,Staudt M,Petacchi E,Ehlers J,Erb M,Wilke M,Krägeloh‐Mann I,Cioni G ( 2007b): Brain representation of active and passive hand movements in children. Pediatr Res 61: 485–490. [DOI] [PubMed] [Google Scholar]
- Holland SK,Plante E,Weber Byars A,Strawsburg RH,Schmithorst VJ,Ball WS Jr ( 2001): Normal fMRI brain activation patterns in children performing a verb generation task. Neuroimage 14: 837–843. [DOI] [PubMed] [Google Scholar]
- Jang SH,Byun WM,Chang Y,Han BS,Ahn SH ( 2001): Combined functional magnetic resonance imaging and transcranial magnetic stimulation evidence of ipsilateral motor pathway with congenital brain disorder: a case report. Arch Phys Med Rehabil 82: 1733–1736. [DOI] [PubMed] [Google Scholar]
- Kaas JH,Nelson RJ,Sur M,Lin CS,Merzenich MM ( 1979): Multiple representations of the body within the primary somatosensory cortex of primates. Science 204: 521–523. [DOI] [PubMed] [Google Scholar]
- Kakigi R ( 1994): Somatosensory evoked magnetic fields following median nerve stimulation. Neurosci Res 20: 165–174. [DOI] [PubMed] [Google Scholar]
- Kennard MA ( 1936): Age and other factors in motor recovery from precentral lesions in monkeys. Am J Physiol 115: 138–146. [Google Scholar]
- Kostovic I,Judas M ( 2002): Correlation between the sequential ingrowth of afferents and transient patterns of cortical lamination in preterm infants. Anat Rec 267: 1–6. [DOI] [PubMed] [Google Scholar]
- Krägeloh‐Mann I ( 2004): Imaging of early brain injury and cortical plasticity. Exp Neurol 190: 84–90. [DOI] [PubMed] [Google Scholar]
- Lancaster JL,Woldorff MG,Parsons LM,Liotti M,Freitas CS,Rainey L,Kochunov PV,Nickerson D,Mikiten SA,Fox PT ( 2000): Automated Talairach atlas labels for functional brain mapping. Hum Brain Mapp 10: 120–131. [DOI] [PMC free article] [PubMed] [Google Scholar]
- Lidzba K,Staudt M,Wilke M,Grodd W,Krägeloh‐Mann I ( 2006): Lesion‐induced right‐hemispheric language and organization of nonverbal functions. Neuroreport 17: 929–933. [DOI] [PubMed] [Google Scholar]
- Loubinoux I,Dechaumont‐Palacin S,Castel‐Lacanal E,De Boissezon X,Marque P,Pariente J,Albucher JF,Berry I,Chollet F ( 2007): Prognostic value of fMRI in recovery of hand function in subcortical stroke patients. Cereb Cortex 17: 2980–2987. [DOI] [PubMed] [Google Scholar]
- Maegaki Y,Yamamoto T,Takeshita K ( 1995): Plasticity of central motor and sensory pathways in a case of unilateral extensive cortical dysplasia: Investigation of magnetic resonance imaging, transcranial magnetic stimulation, and short‐latency somatosensory evoked potentials. Neurology 45: 2255–2261. [DOI] [PubMed] [Google Scholar]
- Morimoto K,Fahnestock M,Racine RJ ( 2004): Kindling and status epilepticus models of epilepsy: Rewiring the brain. Prog Neurobiol 73: 1–60. [DOI] [PubMed] [Google Scholar]
- Mumford JA,Nichols T ( 2006): Modeling and inference of multisubject fMRI data. IEEE Eng Med Biol Mag 25: 42–51. [DOI] [PubMed] [Google Scholar]
- Nichols TE,Holmes AP ( 2001): Nonparametric Analysis of PET functional neuroimaging experiments: A primer. Hum Brain Mapp 15: 1–25. [DOI] [PMC free article] [PubMed] [Google Scholar]
- Niimura K,Chugani DC,Muzik O,Chugani HT ( 1999): Cerebellar reorganization following cortical injury in humans: Effects of lesion size and age. Neurology 52: 792–797. [DOI] [PubMed] [Google Scholar]
- Nunn JA,Gregory LJ,Brammer M,Williams SC,Parslow DM,Morgan MJ,Morris RG,Bullmore ET,Baron‐Cohen S,Gray JA ( 2002): Functional magnetic resonance imaging of synesthesia: activation of V4/V8 by spoken words. Nat Neurosci 5: 371–375. [DOI] [PubMed] [Google Scholar]
- Okada Y,Lahteenmaki A,Xu C ( 1999): Comparison of MEG and EEG on the basis of somatic evoked responses elicited by stimulation of the snout in the juvenile swine. Clin Neurophysiol 110: 214–229. [DOI] [PubMed] [Google Scholar]
- Pantano P,Baron JC,Samson Y,Bousser MG,Derouesne C,Comar D ( 1986): Crossed cerebellar diaschisis. Further studies. Brain 109: 677–694. [DOI] [PubMed] [Google Scholar]
- Pestronk A,Florence J,Levine T,Al‐Lozi MT,Lopate G,Miller T,Ramneantu I,Waheed W,Stambuk M ( 2004): Sensory exam with a quantitative tuning fork: rapid, sensitive and predictive of SNAP amplitude. Neurology 62: 461–464. [DOI] [PubMed] [Google Scholar]
- Pleger B,Tegenthoff M,Ragert P,Förster AF,Dinse HR,Schwenkreis P,Nicolas V,Maier C ( 2005): Sensorimotor retuning in complex regional pain syndrome parallels pain reduction. Ann Neurol 57: 425–429. [DOI] [PubMed] [Google Scholar]
- Quintana H ( 2005): Transcranial magnetic stimulation in persons younger than the age of 18. J ECT 21: 88–95. [DOI] [PubMed] [Google Scholar]
- Ragazzoni A,Cincotta M,Borgheresi A,Zaccara G,Ziemann U ( 2002): Congenital hemiparesis: Different functional reorganization of somatosensory and motor pathways. Clin Neurophysiol 113: 1273–1278. [DOI] [PubMed] [Google Scholar]
- Ramsey NF,Kirkby BS,Van Gelderen P,Berman KF,Duyn JH,Frank JA,Mattay VS,Van Horn JD,Esposito G,Moonen CT,Weinberger DR ( 1996): Functional mapping of human sensorimotor cortex with 3D BOLD fMRI correlates highly with HO PET rCBF. J Cereb Blood Flow Metab 16: 755–764. [DOI] [PubMed] [Google Scholar]
- Reimold M,Slifstein M,Heinz A,Müller‐Schauenburg W,Bares R ( 2006): Effect of spatial smoothing on t‐maps: Arguments for going back from t‐maps to masked contrast images. J Cereb Blood Flow Metab 26: 751–759. [DOI] [PubMed] [Google Scholar]
- Rorden C,Karnath HO ( 2004): Using human brain lesions to infer function: A relic from a past era in the fMRI age? Nat Rev Neurosci 5: 813–819. [DOI] [PubMed] [Google Scholar]
- Rosenbaum P,Paneth N,Leviton A,Goldstein M,Bax M,Damiano D,Dan B,Jacobsson B ( 2007): A report: the definition and classification of cerebral palsy. April 2006. Dev Med Child Neurol Suppl 109: 8–14. [PubMed] [Google Scholar]
- Simos PG,Papanicolaou AC,Breier JI,Fletcher JM,Wheless JW,Maggio WW,Gormley W,Constantinou JE,Kramer L ( 2000): Insights into brain function and neural plasticity using magnetic source imaging. J Clin Neurophysiol 17: 143–162. [DOI] [PubMed] [Google Scholar]
- Sisodiya SM ( 2004): Malformations of cortical development: Burdens and insights from important causes of human epilepsy. Lancet Neurol 3: 29–38. [DOI] [PubMed] [Google Scholar]
- Small SL,Hlustik P,Noll DC,Genovese C,Solodkin A ( 2002): Cerebellar hemispheric activation ipsilateral to the paretic hand correlates with functional recovery after stroke. Brain 125: 1544–1557. [DOI] [PubMed] [Google Scholar]
- Staudt M,Niemann G,Grodd W,Krägeloh‐Mann I ( 2000): The pyramidal tract in congenital hemiparesis: Relationship between morphology and function in periventricular lesions. Neuropediatrics 31: 257–264. [DOI] [PubMed] [Google Scholar]
- Staudt M,Grodd W,Gerloff C,Erb M,Stitz J,Krägeloh‐Mann I ( 2002): Two types of ipsilateral reorganization in congenital hemiparesis: A TMS and fMRI study. Brain 125: 2222–2237. [DOI] [PubMed] [Google Scholar]
- Staudt M,Pavlova M,Bohm S,Grodd W,Krägeloh‐Mann I ( 2003): Pyramidal tract damage correlates with motor dysfunction in bilateral periventricular leukomalacia (PVL). Neuropediatrics 34: 182–188. [DOI] [PubMed] [Google Scholar]
- Staudt M,Gerloff C,Grodd W,Holthausen H,Niemann G,Krägeloh‐Mann I ( 2004): Reorganization in congenital hemiparesis acquired at different gestational ages. Ann Neurol 56: 854–863. [DOI] [PubMed] [Google Scholar]
- Staudt M,Braun C,Gerloff C,Erb M,Grodd W,Krägeloh‐Mann I ( 2006): Developing somato‐sensory projections bypass periventricular brain lesions. Neurology 67: 522–525. [DOI] [PubMed] [Google Scholar]
- Takasawa M,Watanabe M,Yamamoto S,Hoshi T,Sasaki T,Hashikawa K,Matsumoto M,Kinoshita N ( 2002): Prognostic value of subacute crossed cerebellar diaschisis: Single‐photon emission CT study in patients with middle cerebral artery territory infarct. AJNR Am J Neuroradiol 23: 189–193. [PMC free article] [PubMed] [Google Scholar]
- Tecchio F,Zappasodi F,Melgari JM,Porcaro C,Cassetta E,Rossini PM ( 2006): Sensory‐motor interaction in primary hand cortical areas: A magnetoencephalography assessment. Neuroscience 141: 533–542. [DOI] [PubMed] [Google Scholar]
- Teuber HL,Reudel RG ( 1962): Behavior after cerebral lesions in children and adults. Dev Med Child Neurol 4: 3–20. [DOI] [PubMed] [Google Scholar]
- Thickbroom GW,Byrnes ML,Archer SA,Nagarajan L,Mastaglia FL ( 2001): Differences in sensory and motor cortical organization following brain injury early in life. Ann Neurol 49: 320–327. [PubMed] [Google Scholar]
- Thirion B,Pinel P,Meriaux S,Roche A,Dehaene S,Poline JB ( 2007): Analysis of a large fMRI cohort: Statistical and methodological issues for group analyses. Neuroimage 35: 105–120. [DOI] [PubMed] [Google Scholar]
- Toga AW,Thompson PM ( 2001): The role of image registration in brain mapping. Image Vis Comput 19: 3–24. [DOI] [PMC free article] [PubMed] [Google Scholar]
- Tower SS ( 1940): Pyramidal lesion in the monkey. Brain 63: 36– 90. [Google Scholar]
- Tzourio N,Crivello F,Mellet E,Nkanga‐Ngila B,Mazoyer B ( 1998): Functional anatomy of dominance for speech comprehension in left handers vs right handers. Neuroimage 8: 1–16. [DOI] [PubMed] [Google Scholar]
- Uvebrant P ( 1988): Hemiplegic cerebral palsy. Aetiology and outcome. Acta Paediatr Scand 345: 1–100. [DOI] [PubMed] [Google Scholar]
- Voets NL,Adcock JE,Flitney DE,Behrens TE,Hart Y,Stacey R,Carpenter K,Matthews PM ( 2006): Distinct right frontal lobe activation in language processing following left hemisphere injury. Brain 129: 754–766. [DOI] [PubMed] [Google Scholar]
- Ward NS,Brown MM,Thompson AJ,Frackowiak RS ( 2006): Longitudinal changes in cerebral response to proprioceptive input in individual patients after stroke: An FMRI study. Neurorehabil Neural Repair 20: 398–405. [DOI] [PMC free article] [PubMed] [Google Scholar]
- Wilke M,Lidzba K ( 2007): LI‐tool: A new toolbox to assess lateralization in functional MR‐data. J Neurosci Methods 163: 128–136. [DOI] [PubMed] [Google Scholar]
- Wilke M,Schmithorst VJ,Holland SK ( 2002): Assessment of spatial normalization of whole‐brain magnetic resonance images in children. Hum Brain Mapp 17: 48–60. [DOI] [PMC free article] [PubMed] [Google Scholar]
- Wilke M,Holland SK,Myseros JS,Schmithorst VJ,Ball WS Jr ( 2003a): Functional magnetic resonance imaging in pediatrics. Neuropediatrics 34: 225–233. [DOI] [PMC free article] [PubMed] [Google Scholar]
- Wilke M,Sohn JH,Byars AW,Holland SK ( 2003b): Bright spots: Correlations of gray matter volume with IQ in a normal pediatric population. Neuroimage 20: 202–215. [DOI] [PubMed] [Google Scholar]
- Williams PS,Basso DM,Case‐Smith J,Nichols‐Larsen DS ( 2006): Development of the hand active sensation test: Reliability and validity. Arch Phys Med Rehabil 87: 1471–1477. [DOI] [PubMed] [Google Scholar]
- Wong PK,Lombroso CT,Maysumiya Y ( 1982): Somatosensory evoked potentials: Variability analysis in unilateral hemispheric disease. Electroenceph Clin Neurophysiol 54: 266–274. [DOI] [PubMed] [Google Scholar]