

Abstract
Although there is ample evidence that motor imagery activates similar cerebral regions to those solicited during actual movements, it is still unknown whether visual (VI) and kinesthetic imagery (KI) recruit comparable or distinct neural networks. The present study was thus designed to identify, through functional magnetic resonance imaging at 3.0 Tesla in 13 skilled imagers, the cerebral structures implicated in VI and KI. Participants were scanned in a perceptual control condition and while physically executing or focusing during motor imagery on either the visual or kinesthetic components of an explicitly known sequence of finger movements. Subjects' imagery abilities were assessed using well‐established psychological, chronometric, and new physiological measures from the autonomic nervous system. Compared with the perceptual condition, physical executing, VI, and KI resulted in overlapping (albeit non‐identical) brain activations, including motor‐related regions and the inferior and superior parietal lobules. By contrast, a divergent pattern of increased activity was observed when VI and KI were compared directly: VI activated predominantly the occipital regions and the superior parietal lobules, whereas KI yielded more activity in motor‐associated structures and the inferior parietal lobule. These results suggest that VI and KI are mediated through separate neural systems, which contribute differently during processes of motor learning and neurological rehabilitation. Hum Brain Mapp, 2009. © 2008 Wiley‐Liss, Inc.
Keywords: fMRI, kinesthetic imagery, motor performance, visual imagery, motor cognition
INTRODUCTION
Motor imagery is defined as the mental simulation of a specific action without any corresponding motor output, hence requiring a representation of the body as the generator of acting forces [Jeannerod, 1994]. To date, a large body of research has been carried out to investigate the neurophysiological correlates of MI and to clarify the relationships between MI and both motor preparation and execution using various complementary methods [for review, see Guillot and Collet, 2005a]. Findings from these experiments have provided evidence that the execution of a movement and MI show several parallel characteristics. First, the time course of mentally simulated actions has been found to be highly correlated with the time taken to execute the same movement [e.g., Decety et al., 1989]. This temporal equivalence, however, is not systematic as several factors (e.g., task duration and difficulty, instructions given to subjects, or the way in which attention is focused on a specific aspect of the mental image) may lead to an over‐ or underestimation of the imagined movement duration [Guillot and Collet, 2005b]. Second, peripheral activity of the autonomic nervous system (ANS) has also been found to show similar responses prior and during movement during both MI and the motor execution of actions. For example, heart rate and pulmonary frequencies are known to covary with the degree of imagined effort [Decety et al., 1991, 1993; Fusi et al., 2005]. Furthermore, increases in ventilation and systolic blood pressure have also been reported during MI of dumbbells lifting [Wang and Morgan, 1992; Wuyam et al., 1995], whereas similar electrodermal and thermovascular responses have been elicited during MI and motor performance [Guillot et al., 2004, 2005]. Finally, the advent of brain mapping techniques like positon emission tomography and functional magnetic resonance imaging (fMRI) have shown that goal‐directed actions, whether executed or imagined recruit similar (albeit non identical) neural substrates [Decety et al., 1994; Guillot et al., 2008; Lotze et al., 1999; Mellet et al., 1998]. Although the physical execution of hand movements inevitably activates the Rolandic region, early positon emission tomography studies looking at the functional anatomy of MI have reported an increase of activity in motor‐related areas like premotor and supplementary motor area (SMA), but not in the primary motor cortex per se [Decety et al., 1990, 1994; Ingvar and Philipson, 1977; Roland et al., 1980]. For example, some authors have reported activations in different sites within the posterior part of the SMA [Stephan et al., 1995], whereas others have provided evidence of an activation in the pre‐SMA region [Deiber et al., 1998; Gerardin et al., 2000; Lafleur et al., 2002], hence, demonstrating that medial cortical structures also play a crucial role in MI [Lotze and Halsband, 2006]. Some fMRI studies have shown that not only secondary motor areas are recruited during MI, but that the primary motor cortex can also be part of the network involved in imagined actions [Ehrsson et al., 2003; Kuhtz‐Bushbeck et al., 2003; Porro et al., 1996; Solodkin et al., 2004]. Indeed, MI has been shown to activate the anterior part of the primary motor area [Lotze and Halsband, 2006] during MI of moving different body parts (foot, hand, and tongue), thus suggesting that the primary motor cortex may also be involved during MI. Yet the role of the primary motor cortex during MI remains controversial as some authors failed to find any peak of activation [Binkofski et al., 2000; Hanakawa et al., 2003], whereas others reported fleeting involvement [Dechent et al., 2004]. Sharma et al. [2006] have suggested that such discrepancies in results may be due, at least partially, to methodological differences and difficulties in monitoring compliance. In a second article, Sharma et al. [2008] have shown that the cluster distribution in the anterior part of the primary motor cortex was significantly reduced during MI as compared with the physical execution, whereas that of the posterior part was similar. Accordingly, they proposed that the role of this area and its subdivisions are nonexecutive and may be related to spatial encoding.
Apart from motor‐related areas, other regions like superior parietal lobule have been found to be activated during mental simulation of actions [Decety et al., 1994; Stephan et al., 1995; Wolbers et al., 2003]. Similarly, Nair et al. [2003] have shown that the precuneus is engaged during bimanual action sequences that rely on remembering and executing the correct ordering of tasks components as well as on processing the sensory consequences of action, whereas others [Binkofski et al., 2000; Schubert et al., 1998] have reported that cortical structures around the intraparietal sulcus are also recruited during MI of self‐paced finger movements. Such findings are consistent with studies in both healthy subjects and patients with parietal lesions, which have confirmed the crucial role of the superior and inferior parietal cortices in the generation of mental images [Sirigu et al., 1996; Suchan et al., 2002].
Finally, cerebellar and basal ganglia activations have consistently been reported during MI [Decety et al., 1994; Guillot et al., 2008; Lafleur et al., 2002; Naito et al., 2002; Parsons et al., 1998], although activations in the cerebellum were more posterior and inferior during this condition than during the actual movements [Lotze and Halsband, 2006; Lotze et al., 1999]. Studies on basal ganglia dysfunctions have also emphasized the role of these subcortical structures [especially the putamen; Li, 2000] in the neural network mediating MI [Dominey et al., 1995].
Taken together, the results reported earlier provide evidence that MI and motor performance share similar behavioral, physiological, and anatomical characteristics. It is now well‐established, however, that MI may be subdivided into two different modalities: visual imagery (VI) and kinesthetic imagery (KI). On one hand, VI requires self‐visualization of a movement from a first‐ (internal VI) or third‐person (external VI) perspective. The first‐person perspective corresponds to the representation of a movement as if the individual takes part to the action himself, hence suggesting that he/she would visualize the movement like having a camera on his/her head. By contrast, the third‐person perspective corresponds to the representation of the movement as if the subject was a spectator and that somebody (himself or another person) performed the action. On the other hand, KI requires one to “feel the movement” and to perceive muscle contractions and stretching mentally. Despite accumulated evidence reported earlier that MI and motor performance share common neural substrate, little is known, however, with respect to the possible specialization in neural systems during these two different forms of MI. In a first study, looking at this issue during actual and imagined finger movements, Binkofski et al. [2000] have shown that the anterior part of the intraparietal sulcus was more active during KI, whereas the posterior part was more involved during VI. Furthermore, when bilateral activations were reported during KI in the opercular portion of the ventral premotor cortex (BA 44), a lack of activation in the parietal areas was observed during KI of finger movements. Solodkin et al. [2004] have also investigated the effective connectivity in networks associated with physical execution, VI, and KI of hand movements. Even though VI and KI were found to share similar neural substrates including the connection from the superior parietal lobule to the SMA, the neural networks underlying these two MI conditions were not identical. Especially, the main difference was found in the inputs from the superior parietal lobule and the SMA to the primary motor cortex, which were opposite to those observed during motor performance.
The results of the latter two studies [Binkofski et al., 2000; Solodkin et al., 2004] suggest that VI and KI may recruit quite different neural substrates. However, some issues regarding the methodology used in these studies hinder the conclusions that one can reach. First, the authors did not indicate whether they controlled the quality of MI and the compliance of the subjects with MI instructions. Second, in the study by Solodkin et al. [2004], VI and KI were tested in two independent groups, thus allowing a possible bias with regard to the interpretation of the different neural networks mediating MI. Final, and most importantly, individual MI abilities were not systematically taken into consideration, and were partially measured qualitatively, i.e., subjectively using mental rotation tests or post‐test questionnaires, but not quantitatively. The present fMRI study was thus devised to examine whether the same group of healthy subjects with very good to excellent MI abilities (assessed using new quantitative physiological measures) does recruit comparable or distinct brain activations during VI and KI of hand movements. Although similar cerebral structures were expected to be activated during the physical performance and MI, VI, and KI were each hypothesized to involve different cortical areas. Because, compared with VI, KI shares physiological characteristics that are closer to movement execution per se [Solodkin et al., 2004], including the electromyographic activity [Guillot et al., 2007], the excitability of the cortico‐spinal system [Hashimoto and Rothwell, 1999], and the autonomic changes associated [Decety et al., 1991], it was expected that the motor systems and the related parietal regions would be more involved during KI of complex hand movements. By contrast, a stronger increase in signal intensity and/or additional structures receiving visual afferences would be seen during VI.
MATERIALS AND METHODS
Distinguishing the neural networks mediating VI and KI required selecting subjects who showed very good to excellent MI abilities. A series of tests were thus administered before the fMRI study to select subjects who were able to reach this high level of performance in MI. Psychological, behavioral, and neurophysiological tests were combined to evaluate MI capacity within a large sample of subjects, as suggested by Guillot and Collet [2005a] and Lotze and Halsband [2006]. The fMRI experiment was then performed a few days later using a subset of these subjects.
Subjects' Preselection
Participants
Fifty healthy, right‐handed, volunteers (24 men: mean age 26.4 years, SD = 3.4, age range 21–34 and 26 women: mean age 25.6 years, SD = 3.9, age range 20–35) without neurological complications participated in a preselection session. This study was approved by the Local Ethics Committee from the University of Montreal Geriatric Institute. All participants gave their informed consent and were paid for their participation.
Behavioral tasks
Four tests were combined to evaluate MI ability. First, each participant completed the revised version of the Movement Imagery Questionnaire [MIQ‐R, Hall and Martin, 1997]. The MIQ‐R is made up of eight items to evaluate both intersubject differences in VI (four items) and KI (four items), as well as within‐subject differences (VI vs. KI). Participants were first requested to read descriptions of movements to be performed physically and then to imagine themselves performing the same movement. A score based on the difficulty associated with representing each movement mentally was assigned using a seven point rating scale. Second, movement durations were recorded whereas the participants physically performed and imagined three motor actions that required the ability to use both VI and KI: (i) a sequence of 16 rhythmic steps performed within a square drawn on the floor, (ii) a series of five consecutive complete flexion‐extension (squats) of the lower limbs, and (iii) the maintenance of a position with the knee at 90° of flexion against a wall during 12 s. Subjects had to perform the former action using VI and the latter movement using KI. By contrast, the series of flexion‐extension actions were completed using a combination of both MI types. The ability to preserve temporal characteristics between the actual movement and during imagery was measured [Guillot and Collet, 2005b; Malouin et al., 2007]. For each motor sequence, subjects were required to start and stop the timer on mental initiation of the first body movement and at the end of the sequence, respectively. Third, ANS activity (see later) was simultaneously and continuously recorded during each trial, hence allowing a more quantitative measure of the subjects' mental capacities and representations [Guillot et al., 2004; Roure et al., 1999]. Four trials were performed at random under each condition (physical and MI performance), each being separated from the next trial by a rest period (lasting at least 20 s) for the physiological measure to recover its baseline level. In both conditions, subjects were acoustically isolated. They were asked to close their eyes during MI and to open them to acknowledge the next assignment. Finally, to verify that they performed MI as they were instructed to, participants were required to describe the nature of the images they attempted to form after the MI session and to score their effort using a four point rating scale (1 = very difficult to imagine/feel and 4 = very easy to imagine/feel).
Autonomic nervous system recordings
Higher brain functions may be investigated through autonomic nervous system (ANS) effectors activity at the peripheral level [Hugdahl, 1996], as central operations (e.g., planning and programming) are paralleled by ANS responses that represent nonconscious physiological mechanisms of mental processes [Collet et al., 1999]. Among ANS effectors, sweat glands are innervated by sympathetic endings only. An increase of the subjects' level of arousal (such as during MI) elicits sweat release and, consequently, a decrease in skin resistance (SR). Skin resistance was recorded using two 30 mm2 unpolarizable Ag/AgCl electrodes (Clark Electromedical Instruments, Ref. E243) placed on the second phalanx of the second and third digits of the nondominant hand and held by adhesive tape [Fowles et al., 1981]. A conductive paste (TECA ref: 822–201210) was used to improve skin/electrode contact. Resistance was recorded with the constant current method [Boucsein, 1993] using a 15 μA current (density = 0.5 μA/mm2). As response amplitude depends on the prestimulation value [Furedy and Scher, 1989], a more reliable index was taken without referring to that initial value (tonic level). The ohmic perturbation duration was measured at the beginning of the sudden drop elicited by MI and was ended when the slope, whereas recovering basal level showed no fluctuation and resembled that observed before stimulation [Vernet‐Maury et al., 1995]. Response latency referred to the time lapse from the onset of the stimulus to the initiation of the response. Based on frequency of response latencies to simple stimuli, it is common to use a 1–2 s or 1–3 s latency windows [Levinson and Edelberg, 1985]. Any response onset within 1 and 3 s following stimulus onset was thus considered as being elicited by that stimulus.
Motor imagery ability
The four well‐established imagery ability measures mentioned earlier were used to evaluate individual MI abilities.
Autonomic nervous system score
The number of SR responses was first calculated and represented on a 0–12 scale: 0 indicating no SR response on each MI trial and 12 indicating that each MI trial elicited a SR response. In addition, the subject's level of arousal was assessed through SR basal tonic evolution across the MI session. Deschaumes‐Molinaro et al. [1991] found that high imagers have similar physiological activation during both MI and motor performance, SR tonic level being one of the most reliable indicators of arousal variations [Collet et al., 1996]. To give equal importance to these two factors, the evolution of the arousal level was graded between −5 (subjects relaxed throughout MI), −2 (increased relaxation by steps), 0 (no adjustment, the activation level remaining stable during MI), +2 (increased activation by steps during MI), and +5 (increasing activation regularly). Thereby, the autonomic nervous system (ANS) score consisted of the sum of the two preceding measures (number of SR responses + arousal level score): the minimal score subjects could obtain being −5 and the maximal score being 12.
MIQ‐R score
This measure was calculated by adding the scores assigned by the subjects to each MI test‐item. The minimal score subjects could obtain was 8, and the maximal score was 56.
Autoestimation score
This score was the mean of all ratings given by subjects when evaluating the vividness of each MI trial on a 4‐point scale.
Mental chronometry score
This score was the mean of the absolute time differences between actual and imagined trials. This difference score was subtracted from the global imagery score as it was inversely proportional to the subjects' ability to preserve the temporal characteristics of each movement during MI, suggesting therefore a difficulty to imagine the action.
Following Roure et al.'s [1999] recommendations, a global imagery score was finally calculated for each participant, using this simple formula: (ANS score + MIQ‐R score + Autoestimation score) − (Mental chronometry score).
Participants in the fRMI Study
Among the 50 volunteers who took part in the preselection study, only 13 (six men: mean age 25.5 years, SD = 2.4 and seven women: mean age 23.9 years, SD = 2.8) were rated as good to excellent imagers (as defined by at least one SD above the mean global imagery score) and were therefore selected for the fMRI experiment. All were also found to outperform the other subjects for each rating of the global imagery score. None of the subjects were either a musician or a professional typist in order to eliminate subjects with pre‐existing skills requiring highly coordinated finger dexterities.
Finger sequence task
Participants were first asked to learn a sequence of eight moves using fingers 2–5 of the left hand, until they were able to perform them explicitly from memory within a 6 s‐period. Within the finger sequence, the order of finger movements was pseudorandomly generated such that each finger was used twice. They physically performed the sequence on a few occasions to get both sensorimotor feedback and visual guidance to enhance the memorization process. The subjects' performance was assessed inside and outside the scanner by using a four keys keyboard (Electrical Geodesics, Eugene, OR) that was MR‐compatible. The keyboard allowed recording of the subjects' response accuracy and timing. Participants were required to keep their fingers on the keys to minimize amplitude variation and the amount of force required to press the keys. They were instructed to tap the sequence at a comfortable and self‐paced speed, while making as few errors as possible. Speed tests, however, were also scheduled to check that the participants were able to correctly perform and imagine the movement within a period not exceeding 6 s.
Following introduction to the sequence, participants were scanned during a block‐design paradigm including six runs. The physical execution, VI, KI, and perceptual control conditions were systematically followed by a rest‐period, in order for the subjects to read the instructions. For each run, subjects thus alternated eight counterbalanced epochs of 30 s of experimental conditions and 10 s of rest (see Fig. 1).
Figure 1.
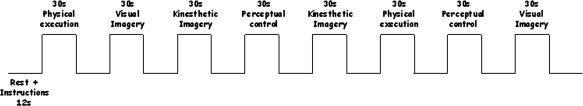
Schematic representation of the experimental block‐design. After reading the instructions, the participants were subjected to a 30 s‐period during which they either physically performed the movement, mentally rehearsed the sequence using visual or kinesthetic imagery, or remained motionless while closing their eyes. Similar “start” and “stop” sound signals were used in each condition.
Physical execution
The participants executed the finger sequence opposition task that was explicitly learned before the scanning session by using the four keys keyboard.
Visual imagery
The subjects were requested to visualize the finger sequence without any movement using the first‐person perspective. They were requested to close their eyes, and thus did not have any visual guidance or sensorimotor feedback. Subjects were then required to keep their fingers on the buttons of the sensitive four key keyboard to check that there was not any actual movement and the arm stayed immobile along their body on the laboratory bench.
Kinesthetic imagery
The participants were asked to perceive body sensations of the finger sequence without any movement. The hand position on the keyboard was similar to the VI condition. Furthermore, they were also requested to close their eyes to avoid visual guidance.
Perceptual control condition
The subjects were specifically instructed to remain motionless while listening to distinct high‐ and low‐tones sounds. This control condition was chosen to control for the same “start” and “stop” sound signals that were used in the other experimental conditions.
The order of administration of each experimental and control condition was counterbalanced across the six runs. Instructions were given on a computer screen that could be seen through a mirror embedded within the head‐coil. After reading the instructions, the subjects were required to close their eyes. Each 30 s‐period of the experimental conditions (physical execution, VI and KI) were composed of five trials (either physically or mentally performed every 6 s). Two separate sounds were used to indicate the beginning of each trial (high tones) and end of a run (low tones) during the experimental and perceptual control conditions, using MR‐compatible headphones (MR confon HP‐SI01, Germany). The low‐pitch tones also indicated to subjects to open their eyes and to remain in a resting awake state until the next assignment which appeared on the computer screen (rest‐period).
Before the scanning session began, all participants were given a few trials inside the scanner until they physically performed five successive correct finger sequences. They were also asked to perform five MI trials to become familiar with the presentation of the auditory stimuli and the apparatus itself. To do so, they were asked to close their eyes, so that they did not have any further visual guidance during the experiment or any sensorimotor feedback to ensure that the training conditions would be very similar to those of the following scanning session.
Functional imaging
Blood oxygen level‐dependent signal was recorded using a 3‐T whole‐body TRIO system (Siemens, Erlangen, Germany) located at the Functional Neuroimaging Unit, University of Montreal Geriatric Institute. The subject's head was immobilized using foam cushions. The protocol lasted 90 min and included (i) one localizer (scout) to localize functional axial slices, six functional runs, and one high‐resolution anatomical scan [sagittal T1‐weighted; repetition time: 13 ms; echo time: 4.92 ms; one slab divided into 160 slices; matrix size: 256 × 256; voxel size: 1 × 1 × 1 mm3; partial Fourier imaging 7/8; bandwidth 140 Hz per voxel]; (ii) Forty‐three oblique axial gradient echo‐planar imaging T2*‐weighted images [repetition time: 4.5 s; echo time: 30 ms; α: 90°; bandwidth: 1 562 Hz per voxel; field of view: 192 × 192 mm2; voxel size: 1.5 × 1.5 × 2.5 mm3; partial Fourier imaging 6/8; matrix size: 128 × 128]. For each series, 75 echo‐planar imaging volumes were acquired over 5 min and 37.5 s.
Behavioral recordings
Behavioral dependent variables (key presses, movement frequency, total sequence speed, and reaction times) were automatically recorded based on the subjects' responses using a home‐made MATLAB‐written routine. For each participant, this software compared the sequence of key presses produced by the subject to the correct sequence template to be performed, hence allowing detecting any discordance between the real and expected taps within the given sequence.
Functional magnetic resonance imaging data analysis
Functional data analyses were performed with the toolbox Statistical Parametric Mapping (SPM2, Wellcome Department of Cognitive Neuroscience, London). Motion correction in the functional images was done first using the SPM realignment. This estimates a set of six rigid‐body transformation parameters for each image by finding the parameters that minimize the mean squared difference between it and a reference image. The middle image of the last run of the session was used as the reference image for each subject. The anatomical image was realigned to the mean functional image with the SPM coregister method [Collignon et al., 1995]. The functional and anatomical images were first normalized to the MNI coordinates (avg. 152 T1.mnc template with a final voxel size of 1.5 × 1.5 × 2.5 mm3) using the 4th degree B‐spline interpolation method, and finally into the standard proportional stereotaxic space of Talairach and Tournoux [1988]. The scans were smoothed using a Gaussian kernel set at 8‐mm full width at half‐maximum. Statistical analysis was done using the general linear model to describe the data in terms of experimental and confounding effects, as well as residual variability. Six regressors were used (x, y, z, pitch, roll, and yaw). Single subject analyses were first performed with a first‐level analysis (fixed‐effect), which use within‐subject variance and provide for inferences that generalize to the subjects studied. Then group analyses were done with random‐effects analyses, which involve taking the contrasts of parameters estimated from a first‐level (fixed‐effect) analysis and entering them into a second‐level (random‐effect) analysis. To identify the location of brain areas involved in each task, one sample t‐tests were used to contrast (i) the actual, VI and KI conditions with the perceptual control condition (i.e., physical execution vs. perceptual control, VI vs. perceptual control, and KI vs. perceptual control), (ii) the physical condition with each MI condition (physical execution vs. VI and physical execution vs. KI), and (iii) the VI condition vs. KI condition. Comparisons of the functional data between runs and between sessions were assessed at the P < 0.005 uncorrected statistical threshold for multiple comparisons. In these maps, activated clusters were considered significant if their spatial extent was >10 voxels. The results are presented as mean (standard deviation) values.
RESULTS
Pre‐Experiment
The mean MIQ‐R score in the good imager group differed significantly from that of the other subjects (t = 2.77, P < 0.01), the mean scores being 45.54 (2.7) and 38.25 (9.2), respectively. Good imagers also assigned a significantly higher score (3 [0.2]) in evaluating the vividness of their MI than did poor imagers (2.56 [0.6], t = 2.2, P < 0.05). The mean score based on the ANS activity (number of responses + arousal level score) strongly differed between the good imager group (7.08 [3.9]) and the other subjects (−0.2 [2.5], t = 5.99, P < 0.0001). An example of SR response comparison in good and poor imagers is presented in Figure 2.
Figure 2.
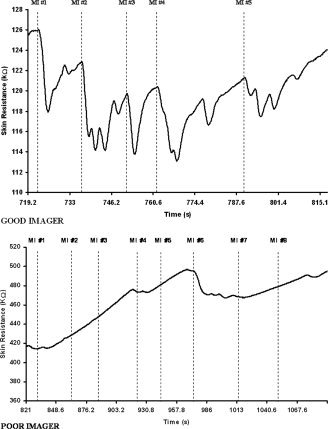
Skin resistance responses during motor imagery. In the good imager group, a response (indicated by the dotted line) was recorded during each motor imagery trial, hence attesting to mental work. Conversely, in the poor imagers, the lack of skin resistance responses attests the difficulty to form an accurate representation of action. The strong increase in skin resistance throughout the session also indicated that the subject becomes too relaxed and was not able to keep an adequate arousal level. MI, motor imagery.
By contrast, the absolute mean time difference between the actual and imagined movement durations did not differ (t = −1.2, P > 0.05, NS) in the two groups, even though the good imagers were found to be faster. The mean difference time was 2.22 s (1.5) in the good imagers and 3.26 s (2.8) in the other subjects.
Finally, the global imagery scores in the good imager group differed significantly from those of the other subjects (t = 4.8, P < 0.0001) as their means were 53.4 (4.7) and 39.9 (9.5), respectively. Interestingly, there was no significant gender difference on the global imagery score or on any of the subscores composing it, and thus there was no need to subdivide the subject's group by gender.
Functional Magnetic Resonance Imaging Study
Behavioral data
During the first run, subjects made 9% of errors on average and the mean time to physically complete the eight item finger sequence opposition task was 2.98 s (0.5). Performance remained stable from run to run. Indeed, subjects made 11.4% errors on average during the five runs and completed the correct sequence in 2.94 s (0.12). There was no learning effect from the first to the last run of the experiment.
Functional magnetic resonance imaging data
Physical execution vs. perceptual control condition
When the perceptual control condition was subtracted from the physical execution condition, the results revealed significant activations in the expected motor network including cortical motor‐related areas as well as subcortical structures comprising the basal ganglia and cerebellum (Table I, Fig. 3). More specifically, peaks of activations were located in the right primary motor area (BA 4) and bilaterally in the lateral dorsal premotor cortex (BA 6) and in medial surfaces of the frontal cortex including both SMA and pre‐SMA regions. Significant signal changes were also observed in the inferior frontal areas (BA 44) bilaterally and in the left cingulate cortex (BA 24). In the parietal lobe, data showed activations in both inferior and superior regions, the network including the primary sensory areas (BA 1‐2‐3), the inferior parietal lobule (BA 40), and the right superior parietal region (BA 5). Finally, bilateral activations were found in the anterior and posterior parts of the putamen corresponding most probably to the associative and sensorimotor regions, in the globus pallidus as well as the right caudate nucleus. Activations were also located in both the anterior and posterior cerebellar regions [Lobules IV, V, VI, and Crus I; see Schmahmann et al., 1999].
Table I.
Coordinates of peak activations for the physical execution, visual imagery, and kinesthetic imagery conditions versus the perceptual control condition
| Anatomical areas | Hemisphere | Physical execution vs. control | Visual imagery vs. control | Kinesthetic imagery vs. control | |||||||||
|---|---|---|---|---|---|---|---|---|---|---|---|---|---|
| x | y | z | t value | x | y | z | t value | x | y | z | t value | ||
| Occipital cortex | |||||||||||||
| Primary visual area (BA 17) | L | −11 | −86 | 2 | 3.26 | ||||||||
| R | 16 | −65 | 42 | 4.42 | |||||||||
| Pre‐striate cortex (BA 18) | L | −14 | −68 | −4 | 3.93 | ||||||||
| R | 20 | −72 | −9 | 3.6 | |||||||||
| Pre‐striate cortex (BA 19) | L | −12 | −62 | −6 | 4.55 | ||||||||
| R | 36 | −69 | −14 | 3.36 | |||||||||
| Parietal cortex | |||||||||||||
| Inferior parietal lobule (BA 31) | R | 8 | −72 | 23 | 3.23 | ||||||||
| Inferior parietal lobule (BA 40) | L | −36 | −40 | 47 | 3.86 | −51 | −30 | 32 | 6.25 | −39 | −41 | 41 | 9.85 |
| R | 62 | −22 | 20 | 7.43 | 34 | −36 | 49 | 8.1 | 46 | −29 | 46 | 10.02 | |
| L | −50 | −30 | 51 | 3.8 | −60 | −22 | 26 | 3.66 | |||||
| R | 46 | −29 | 46 | 6.15 | 40 | −40 | 57 | 6.74 | |||||
| Parietal areas (BA 1,2,3) | L | −45 | −27 | 39 | 4.5 | −61 | 0 | 6 | 5.52 | ||||
| R | 39 | −21 | 51 | 9.75 | 60 | −27 | 40 | 3.31 | |||||
| R | 47 | −24 | 43 | 6.83 | |||||||||
| Superior parietal lobule (BA 5) | R | 38 | −44 | 63 | 4.14 | 39 | −40 | 60 | 6.25 | ||||
| Superior parietal lobule (BA 7) | L | −30 | −48 | 49 | 4.85 | ||||||||
| R | 21 | −59 | 58 | 4.21 | 18 | −44 | 52 | 3.85 | |||||
| Motor and premotor cortex | |||||||||||||
| Primary motor cortex (BA 4) | R | 41 | −17 | 56 | 11.4 | 36 | −15 | 52 | 4.36 | 36 | −15 | 52 | 3.76 |
| Laterla premotor area (BA 6) | L | −39 | −9 | 57 | 6.68 | −36 | −11 | 43 | 5.6 | −28 | −7 | 56 | 6.48 |
| R | 27 | −12 | 59 | 7.09 | 24 | −11 | 54 | 7.61 | 27 | −8 | 61 | 7.29 | |
| L | −27 | −8 | 50 | 3.41 | |||||||||
| R | 42 | −6 | 57 | 4.29 | |||||||||
| Medial premotor area (BA 6) | |||||||||||||
| Pre‐SMA | L | −8 | −6 | 61 | 4.72 | −9 | −9 | 61 | 8.94 | −9 | −9 | 61 | 5.4 |
| R | 8 | −6 | 61 | 9.64 | 9 | −6 | 59 | 6.08 | 9 | −2 | 63 | 3.33 | |
| SMA proper | L | −3 | −3 | 53 | 8.83 | −3 | −3 | 66 | 5.91 | −4 | −5 | 64 | 7.45 |
| R | 5 | 1 | 55 | 3.68 | 5 | −3 | 66 | 3.06 | |||||
| L | −5 | 1 | 55 | 3.73 | |||||||||
| Ventral premotor cortex (BA 44) | L | −46 | −1 | 8 | 7.03 | −45 | 2 | 8 | 7.96 | ||||
| R | 57 | 4 | 19 | 8.28 | 46 | 2 | 9 | 6.43 | |||||
| Ventral premotor cortex (BA 45) | L | −61 | 11 | 19 | 7.69 | ||||||||
| Prefrontal cortex | |||||||||||||
| Dorsolateral prefrontal area (BA 9) | L | −57 | 4 | 22 | 9.07 | ||||||||
| R | 60 | 7 | 25 | 7.06 | |||||||||
| Dorsolateral prefrontal area (BA 46) | L | −40 | 33 | 12 | 3.47 | −42 | 46 | 23 | 3.61 | ||||
| Rostral prefrontal area (BA 10) | R | 39 | 44 | 26 | 5.59 | ||||||||
| Orbito‐frontal cortex (BA 13) | L | −40 | 9 | 11 | 9.02 | ||||||||
| Limbic regions | L | −39 | 12 | 8 | 8.25 | ||||||||
| Cingulate cortex (BA 24) | L | −2 | 0 | 37 | 5.72 | ||||||||
| Subcortical regions | |||||||||||||
| Caudate nucleus | L | −13 | 11 | −1 | 5.12 | ||||||||
| R | 18 | −24 | 18 | 3.81 | 20 | −26 | 18 | 3.18 | |||||
| Globus pallidus | L | −24 | −10 | −2 | 3.94 | 22 | −13 | 3 | 5.28 | −21 | −2 | 0 | 4.58 |
| R | 24 | −15 | 4 | 5.13 | −20 | −11 | 3 | 3.22 | 24 | −9 | 1 | 4.75 | |
| Anterior putamen | L | −25 | 5 | 10 | 3.78 | −20 | 3 | 5 | 6.35 | −27 | 9 | 12 | 6.16 |
| R | 23 | 6 | 13 | 4.66 | 20 | 5 | 9 | 5.77 | 20 | 5 | 9 | 4.45 | |
| Posterior putamen | L | −26 | −2 | −5 | 4.5 | −27 | −9 | 12 | 6.69 | −28 | −5 | 11 | 8.79 |
| R | 30 | −14 | 8 | 5.58 | 27 | −9 | 12 | 4.15 | 22 | −3 | 0 | 6.89 | |
| Cerebellum | |||||||||||||
| Anterior (lobule IV) | L | −12 | −47 | −15 | 11.92 | −26 | −30 | −24 | 4.33 | −11 | −49 | −18 | 4.1 |
| L | −4 | −48 | 0 | 3.59 | −4 | −49 | −5 | 3.45 | |||||
| Anterior (lobule V) | L | −21 | −44 | −21 | 15.33 | −28 | −36 | −26 | 3.96 | −10 | −55 | −2 | 5.08 |
| R | 8 | −57 | −2 | 4.14 | |||||||||
| L | −5 | −55 | −2 | 13.58 | −15 | −51 | −20 | 4.67 | |||||
| L | −12 | −49 | −8 | 13.21 | |||||||||
| Anterior (lobule VI) | L | −35 | −52 | −18 | 7.44 | −34 | −46 | −25 | 3.32 | −15 | −66 | −8 | 5.37 |
| R | 35 | −51 | −20 | 5.88 | 40 | −51 | −20 | 6.66 | 38 | −50 | −23 | 6.18 | |
| L | −3 | −68 | −9 | 3.41 | |||||||||
| Anterior (lobule VIII) | −4 | −62 | −25 | 3.86 | |||||||||
| Posterior (lobule V) | L | −5 | −59 | −15 | 7.58 | ||||||||
| Posterior (lobule VI) | L | −20 | −67 | −14 | 10.67 | −24 | −57 | −17 | 5.25 | −32 | −55 | −17 | 7.03 |
| R | 24 | −61 | −15 | 7.74 | 7 | −70 | −17 | 4.7 | 6 | −69 | −17 | 4.71 | |
| L | −14 | −67 | −12 | 10.02 | −36 | −59 | −17 | 4.19 | −18 | −67 | −14 | 5.04 | |
| Posterior (lobule VIIb) | −42 | −55 | −20 | 3.9 | |||||||||
| Posterior (Crus 1) | R | 44 | −55 | −2 | 3.39 | 38 | −63 | −36 | 3.46 | ||||
Figure 3.
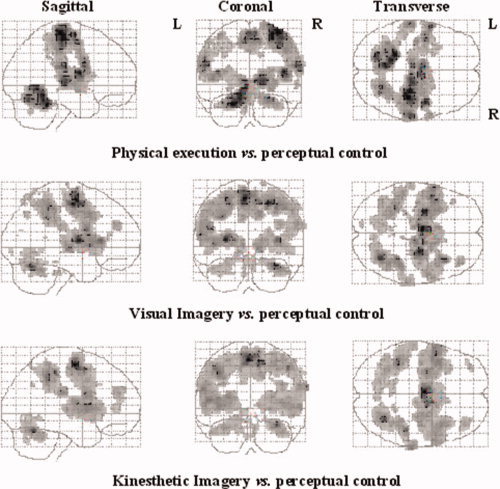
SPM activation maps comparing the different experimental conditions (physical execution, VI, and KI) with the perceptual control condition. Voxels are displayed on a progressive gray scale. The maps are displayed on Talairach space as a maximum intensity projection (all voxels activated are visible as if viewed in transparency through the brain) viewed from the right side (sagittal), the back (coronal), and the top (transverse) of the brain. [Color figure can be viewed in the online issue, which is available at www.interscience.wiley.com.]
Visual imagery vs. perceptual control condition and physical execution
When the VI condition was first compared with the perceptual control condition, an important set of activated areas was found in the occipital regions bilaterally. This network included both the primary (BA 17) and associative visual areas corresponding to BA 18 and 19 (Table I, Fig. 3). Additional activations were located bilaterally in the inferior parietal lobule (BA 40), as well as in the right superior (BA 7) and inferior (BA 31) parietal areas. In the frontal lobe, the right primary motor area (BA 4), and both the lateral (BA 6) and medial premotor areas (anterior and posterior parts of the SMA) were activated bilaterally. Activation was also found in the left dorsolateral (BA 46) and right rostral (BA 10) prefrontal areas. Finally, bilateral activations were found in the putamen (anterior and posterior parts), globus pallidus and cerebellar hemispheres (Lobules IV, V, VI, and VIII).
When VI was then contrasted to the physical execution condition, activations were observed in the left inferior prefrontal area (BA 45) and the prefrontal cortex (BA 24–32). A cluster of activations was also found in the superior part of the lateral premotor area (BA 6; z coordinate of t‐value maxima = 66 and 60 in the left and right hemispheres, respectively). The superior parietal areas (BA 5–7) were also activated bilaterally. Finally, a large activation of the occipital region was observed, including the bilateral primary and associative areas (BA 17‐18‐19).
Kinesthetic imagery vs. perceptual control condition and physical execution
When KI was directly compared with the perceptual control condition (Table I, Fig. 3), activations were observed bilaterally in the medial and lateral premotor areas, prefrontal regions, inferior and superior parietal areas, basal ganglia and cerebellar cortex. The right primary motor cortex (BA 4), and both the lateral (BA 6) and medial premotor areas (anterior and posterior parts of the SMA) were also activated bilaterally. In addition, bilateral activation was located in the inferior (BA 44/45) and dorsolateral prefrontal areas (BA 9/46). An important bilateral network of activated regions including the primary sensory areas (BA 1–3) and both superior (BA 5–7) and inferior (BA 40) parietal lobules were recruited as well. Increased activity was also observed bilaterally in the anterior and posterior parts of the putamen, in the caudate nucleus and in the globus pallidus. Finally, activations were also found in the cerebellar hemispheres (Lobules IV, V, VI, VIIb, and Crus I) and in the right inferior temporal lobule (BA 22).
When KI was contrasted to the physical execution condition, bilateral activations were found in the lateral premotor (BA 6), ventral premotor (BA 44), and prefrontal cortex (BA 46). A large activation was also observed in the inferior (BA 40) and superior (BA 7) parietal lobules, bilaterally. Finally, two peaks of activation were also observed in the occipital cortex (BA 19) and in the right temporal lobe (BA 21–22), respectively.
Visual imagery vs. kinesthetic imagery
Most importantly, when VI and KI conditions were compared directly, both contrast analyses revealed activations in the lateral premotor cortex, but VI recruited areas that were more posterior and superior than during KI, whereas activity in the anterior and posterior parts of the SMA was stronger during KI than during VI (Table II; Fig. 4).
Table II.
Coordinates of peak activations during visual versus kinesthetic imagery conditions
| Anatomical areas | Hemisphere | Visual imagery vs. kinesthetic imagery | Kinesthetic imagery vs. visual imagery | ||||||
|---|---|---|---|---|---|---|---|---|---|
| x | y | z | t value | x | y | z | t value | ||
| Occipital cortex | |||||||||
| Primary visual area (BA 17) | R | 15 | −77 | 12 | 3.29 | ||||
| Prestriate cortex (BA 18) | R | 8 | −72 | 21 | 3.06 | ||||
| Prestriate cortex (BA 19) | L | −38 | −77 | 9 | 3.06 | ||||
| R | 27 | −80 | 40 | 3.97 | |||||
| Parietal cortex | |||||||||
| Inferior parietal lobule (BA 40) | L | −63 | −30 | 29 | 5.24 | ||||
| R | 59 | −41 | 32 | 6.05 | |||||
| Superior parietal lobule (BA 5) | R | 3 | −40 | 57 | 5.61 | ||||
| Superior parietal lobule (BA 7) | L | −18 | −54 | 55 | 4.30 | ||||
| R | 27 | −76 | 45 | 4.19 | |||||
| Motor and premotor cortex | |||||||||
| Lateral premotor area (BA 6) | L | −32 | −7 | 50 | 3.56 | −53 | −5 | 9 | 6 |
| R | 26 | −9 | 53 | 4.33 | 56 | 1 | 17 | 4.51 | |
| Medial premotor area (BA 6) | |||||||||
| Pre‐SMA | R | 4 | 9 | 58 | 3.75 | ||||
| SMA proper | R | 11 | −6 | 67 | 3.92 | ||||
| Ventral premotor cortex (BA 44) | L | −58 | 6 | 19 | 6.61 | ||||
| R | 56 | 6 | 17 | 4.84 | |||||
| Prefrontal cortex | |||||||||
| Dorsolateral prefrontal area (BA 9) | L | −47 | 21 | 36 | 3.27 | ||||
| Limbic regions | |||||||||
| Cingulate cortex (BA 24) | R | 10 | 5 | 36 | 4.3 | ||||
| Subcortical regions | |||||||||
| Caudate nucleus | R | 20 | −24 | 21 | 4.55 | ||||
| Putamen POST | L | −29 | −12 | 1 | 3.2 | ||||
| R | 29 | −8 | 11 | 4.16 | |||||
| Cerebellum | |||||||||
| Anterior (lobule VI) | L | −32 | −51 | −20 | 3.7 | ||||
| Posterior (lobule VI) | L | −23 | −65 | −17 | 3.14 | ||||
| R | 22 | −61 | −20 | 3.82 | |||||
| Posterior (Crus I) | −42 | −55 | −20 | 3.9 | |||||
| Posterior (Lbule VIIb) | R | 38 | −63 | −36 | 3.46 | ||||
Figure 4.
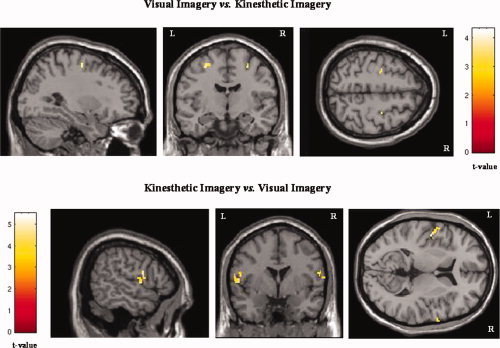
Activation maps of the lateral premotor area during the visual and kinesthetic imagery conditions. When the visual imagery condition was contrasted with the kinesthetic imagery condition (upper row, x = −29; y = −9; z = 53), the activation was located more posteriorly and superiorly than when the kinesthetic imagery condition was compared to the visual imagery condition (lower row, x = −59; y = 8; z = 7).
Furthermore, VI showed exclusive occipital activations (BA 17‐18‐19) and manifested more prominent blood oxygen level‐dependent signal that was clustered within the superior parietal regions (BA 5‐7; Fig. 4). In the inferior parietal lobule (BA 40), the contrasts between VI and KI showed that activation was located in a more lateral and anterior part during KI and in a more posterior part during VI. Finally, KI showed stronger activation in many frontal areas (BA 9, 24), including the inferior frontal areas (BA 44). Bilateral basal ganglia (putamen and caudate nucleus) and cerebellar activations (Lobule VI, VIIb, and Crus I) were also exclusively seen when the KI condition was compared to the VI condition (Fig. 5).
Figure 5.
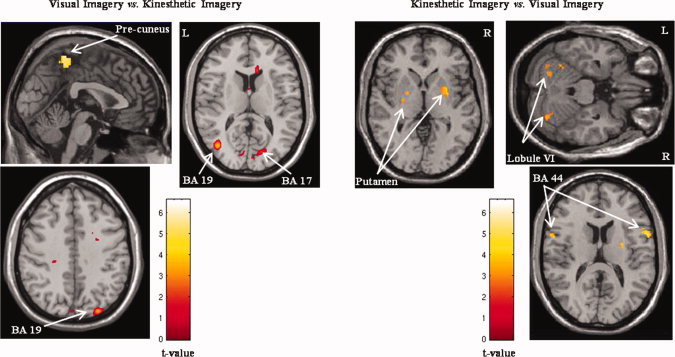
Activation maps of the exclusive brain activations during both visual and kinesthetic imagery conditions. When the visual imagery condition was contrasted to the kinesthetic imagery condition (left side), selective activation was found in the superior parietal lobule (BA 5–7; X = −1) and occipital cortex (BA 17–19, Z = 12 and Z = 40). When the visual imagery condition was subtracted from the kinesthetic imagery condition (right side), exclusive activation was located in the putamen (Z = 1), the cerebellar cortex (Z = −23), and the inferior prefrontal area (BA 44, Z = 13).
DISCUSSION
The main purpose of this study was to determine whether good imagers recruit comparable or distinct neural substrates during both VI and KI of complex hand movements. We hypothesized that different types of MI might be mediated by distinct neural networks involving the cerebral regions related to the predominant sensory systems supporting the MI content. Accordingly, the VI task was thought to require primarily the visual perception of the subject's fingers movement in his mind's eye, whereas KI was believed to be associated with motor functions per se, hence requiring subjects to imagine or to feel the movement while considering the body as a generator of forces. Visual regions were thus expected to be more activated during VI, whereas the motor systems and the sensorimotor areas were assumed to be primarily recruited during KI.
A critical issue related to the classical studies dealing with MI, however, is that the subject's compliance with instructions has rarely been controlled adequately. This particular methodological concern is important to consider as subjects may encounter difficulty to dissociate VI from KI, even though they have received specific instructions and understood the difference between MI based on visual and kinesthetic cues. To verify in the present study that subjects performed MI as instructed to, we used both subjective and objective measures to evaluate the individual accuracy of MI, including physiological measures from the ANS. The combination of these complementary techniques is a valid procedure to control the quality of MI, hence guaranteeing the high‐MI abilities of the participants in the fMRI study [Guillot and Collet, 2005a; Lotze and Halsband, 2006]. Ideally, simultaneous electromyographic (EMG) data should have been used to record the muscular quiescence during MI and to ensure that the pattern of cerebral activation observed during MI was not due to any movement. However, fMRI activations during MI of finger movements have previously been found independent from the degree of EMG activation [Porro et al., 1996], hence suggesting that fMRI changes can be mainly attributable to the activity of intracortical circuits and not due to a muscular contraction. Furthermore, we did not observe any movement during MI, as no behavioral data were recorded while the hand remained on the four key keyboard.
As expected and consistent with earlier neuroimaging studies, when we compared the physical execution and perceptual control conditions [Decety et al., 1994; Gerardin et al., 2000; Lotze et al., 1999, 2003; Solodkin et al., 2004], activations were found in the motor‐related regions including the motor and premotor cortices, as well as the SMA and the superior and inferior parietal lobules. The anterior and posterior parts of the putamen and both the anterior and posterior regions of the ipsilateral cerebellum were also recruited. The results revealed that both MI and motor performance share common neural substrates. The present study thus confirms the functional anatomy of MI and supports that MI and motor performance differ in the final motor output stage, which is not expressed during MI [Gerardin et al., 2000].
Motor Imagery vs. Perceptual Control Condition
Even if we postulated that different types of MI may result in different patterns of activation, the cerebral networks related to the two MI tasks were thought to share similarities, in order for the subject to generate a mental representation of the finger sequence. We compared the two MI conditions with the control task and observed activations within the right primary motor cortex (M1). Such activation is in accordance with recent fMRI studies that have reported significant changes in M1 activity during MI of hand movements [Kutz‐Buschbeck et al., 2003; Porro et al., 1996; Sharma et al., 2008]. As shown in previous studies, increased activity was also found in pre‐SMA and SMA regions during both VI and KI [Gerardin et al., 2000; Lafleur et al., 2002; Lotze and Halsband, 2006; Stephan et al., 1995]. The latter activations are consistent with the well‐known contribution of the pre‐SMA to several stages during movement planning [Deiber et al., 1992; Humberstone et al., 1997; Shima and Tanji, 1998], as well as the SMA proper, which is usually active during the initiation and execution of actions [Deiber et al., 1992; Passingham, 1997]. Our findings are also in agreement with those of Amador and Fried [2004] who showed through depth electrode recordings that SMA neurons respond more strongly during MI of a finger opposition sequence than during the physical execution of the same action, hence highlighting the crucial role of this structure in mediating MI. Furthermore, the results of the present study revealed increased activity in the dorsolateral prefrontal cortex (BA 46), which is known to be recruited when the temporal initiation of individual movements is under the subjects' volition, i.e., deciding when to initiate finger movements [Jahanshahi et al., 1995] as well as which finger to move [Frith et al., 1991]. Lastly, the activations observed in the superior parietal lobule (BA 7) and in subcortical regions including the putamen and cerebellum are consistent with results from earlier experiments which have assessed the neural networks activated by these two different forms of MI [Binkofski et al., 2000; Decety et al., 1994; Gerardin et al., 2000; Lotze et al., 1999; Solodkin et al., 2004].
In addition to the similarity in the pattern of activity during VI and KI presented earlier, the comparison of both VI and KI with the perceptual control condition also provided evidence of differences in brain activations. Indeed, the occipital regions (including the primary visual area and the prestriate cortex) were only recruited during VI, whereas the inferior and superior parietal lobules (BA 1–3 and 40), as well as the ventral premotor cortex (BA 44), were only seen during KI. Our results further confirm previous findings suggesting that the lateral part of the premotor cortex (BA 6) is active during both MI conditions [Decety et al., 1994; Gerardin et al., 2000; Stephan et al., 1995] and that VI recruits predominantly the dorsal part of this area, whereas KI activates its ventral part.
Interestingly, brain activity mediating VI and KI involved many regions with somatotopic organization. Previous studies have reported homuncular organization during MI [Ehrsson et al., 2003]. For example, lateralization has been observed in the primary motor cortex as well as in the SMA proper, whereas minimal lateral organization has been reported in other regions including the premotor cortex, the pre‐SMA and the cingulate cortex [Michelon et al., 2006]. Electroencephalographic studies have also found evidence for such lateral organization [Pfurtscheller and Neuper, 1997; Pfurtscheller et al., 1999]. In the present findings, however, we did not observe a clear pattern for lateral organization in the motor systems during both VI and KI, with the exception of the primary motor cortex. By contrast, we more often found bilateral patterns of activation in regions with somatotopic organization. As suggested by Michelon et al. [2006], this may be related to the repetition of the complex finger sequence MI task, so that participants relied less on motor simulation than on memory retrieval, which may have reduced the lateralization pattern of activity.
Visual Imagery vs. Kinesthetic Imagery
As expected, a divergent pattern of increased activity was observed when VI and KI were compared directly. First, the involvement of the primary visual area and the prestriate cortex during VI confirms the results of previous neuroimaging studies [Jackson et al., 2006; Mellet et al., 1998; Solodkin et al., 2004; Thompson and Kosslyn, 2000; Zacks et al., 2002], as such areas have been shown to be recruited when subjects visualize hand movements, but not when they perceived body sensations associated with KI. This demonstrates that VI of body part movements, compared with KI, shares common occipital substrates with visual perception [Andersen et al., 1985]. Second, consistent with neuroimaging and neuropsychological studies of healthy subjects as well as patients with parietal lobe lesions [Deiber et al., 1998; Gerardin et al., 2000; Sirigu et al., 1996], we found activations of the visual pathways including the superior parietal structures (BA 7) and the precuneus, which are known to be involved in the generation of mental images. These structures receive afferents from multisensory inputs, including the lower visual field, to elaborate the egocentric representation of space [Iacoboni et al., 1999; Lacquaniti and Caminiti, 1998], and have been found to be recruited during voluntary attention shifting and mental imagery tasks [Cavanna and Trimble, 2006; Malouin et al., 2004; Suchan et al., 2002]. Thus, the present results show that superior occipital and parietal regions, which are known to be involved in spatial mental imagery and mental navigation even in the absence of any visual input [Mellet et al., 1998], may also participate to the mental representation of specific body part movement during VI.
When contrasted to the VI condition, KI was found to elicit bilateral activations of the inferior parietal lobule (BA 40), a region known to have a crucial role during MI [Decety et al., 1994; Gerardin et al., 2000; Nair et al., 2003; Stephan et al., 1995; Suchan et al., 2002]. Further, the contrast also showed activations in several motor‐related regions, including the putamen, the caudate nucleus, and the cerebellar hemispheres. The latter results support the findings by Jackson et al. [2006] who reported a greater activation within the motor system during the first‐person perspective than during the third‐person perspective (considering that KI is closer to a first‐ than to a third‐person perspective). This finding suggests that the parallel characteristics between MI and physical execution of movements is based on the integration of a motor program and its corresponding sensory feedback, which is more directly available during KI than during VI [Koch et al., 2004; Prinz, 1997; Wulf and Prinz, 2001].
Finally, when each MI conditions was directly contrasted, the ventral premotor cortex (BA 44), which is usually active during MI [Binkofski et al., 2000; Buccino et al., 2006; Gerardin et al., 2000; Grafton et al., 1996; Solodkin et al., 2004] was also activated, but only during KI. The ventral premotor cortex corresponds to the human analogue of the so‐called mirror neurons region [F5 area in the monkey cortex—Rizzolati et al., 1996, 2001], where it has been shown that observed actions are reflected in the motor representation of the same action in the observer. The mirror neurons have been shown to respond at higher levels when strong kinesthetic feedback is perceived [Buccino et al., 2001; Koski et al., 2002]. The hemodynamic changes observed in this region during KI confirm the latter results, as KI involves more kinesthetic components than VI. However, the present results do not replicate those of Binkofski et al. [2000] who reported that the ventral part of the lateral premotor cortex is more pronounced during VI. The differences between the task design of the two studies may be the main explanation, as our finger sequence was more complex than that used by Binkofski et al. [2000]. Especially, significantly stronger premotor activity has been found during imagery of complex sequential compared with simple repetitive finger movements [Kuhtz‐Buschbeck et al., 2003].
To conclude, our results support our theory‐driven account suggesting that VI of a finger sequence task makes reference to the visual properties of visual perception, whereas KI includes in greater extend motor simulation processes closely related to the form and timing of actual movements [Michelon et al., 2006]. These findings thus demonstrate that different neural processing may be related to the VI and KI conditions. Although Solodkin et al. [2004] investigated the differences between VI and KI in two independent groups, i.e., one performing VI and the other using KI, our results are based on ANS recordings and behavioral tests, and fMRI scanning that were done in the same subjects, with good to excellent individual MI abilities, hence leading us to compare directly the neural activity elicited by VI and KI of finger movements. Even though these two conditions share common activations, the neural substrates mediating the ability to perform a specific MI type were found to be quite different, as the two MI conditions elicited separate patterns of neural activity. The differences and similarities in the patterns of activation mediating the two types of MI thus provide evidence that subjects are able to favor one sensory modality to form mental images, albeit they remain able to have a general mental representation of the movement. Such a finding has strong theoretical and practical implications both in motor learning and rehabilitation processes. First, neuroanatomical evidence of neural networks mediating MI is provided with regard to the use of MI based on visual or kinesthetic sensory cues. This finding corroborates the important number of behavioral and psychological studies related to the effect of MI in different stages of motor learning, which have suggested that VI or KI may be performed selectively with regards to the characteristics of the motor skill [for review, see Guillot and Collet, 2008]. Second, when considering the rehabilitation process following stroke, the present findings suggest that practitioners should pay more attention to the MI exercises they recommend to their patients. In some cases, the severity of the lesion is such that performing a motor task is very difficult, sometimes impossible, thus precluding early participation in an active rehabilitation program. Recent data suggest, however, that MI could be used as a therapeutic tool to prevent mis‐repair by keeping the remaining well‐functioning structures active, by improving neuronal plasticity, and thus to preserve motor functions [Jackson et al., 2004; Johnson‐Frey, 2004; Liu et al., 2004; Malouin et al., 2004; Page et al., 2001; Pascual‐Leone et al., 1995]. When considering the selective activations we observed during VI and KI, our results may also help to select groups of patients that could benefit from this therapeutic approach. The first step would then be to investigate their abilities to use VI and/or KI after cortical and subcortical lesions, with the aim to determine the optimal training conditions for learning how to use MI in neurological rehabilitation [Malouin et al., 2007].
Acknowledgements
The authors would like to express their gratitude to Vo An Nguyen for his technical assistance in data analyses.
REFERENCES
- Amador N,Fried I ( 2004): Single‐neuron activity in the human supplementary motor area underlying preparation for action. J Neurosurg 100: 250–259. [DOI] [PubMed] [Google Scholar]
- Andersen RA,Asanuma C,Cowan WM ( 1985): Callosal and prefrontal associational projecting cell populations in area 7A of the macaque monkey: A study using retrogradely transported fluorescent dyes. J Comp Neurol 232: 443–455. [DOI] [PubMed] [Google Scholar]
- Binkofski F,Amunts K,Stephan KM,Posse S,Schormann T,Freund HJ,Zilles K,Seitz RJ ( 2000): Broca's region subserves imagery of motion: A combined cytoarchitectonic and fMRI study. Hum Brain Mapp 11: 273–285. [DOI] [PMC free article] [PubMed] [Google Scholar]
- Boucsein W ( 1993): Methodological issues in electrodermal measurement In: Roy JC,Boucsein W, Fowles DC,Gruzelier JH, editors. Progress in Electrodermal Research. London: Plenum; pp. 31–41. [Google Scholar]
- Buccino G,Binkofski F,Fink GR,Fadiga L,Fogassi L,Gallese V,Seitz RJ,Zilles K,Rizzolatti G,Freund HJ ( 2001): Action observation activates premotor and parietal areas in a somatotopic manner: An fMRI study. Eur J Neurosci 13: 400–404. [PubMed] [Google Scholar]
- Buccino G,Solodkin A,Small SL ( 2006): Functions of the mirror neuron system: Implications fir neurorehabilitation. Cogn Behav Neurol 19: 55–63. [DOI] [PubMed] [Google Scholar]
- Cavanna AE,Trimble MR ( 2006): The precuneus: A review of its functional anatomy and behavioural correlates. Brain 129: 564–583. [DOI] [PubMed] [Google Scholar]
- Collet C,Roure R,Rada H,Dittmar A,Vernet‐Maury E ( 1996): Relationships between performance and skin resistance evolution involving various motor skills. Physiol Behav 59: 953–963. [DOI] [PubMed] [Google Scholar]
- Collet C,Dittmar A,Vernet‐Maury E ( 1999): Programming or inhibiting an action: Autonomic nervous system control of anticipation. Int J Psychophysiol 32: 261–276. [DOI] [PubMed] [Google Scholar]
- Collignon A,Maes F,Delaere D,Vandermeulen D,Suetens P,Marchal G ( 1995): Automated multi‐modality image registration based on information theory In: Bizais Y,Barillot C, DiPaola R, editors. The Proceedings of Information Processing in Medical Imaging. Dordrecht: Kluwer Academic Publishers; pp. 263–274. [Google Scholar]
- Decety J,Jeannerod M,Prablanc C ( 1989): The timing of mentally represented actions. Behav Brain Res 34: 35–42. [DOI] [PubMed] [Google Scholar]
- Decety J,Sjoholm H,Ryding E,Stenberg G,Ingvar DH ( 1990): The cerebellum participates in mental activity: Tomographic measurements of regional cerebral blood flow. Brain Res 535: 313–317. [DOI] [PubMed] [Google Scholar]
- Decety J,Jeannerod M,Germain M,Pastene J ( 1991): Vegetative response during imagined movement is proportional to mental effort. Behav Brain Res 42: 1–5. [DOI] [PubMed] [Google Scholar]
- Decety J,Jeannerod M,Durozard D,Baverel G ( 1993): Central activation of autonomic effectors during mental simulation of motor actions in man. J Physiol (London) 461: 549–563. [DOI] [PMC free article] [PubMed] [Google Scholar]
- Decety J,Perani D,Jeannerod M,Bettinardi V,Tadary B,Woods RP,Mazziotta JC,Fazio F ( 1994): Mapping motor representations with positron emission tomography. Nature 371: 600–602. [DOI] [PubMed] [Google Scholar]
- Dechent P,Merboldt KD,Frahm J ( 2004): Is the human primary motor cortex involved in motor imagery? Cogn Brain Res 19: 138–144. [DOI] [PubMed] [Google Scholar]
- Deiber MP,Passingham RE,Colebatch JG,Friston KJ,Nixon PD,Frackowiack RSJ ( 1992): Cortical areas and the selection of movement. A study with positron emission tomography. Exp Brain Res 84: 393–402. [DOI] [PubMed] [Google Scholar]
- Deiber MP,Ibanez V,Honda M,Sadato N,Raman R,Hallett M ( 1998): Cerebral processes related to visuomotor imagery and generation of simple finger movements studied with positron emission tomography. Neuroimage 7: 73–85. [DOI] [PubMed] [Google Scholar]
- Deschaumes‐Molinaro C,Dittmar A,Vernet‐Maury E ( 1991): Relationship between mental imagery and sporting performance. Behav Brain Res 45: 29–36. [DOI] [PubMed] [Google Scholar]
- Dominey P,Decety J,Broussolle E,Chazot G,Jeannerod M ( 1995): Motor imagery of a lateralized sequential task is asymmetrically slowed in hemi‐Parkinson's patients. Neuropsychol 33: 727–741. [DOI] [PubMed] [Google Scholar]
- Ehrsson HH,Geyer S,Naito E ( 2003): Imagery of voluntary movement of fingers, toes, and tongue activates corresponding body‐part‐specific motor representations. J Neurophysiol 90: 3304–3316. [DOI] [PubMed] [Google Scholar]
- Fowles DC,Christie MJ,Edelberg R,Grings WW,Lykken DT,Venables PH ( 1981): Publication recommendations for electrodermal measurements. Psychophysiol 18: 232–239. [DOI] [PubMed] [Google Scholar]
- Frith CD,Friston K,Liddle PF,Frackowiack RS ( 1991): Willed action and the prefrontal cortex in man: A study with PET. Proc R Soc Lond B Biol Sci 244: 241–246. [DOI] [PubMed] [Google Scholar]
- Furedy JJ,Scher H ( 1989): The law of initial values: Differentiated testing as an empirical generalization versus enshrinement as a methodological rule. Psychophysiol 26: 120–121. [DOI] [PubMed] [Google Scholar]
- Fusi S,Cutuli D,Valente MR,Bergonzi P,Porro CA,Di Prampero PE ( 2005): Cardioventilatory responses during real or imagined walking at low speed. Arch Ital Biol 143: 223–228. [PubMed] [Google Scholar]
- Gerardin E,Sirigu A,Lehericy S,Poline JB,Gaymard B,Marsault C,Agid Y,Le Bihan D ( 2000): Partially overlapping neural networks for real and imagined hand movements. Cereb Cortex 10: 1093–1104. [DOI] [PubMed] [Google Scholar]
- Grafton SC,Arbib MA,Fadiga L,Rizzolati G ( 1996): Localization of grasp representations in humans by positron emission tomography. Exp Brain Res 112: 103–111. [DOI] [PubMed] [Google Scholar]
- Guillot A,Collet C ( 2005a): Contribution from neurophysiological and psychological methods to the study of motor imagery. Brain Res Rev 50: 387–397. [DOI] [PubMed] [Google Scholar]
- Guillot A,Collet C ( 2005b): Duration of mentally simulated movement: A review. J Mot Behav 37: 10–20. [DOI] [PubMed] [Google Scholar]
- Guillot A,Collet C ( 2008): Construction of the motor imagery integrative model in sport: A review and theoretical investigation of motor imagery use. Int Rev Sport Exerc Psychol 1: 31–44. [Google Scholar]
- Guillot A,Collet C,Dittmar A ( 2004): Relationship between visual vs. kinesthetic imagery, field dependence‐independence and complex motor skills. J Psychophysiol 18: 190–199. [Google Scholar]
- Guillot A,Haguenauer M,Dittmar A,Collet C ( 2005): Effect of a fatiguing protocol on motor imagery accuracy. Eur J Appl Physiol 95: 186–190. [DOI] [PubMed] [Google Scholar]
- Guillot A,Lebon F,Rouffet D,Champely S,Doyon J,Collet C ( 2007): Muscular responses during motor imagery as a function of muscle contraction types. Int J Psychophysiol 66: 18–27. [DOI] [PubMed] [Google Scholar]
- Guillot A,Collet C,Nguyen VA,Malouin F,Richards C,Doyon J ( 2008): Functional neuroanatomical networks associated with expertise in motor imagery ability. Neuroimage 41: 1471–1483. [DOI] [PubMed] [Google Scholar]
- Hall CR,Martin KA ( 1997): Measuring movement imagery abilities: A revision of the movement imagery questionnaire. J Ment Imagery 21: 143–154. [Google Scholar]
- Hanakawa T,Immisch I,Toma K,Dimyan MA,Van Gelderen P,Hallett M ( 2003): Functional properties of brain areas associated with motor execution and imagery. J Neurophysiol 89: 989–1002. [DOI] [PubMed] [Google Scholar]
- Hashimoto R,Rothwell JC ( 1999): Dynamic changes in corticospinal excitability during motor imagery. Exp Brain Res 125: 75–81. [DOI] [PubMed] [Google Scholar]
- Hugdahi K ( 1996): Cognitive influences on human autonomic nervus system function. Curr Opin Neurobiol 6: 252–258. [DOI] [PubMed] [Google Scholar]
- Humberstone M,Sawle GV,Clare S,Hykin J,Coxon R,Botwell R,Macdonald IA,Morris PG ( 1997): Functional magnetic resonance imaging of single motor event reveals human presupplementary motor area. Ann Neurol 42: 632–637. [DOI] [PubMed] [Google Scholar]
- Iacoboni M,Woods RP,Brass M,Bekkering H,Mazziotta JC,Rizzolatti G ( 1999): Cortical mechanisms of human imitation. Science 286: 2526–2528. [DOI] [PubMed] [Google Scholar]
- Ingvar DH,Philipsson L ( 1977): Distribution of the cerebral blood flow in the dominant hemisphere during motor ideation and motor performance. Ann Neurol 2: 230–237. [DOI] [PubMed] [Google Scholar]
- Jackson PL,Doyon J,Richards CL,Malouin F ( 2004): The efficacy of combined physical and mental practice in the learning of a foot‐sequence task after stroke: A case report. Neurorehabil Neural Repair 18: 106–111. [DOI] [PubMed] [Google Scholar]
- Jackson PL,Meltzoff AL,Decety J ( 2006): Neural circuits involved in imitation and perspective‐taking. Neuroimage 31: 429–439. [DOI] [PMC free article] [PubMed] [Google Scholar]
- Jahanshahi M,Jenkins IH,Brown RG,Marsden CD,Passingham RE,Brokks DJ ( 1995): Self‐initiated versus externally triggered movements. I. An investigation using regional cerebral blood flow and movement related potentials in normal and Parkinson's disease. Brain 118: 913–933. [DOI] [PubMed] [Google Scholar]
- Jeannerod M ( 1994): The representing brain: Neural correlates of motor intention and imagery. Behav Brain Sci 17: 187–202. [Google Scholar]
- Johnson‐Frey SH ( 2004): Stimulation through simulation? Motor imagery and functional reorganization in hemiplegic stroke patients. Brain Cogn 55: 328–331. [DOI] [PubMed] [Google Scholar]
- Koch I,Keller P,Prinz W ( 2004): The ideomotor approach to action control: implications for skilled performance. Int J Sport Exerc Psychol 2: 362–375. [Google Scholar]
- Koski L,Wohlschlager A,Bekkering H,Woods RP,Dubeau MC,Mazziotta JC,Iacoboni M ( 2002): Modulation of motor and premotor activity during imitation of target‐directed actions. Cereb Cortex 12: 847–855. [DOI] [PubMed] [Google Scholar]
- Kuhtz‐Buschbeck JP,Mahnkopf C,Holzknecht C,Siebner H,Ulmer S,Jansen O ( 2003): Effector‐independent representations of simple and complex imagined finger movements: A combined fMRI and TMS study. Eur J Neurosci 18: 3375–3387. [DOI] [PubMed] [Google Scholar]
- Lacquaniti F,Caminiti R ( 1998): Visuo‐motor transformations for arm reaching. Eur J Neurosci 10: 195–203. [DOI] [PubMed] [Google Scholar]
- Lafleur MF,Jackson PL,Malouin F,Richards CL,Evans AC,Doyon J ( 2002): Motor learning produces parallel dynamic functional changes during the execution and imagination of sequential foot movements. Neuroimage 2: 142–157. [DOI] [PubMed] [Google Scholar]
- Levinson DF,Edelberg R ( 1985): Scoring criteria for response latency and habituation in electrodermal research: A critique. Psychophysiol 22: 417–426. [DOI] [PubMed] [Google Scholar]
- Li CR ( 2000): Impairment of motor imagery in putamen lesions in humans. Neurosci Lett 287: 13–16. [DOI] [PubMed] [Google Scholar]
- Liu KP,Chan CC,Lee TM,Hui‐Chan CW ( 2004): Mental imagery for promoting relearning for people after stroke: A randomized controlled trial. Arch Phys Med Rehabil 85: 1403–1408. [DOI] [PubMed] [Google Scholar]
- Lotze L,Montoya P,Erb M,Hulsmann E,Flor H,Klause U,Birbaumer N,Grodd W ( 1999): Activation of cortical and cerebellar motor areas during executed and imagined hand movements: An fMRI study. J Cogn Neurosci 11: 491–501. [DOI] [PubMed] [Google Scholar]
- Lotze L,Scheler G,Tan HR,Braun C,Birbaumer N ( 2003): The musician's brain: Functional imaging of amateurs and professionals during performance and imagery. Neuroimage 20: 1817–1829. [DOI] [PubMed] [Google Scholar]
- Lotze M,Halsband U ( 2006): Motor imagery. J Physiol Paris 99: 386–395. [DOI] [PubMed] [Google Scholar]
- Malouin F,Richards CL,Desrosiers J,Doyon J ( 2004): Bilateral slowing of mentally simulated actions after stroke. Neuroreport 15: 1349–1353. [DOI] [PubMed] [Google Scholar]
- Malouin F,Richards CL,Durand A,Doyon J ( 2007): Reliability of mental chronometry for assessing motor imagery ability after stroke. Arch Phys Med Rehabil 89: 311–319. [DOI] [PubMed] [Google Scholar]
- Mellet E,Petit L,Mazoyer B,Denis M,Tzourio N ( 1998): Reopening the mental imagery debate: Lessons from functional anatomy. Neuroimage 8: 129–139. [DOI] [PubMed] [Google Scholar]
- Michelon P,Vettel JM,Zacks JM ( 2006): Lateral somatotopic organization during imagined and prepared movements. J Neurophysiol 95: 811–822. [DOI] [PubMed] [Google Scholar]
- Nair DG,Purcott KL,Fuchs A,Steinberg F,Kelso JAK ( 2003): Cortical and cerebellar activity of the human brain during imagined and executed unimanual and bimanual action sequences: A functional MRI study. Cogn Brain Res 15: 250–260. [DOI] [PubMed] [Google Scholar]
- Naito E,Kochiyama T,Kitada R,Nakamura S,Matsumura M,Yonekura Y,Sadato N ( 2002): Internally simulated movement sensations during motor imagery activate cortical motor areas and the cerebellum. J Neurosci 22: 3683–3691. [DOI] [PMC free article] [PubMed] [Google Scholar]
- Page SJ,Levine P,Sisto SA,Johnston HV ( 2001): Mental practice combined with physical practice for upper‐limb motor deficit in subacute stroke. Phys Ther 81: 1455–1462. [DOI] [PubMed] [Google Scholar]
- Parsons LM,Gabrieli JD,Phelps EA,Gazzaniga MS ( 1998): Cerebrally lateralized mental representations of hand shape and movement. J Neurosci 18: 6539–6548. [DOI] [PMC free article] [PubMed] [Google Scholar]
- Pascual‐Leone A,Dang N,Cohen LG,Brasil‐Neto JP,Cammarota A,Hallett M ( 1995): Modulation of muscle responses evoked by transcranial magnetic stimulation during the acquisition of new fine motor skills. J Neurophysiol 74: 1037–1045. [DOI] [PubMed] [Google Scholar]
- Passingham RE ( 1997): Functional organisation of the motor system In: Frackowiack RSJ,Friston KJ, Frith CD, Dolan RJ, Maziotta JC, editors. Human Brain Function. San Diego, CA: Academic Press; pp 243–274. [Google Scholar]
- Pfurtscheller G,Neuper C ( 1997): Motor imagery activates primary sensoriomotor area in humans. Neurosci Lett 239: 65–68. [DOI] [PubMed] [Google Scholar]
- Pfurtscheller G,Neuper C,Ramsoer H,Meuller‐Gerking J ( 1999): Visually guided motor imagery activates sensorimotor areas in humans. Neurosci Lett 269: 153–156. [DOI] [PubMed] [Google Scholar]
- Porro CA,Francescato MP,Cettolo V,Diamond ME,Baraldi P,Zuiani C,Bazzocchi M,Di Prampero PE ( 1996): Primary motor and sensory cortex activation during motor performance and motor imagery: A functional magnetic resonance imaging study. J Neurosci 16: 7688–7698. [DOI] [PMC free article] [PubMed] [Google Scholar]
- Prinz W ( 1997): Perception and action planning. Eur J Cogn Psychol 9: 129–154. [Google Scholar]
- Rizzolati G,Fadiga L,Matelli M,Bettinardi V,Paulesu E,Perani D,Fazio F ( 1996): Localization of grasp representations in humans by PET, Part 1: Observation versus execution. Exp Brain Res 111: 246–252. [DOI] [PubMed] [Google Scholar]
- Rizzolatti G,Fogassi L,Gallese V ( 2001): Neurophysiological mechanisms underlying the understanding and imitation of action. Nat Rev Neurosci 2: 661–670. [DOI] [PubMed] [Google Scholar]
- Roland PE,Gulyas B ( 1994): Visual imagery and visual representation. Trends Neurosci 17: 281–296. [DOI] [PubMed] [Google Scholar]
- Roland PE,Larsen B,Lassen NA,Skinhoj E ( 1980): Supplementary motor area and other cortical areas in organisation of voluntary movements in man. J Neurophysiol 43: 118–136. [DOI] [PubMed] [Google Scholar]
- Roure R,Collet C,Deschaumes‐Molinaro C,Delhomme G,Dittmar A,Vernet‐Maury E ( 1999): Imagery quality estimated by autonomic response is correlated to sporting performance enhancement. Physiol Behav 66: 63–72. [DOI] [PubMed] [Google Scholar]
- Schmahmann JD,Doyon J,McDonald D,Holmes C,Lavoie K,Hurwitz AS,Kabani N,Toga A,Evans A,Petrides M ( 1999): Three‐dimensional MRI atlas of the human cerebellum in proportional stereotaxic space. Neuroimage 10: 233–260. [DOI] [PubMed] [Google Scholar]
- Schubert T,Von Cramon DY,Niendorf T,Pollmann S,Bublak P ( 1998): Cortical areas and the control of self‐determined finger movements: An fMRI study. Neuroreport 9: 3171–3176. [DOI] [PubMed] [Google Scholar]
- Sharma M,Pomeroy VM,Baron JC ( 2006): Motor imagery: A backdoor to the motor system after stroke? Stroke 37: 1941–1952. [DOI] [PubMed] [Google Scholar]
- Sharma M,Jones PS,Carpenter TA,Baron JC ( 2008): Mapping the involvement of BA 4a and 4p during motor imagery Neuroimage 41: 92–99. [DOI] [PubMed] [Google Scholar]
- Shima K,Tanji J ( 1998): Both supplementary and presupplementary motor areas are crucial for the temporal organization of multiple movements. J Neurophysiol 80: 3247–3260. [DOI] [PubMed] [Google Scholar]
- Sirigu A,Duhamel JR,Cohen LG,Pillon B,Dubois B,Agid Y ( 1996): The mental representation of hand movements after parietal cortex damage. Science 273: 1564–1568. [DOI] [PubMed] [Google Scholar]
- Solodkin A,Hlustik P,Chen EE,Small SL ( 2004): Fine modulation in network activation during motor execution and motor imagery. Cereb Cortex 14: 1246–1255. [DOI] [PubMed] [Google Scholar]
- Stephan KM,Fink GR,Passingham RE,Silbersweig D,Ceballo‐Bauman AO,Frith CD,Frackowiak RS ( 1995): Functional anatomy of the mental representation of upper extremity movements in healthy subjects. J Neurophysiol 73: 373–386. [DOI] [PubMed] [Google Scholar]
- Suchan B,Yaguez L,Wunderlich G,Canavan AG,Herzog H,Tellmann L,Homberg V,Seitz RJ ( 2002): Neural correlates of visuospatial imagery. Behav Brain Res 131: 163–168. [DOI] [PubMed] [Google Scholar]
- Talairach J,Tournoux P ( 1988): Co‐Planar Stereotaxic Atlas of the Human Brain. New York: Thieme. [Google Scholar]
- Thompson WL,Kosslyn SM ( 2000): Neural systems activated during visual mental imagery: A review and meta‐analysis In: Toga AW,Mazziotta JC, editors. Brain Mapping II: The Systems. San Diego: Academic Press; pp. 535–560. [Google Scholar]
- Vernet‐Maury E,Robin O,Dittmar A ( 1995): The ohmic perturbation duration, an original temporal index to quantify electrodermal responses. Behav Brain Res 67: 103–107. [DOI] [PubMed] [Google Scholar]
- Wang Y,Morgan WP ( 1992): The effects of imagery perspectives on the physiological responses to imagined exercise. Behav Brain Res 52: 167–174. [DOI] [PubMed] [Google Scholar]
- Wolbers T,Weiller T,Buchel C ( 2003): Contralateral coding of imagined body parts in the superior parietal lobe. Cereb Cortex 13: 392–399. [DOI] [PubMed] [Google Scholar]
- Wulf G,Prinz W ( 2001): Directing attention to movement effects enhances learning: A review. Psyschon Bull Rev 8: 648–660. [DOI] [PubMed] [Google Scholar]
- Wuyam B,Moosavi SH,Decety J,Adams L,Lansing RW,Guz A ( 1995): Imagination of dynamic exercise produced ventilatory responses which were more apparent in competitive sportsmen. J Physiol 482: 713–724. [DOI] [PMC free article] [PubMed] [Google Scholar]
- Zacks JM,Ollinger JM,Sheridan MA,Tversky B ( 2002): A parametric study of mental spatial transformation of bodies. Neuroimage 16: 857–872. [DOI] [PubMed] [Google Scholar]