

Abstract
Little is known about the effect of obesity on brain structures and cognition in healthy older adults. This study examined the association between body mass index (BMI), regional volume differences in gray and white matter measured by magnetic resonance imaging (MRI), and cognitive functioning in older females. Participants included 95 community‐dwelling older females (ages 52–92 years) who underwent extensive neuropsychological testing and high‐resolution MRI scanning. Optimized voxel‐based morphometry techniques were employed to determine the correlation between BMI and regional gray and white matter volumes. Volumes of significant regions were then correlated with cognitive functioning. Higher BMI was associated with decreased gray matter volumes in the left orbitofrontal, right inferior frontal, and right precentral gyri, a right posterior region including the parahippocampal, fusiform, and lingual gyri, and right cerebellar regions, as well as increased volumes of white matter in the frontal, temporal, and parietal lobes, even when hypertension was considered. Compared to normal weight women, obese women performed poorer on tests of executive functioning. Smaller gray matter volume in the left orbitofrontal region was associated with lower executive functioning. Additionally, despite the lack of significant group differences in memory and visuomotor speed, gray and white matter volumes predicted performance on these measures. The results provide additional evidence for a negative link between increased body fat and brain functioning in older females. Hum Brain Mapp, 2010. © 2009 Wiley‐Liss, Inc.
Keywords: aging, cognition, magnetic resonance imaging, obesity, voxel‐based morphometry
INTRODUCTION
Currently, obesity poses a significant health threat to individuals throughout much of the developed world and places a major burden on the health care system. Ogden et al. [2006] estimated that 66% of American adults were at least overweight and 32% met the World Health Organization criterion for obesity. Many health conditions including diabetes, cardiovascular disease, and certain cancers have been associated with obesity [Kopelman,2000]. In addition, there is growing evidence that increased body fat during mid‐life and late‐life increases the risk for neurodegenerative diseases, including Alzheimer's dementia [Gustafson et al.,2003; Kivipelto et al.,2005; Rosengren et al.,2005; Whitmer et al.,2005].
Several recent studies examining the relationship between cognitive function and obesity have provided somewhat inconsistent results. While some studies have reported that overweight and obese individuals show lower levels of cognitive performance in the areas of executive function [Gunstad et al.,2007; Boeka and Lokken,2008; Volkow et al.,2009], and attention and memory [Cournot et al.,2006], other studies have found no effect [Sweat et al.,2008; Ward et al.,2005], or even a positive relationship with increased weight associated with better cognitive performance [Kuo et al.,2006]. For example, Gunstad et al. [2007] reported a decline in executive function in overweight and obese individuals in a sample of very healthy adults (ages 20–82 years) that was independent of age. In contrast, a large‐scale study with 2,684 older adults, aged 65–94 years, revealed increased cognitive function associated with increasing body weight in the areas of verbal reasoning and visuospatial processing [Kuo et al.,2006]. Several studies focusing on the rate of cognitive decline in older adults found that risk for age‐related cognitive decline increases with increasing body weight [Cournot et al.,2006; Elias et al.,2003; Wolf et al.,2007], although one study failed to find such an effect [Sturman et al.,2008]. For example, higher body mass index (BMI) or waist–hip ratio taken at baseline in middle‐aged adults was associated with faster cognitive decline in learning and memory abilities [Cournot et al.,2006; Wolf et al.,2007] and executive functioning [Wolf et al.,2007]. Cognitive differences in older adults associated with body weight may be complicated by other factors such as gender and hypertension. Elias et al. [2003] found a negative correlation between memory performance and body weight in adults older than 55 years, but this association was observed only in males and was strengthened by the presence of hypertension.
A growing body of research suggests that obesity may result in structural changes in the brain that may mediate some of the cognitive changes associated with increased body weight. In studies using morphometric analysis of MRI and CT, greater body weight has been associated with lower whole brain volume in middle‐aged individuals [Ward et al.,2005; see also Taki et al.,2008]. Atrophy of the temporal lobe has been related to higher BMI in females, aged 70–84 years [Gustafson et al.,2004], and smaller hippocampal volumes were associated with larger waist–hip ratios in a sample of 112 older adults of both genders [Jagust et al.,2005]. Temporal lobe atrophy and hippocampal damage are a hallmark of Alzheimer's disease [Stoub et al.,2005; Whitwell et al.,2007a], and the results provide a possible mechanism for the link between obesity and increased prevalence of Alzheimer's disease.
Recent MRI studies have employed voxel‐based morphometery (VBM) to examine regional volume differences as a function of body weight. VBM is a nonbiased, whole brain technique that identifies regional volume differences of white and gray matter using structural images without prior hypotheses regarding specific brain regions of interest [Ashburner and Friston,2000]. The results of VBM studies have provided evidence of a much more complex pattern of volumetric differences in the brains of obese individuals that include both larger and smaller cortical and white matter volumes. For example, a study of 24 obese young adults (mean age 32 ± 8 years) demonstrated reduced gray matter in obese individuals compared to age‐matched normal weight controls in the frontal lobe bilaterally, left postcentral gyrus, bilateral putamen, and a large region of the right cerebellar hemisphere [Pannacciulli et al.,2006]. These regional volumes were negatively correlated with fasting plasma leptin concentration, a hormone that is produced in proportion to the amount of body fat [Pannacciulli et al.,2007]. Smaller volumes related to higher BMI were also found in the frontal, temporal, and parietal cortex, the cerebellum, and midbrain in a large study of 1,428 individuals, aged 12–81 years, that investigated the relationship between BMI and gray matter volumes across the lifespan [Taki et al.,2008]. However, these differences were only found for males but not females, suggesting that males and females might be affected differently by increasing BMI.
Interestingly, VBM studies have also reported larger regional brain volumes in obese individuals compared to normal weight controls in other regions of frontal, temporal, and cerebellar gray matter [Pannacciulli et al.,2006; Taki et al.,2008], as well as striatal white matter [Pannacciulli et al.,2006]. Moreover, a study conducted by Haltia et al. [2007] revealed larger white matter volumes in the temporal lobe, cerebellum, and brainstem in obese compared with normal weight individuals. Further, when obese participants went on a low calorie diet for 6 weeks, global white matter volume as well as white matter volume in the left temporal lobe was reduced. In contrast, gray matter volumes were not affected by dieting. The results suggest that white matter volumes may increase with body fat, possibly due to increased density of the lipid‐based myelin sheath, and dieting may partially reverse this effect.
One factor that is likely confounded with brain volume differences associated with BMI is the effect of hypertension, particularly in an aging population where the prevalence of hypertension increases. Several studies have reported reduced whole brain volumes in individuals with untreated hypertension [Firbanks et al.,2007; Wiseman et al.,2004] and an accelerated progression of brain volume loss with age compared to treated or normotensive participants [Firbanks et al.,2007]. Further, even when medicated with antihypertensive drugs for several years, cerebrospinal fluid space was larger and brain volumes were smaller for hypertensive individuals compared to normotensive controls [Chen et al.,2006; Raz et al.,2003; Salerno et al.,1992; Strassburger et al.,1997].
Given the prevalence of obesity and hypertension within the aging population, it is surprising that the relationships between BMI, hypertension, brain structure, and cognitive function have not been investigated more thoroughly. Few of the studies reviewed above focused primarily on older adults, and none have attempted to make a direct link between structural brain volumes and cognitive functioning in older adults as a function of body weight. Therefore, the aim of the present study was to examine structural differences in gray and white matter volumes in older females considering both BMI and hypertension and relate these changes to cognition. Although prior research has shown a link between obesity and reduced cognitive function as well as structural brain alterations in men [Elias et al.,2003; Taki et al.,2008], the relation between increased body fat, brain volume, and cognition in older women remains uncertain. While one study found an association in older women between atrophy and higher BMI using a rather global measure of temporal lobe volume [Gustafson et al.,2004], a VBM analysis assessing regional brain differences in females failed to find a correlation with BMI [Taki et al.,2008]. The results of the latter study could have been influenced by the wide age range of female participants (12–81 years), and it is possible that the relationship between BMI and brain volume may differ across the lifespan, from puberty to young adulthood to older adulthood. Whether obesity also relates to age‐related cognitive impairment in women has not been clarified. Studies assessing the relation between obesity and cognition in only females are limited and no association has been found. Furthermore, women and men differ in important factors such as the topological distribution of body fat [Goodman‐Gruen and Barrett‐Connor,1996] and hormone levels (see Lovejoy et al. [2009] for a review of obesity‐related sex differences). These factors warrant examination of women exclusively. We posed the following questions: (1) Are there regional brain volume differences associated with BMI in healthy older females as measured by MRI? (2) Does hypertension account for the observed relationships between regional brain volume changes and BMI? (3) Does cognitive functioning differ with BMI in older females and how does cognition relate to regional brain volume changes associated with BMI? Based on current literature, we hypothesized that increased BMI would be associated with decreased volumes of gray matter most likely in the frontal lobe and cerebellum, but may also be associated with increased volumes of gray and white matter in the frontal and temporal lobe. These regional changes, particularly within the frontal lobe, may be related to changes in cognitive function associated with increasing BMI.
METHODS
Participants
Ninety‐five females, aged 52–92 years, living independently in the community, were included in the study. Participants were recruited through newspaper advertisements and an existing database of older individuals who had participated in previous studies in our laboratory. All participants were screened to exclude a history of head injury with cognitive sequelae, neurological or psychiatric disorder, past or present drug and/or alcohol abuse, and contraindications for MRI. Height and weight were obtained at the time of the MRI scan. BMI was calculated as weight (kilograms) divided by the square of the height (meters). Three groups were established based on BMI using the classification system of the World Health Organization (WHO; http://www.who.int/topics/obesity/en/): normal weight (BMI 18.5–24.9; n = 53), overweight (BMI 25.0–29.9; n = 22), and obese (BMI ≥ 30.0; n = 20).
The presence of hypertension was determined by a self‐reported history of hypertension that was diagnosed by a physician. Previous studies have reported a sensitivity of 77% [Vargas et al.,1997] and 79% [Lima‐Costa et al.,2004] for self‐reported hypertension among women. Thus, our measure of hypertension was conservative and likely underestimated the true prevalence of hypertension in the sample. The reliability of the self‐report measure was increased by the additional requirement that all participants reporting hypertension were currently using at least one antihypertensive medication at the time of screening [Raz et al.,2003]. Study procedures were reviewed and approved by the Human Subjects Committee of the University of Arizona, and written informed consent was obtained from each participant.
Neuropsychological Testing
Participants underwent a detailed neuropsychological assessment that included the Mini Mental State Exam [MMSE; Folstein et al.,1975] and vocabulary from the Wechsler Abbreviated Scale of Intelligence [WASI; Wechsler,1999]. Three areas of cognitive function were assessed, including memory, executive function, and processing speed. Visuomotor speed was assessed with Trails A from Halstead‐Reitan battery [Reitan,1958]. Composite measures of memory and executive functioning were computed for each participant based on factor analysis methods described by Glisky and colleagues [Glisky and Kong,2008; Glisky et al.,2001]. The memory factor score was based on several tests: Logical Memory I recall total score, Verbal Paired Associates I, and Face Recognition I [WMS‐III; Wechsler,1997], Visual Paired Associates II [WMS‐R; Wechsler,1987], and Long‐Delay Cued Recall from the California Verbal Learning Test [CVLT; Delis et al.,1987]. The following tests were used to calculate the executive function factor score: number of correct categories completed in the modified Wisconsin Card Sorting Test [WCST; Hart et al.,1988], Mental Arithmetic total score [WAIS‐R; Wechsler,1981], total number of words produced to the cues F, A, and S in a verbal fluency task [Spreen and Benton,1977], Digit Span Backwards total score [WMS‐III; Wechsler,1997], and Mental Control total score [WMS‐III; Wechsler,1997]. For each participant, test scores were transformed into z scores based on Glisky and Kong's [2008] normative sample of 227 older adults and averaged to create two composite z scores for memory and executive function. All participants obtained memory and executive function scores that were within two standard deviations of their respective normative age groups.
MRI Imaging
Images were acquired on a GE 3.0T Signa VH/I whole body echospeed scanner equipped with an eight‐channel phased array coil (HD Signa Excite, General Electric, Milwaukee, WI). A set of three‐plane localizer images were acquired to align subsequent images. High resolution T1‐weighted whole‐brain structural images were acquired using a 3D spoiled gradient‐echo MRI (3D SPGR) pulse sequence with a section thickness of 0.7 mm, no skip (TR = 5.1 ms, TE = 2 ms, TI = 500 ms; flip angle = 15°; matrix = 256 × 256; FOV = 260 × 260 mm2).
Image Processing
Optimized VBM and subsequent analyses were carried out using SPM2 (http://www.fil.ion.ucl.ac.uk/spm/) following the methods of Good et al. [2001] and Gaser (http://dbm.neuro.uni-jena.de/vbm.html). A customized T1 template and prior probability maps of gray matter, white matter, and CSF were created using 64 participants from the current sample who were randomly chosen across the three BMI groups. Briefly, each structural MRI was normalized to the Montreal Neurological Institute (MNI) template. Normalized images were then smoothed with an 8‐mm full‐width half‐maximum (FWHM) isotropic Gaussian kernel and averaged together to create the template. Next, participants' high‐resolution 3D volumes were segmented into gray and white matter images in native space and non‐brain tissue was removed using an automated brain extraction procedure. The segmented images were normalized into the same stereotactic space by registering them to the custom template. The normalization parameters were reapplied to the original structural image to facilitate an optimal segmentation. The optimally normalized images in stereotactic space were then segmented again into gray matter, white matter, and cerebrospinal fluid using information about voxel intensity in addition to employing the prior probability maps derived from the custom templates. Segmentation also incorporated an image intensity nonuniformity correction [Ashburner and Friston,2000] to deal with image intensity variations. Regions of frank white matter hyperintensities that present as areas of lower signal intensity were excluded from segmented white matter images because of their signal properties. The gray and white matter images were modulated (multiplied by the Jacobian determinants derived from the spatial normalization step) to compensate for volume changes in nonlinear spatial normalization. This step allows for inferences on regional volume differences between groups rather than differences in tissue density [Ashburner and Friston,2000; Good et al.,2001]. All gray matter images were inspected for non‐brain tissue remaining after segmentation and any non‐brain tissue was removed manually. Consistent with previous VBM studies assessing the effects of BMI [Haltia et al.,2007; Pannacciulli et al.,2006,2007; Taki et al.,2008], the modulated gray and white matter images were smoothed with an isotropic Gaussian kernel of 12‐mm FWHM.
To correct for differences in head size, intracranial volumes (ICV) were measured following the manual tracing methods described by Raz et al. [2003]. The method has been shown to be highly reliable and does not have the difficulties separating CSF from skull that have been noted in automated segmentation procedures (for discussion, see http://www.jiscmail.ac.uk/cgi-bin/wa.exe?S1=spm). Briefly, SPGR images in native space were oriented parallel to the anterior–posterior commissural line using Analysis of Functional NeuroImages software (AFNI; http://afni.nimh.nih.gov/). Then, the ICV was traced manually on every eighth coronal section along the outer table of the cranium beginning with the orbits and continuing to the last visible posterior section of the skull. ICV was estimated as the number of traced voxels multiplied by the interval between the sections and the voxel size. The intraclass correlation based on a sample of 10 random brains was 0.98 across all raters, demonstrating a high interrater reliability for the procedure.
RESULTS
Demographics
Demographic information for normal weight, overweight, and obese participants are presented in Table I. Group differences were assessed using one‐way ANOVAs with follow‐up independent t‐tests. The groups were well matched in age (F = 1.4, ns), while education differed significantly across the three groups [F(2,92) = 5.1, P < 0.01]. Normal weight and overweight females had significantly more years of education than obese participants (ts = 3.4 and 2.2, respectively, Ps < 0.05). However, the groups did not differ on vocabulary (F < 1), which is considered a measure of general intellectual ability. Vocabulary has been demonstrated to be a better measure for estimating general intellectual ability than years of education, which is often influenced by socioeconomic factors [Heaton et al.,2009]. No group differences were found for MMSE (F = 1.4, ns). Chi‐square tests on the frequency of hypertension across groups indicated that hypertension was more common in obese (50%) than normal weight participants [15%; χ2(1) = 9.5, P < 0.01]. Hypertension was present in 23% of the overweight females, but this was not significantly different from normal weight females (χ2 < 1) and marginally significant from obese individuals [χ2(1) = 3.4, P = 0.06). Based on the sensitivity measures of self‐reported hypertension in women provided by previous studies [Lima‐Costa et al.,2004; Vargas et al.,1997], these numbers are probably an underestimate of the true prevalence of hypertension in the group. We would expect that approximately six additional participants may have undiagnosed hypertension.
Table I.
Demographic information and neuropsychological test results for three groups based on body mass index (BMI)
| Normal‐ weight (n = 53) | Overweight (n = 22) | Obese (n = 20) | |
|---|---|---|---|
| Age (years) | 71.0 ± 9.8 | 69.9 ± 8.1 | 66.9 ± 9.9 |
| Education (years) | 16.2 ± 2.3 | 15.9 ± 2.9 | 14.2 ± 2.0a |
| BMI (kg/m2) | 22.3 ± 1.6 | 27.6 ± 1.4 | 34.9 ± 3.3 |
| Hypertension (n) | 8 (15%) | 5 (23%) | 10 (50%)a |
| MMSE (raw score) | 28.9 ± 1.5 | 29.2 ± 0.9 | 29.1 ± 0.9 |
| Vocabulary (raw score) | 69.5 ± 5.6 | 70.0 ± 5.4 | 67.8 ± 6.9 |
| Memory Function (z‐score) | 0.31 ± 0.71 | 0.44 ± 0.46 | 0.43 ± 0.69 |
| Executive Function (z‐score) | 0.10 ± 0.58 | 0.04 ± 0.60 | −0.28 ± 0.62a |
| Trails A (sec) | 34.4 ± 10.6 | 34.6 ± 11.7 | 34.9 ± 13.9 |
Except for hypertension (number and percentage of participants), values represent means and standard deviations.
Significantly different from normal weight females.
Relations Between BMI, Gray Matter Volumes, and White Matter Volumes
Regional differences in gray matter volumes associated with BMI were examined on a voxel‐by‐voxel basis using multivariate regression analysis that included BMI as a continuous variable regressor and ICV and age as control variables. Voxel‐wise alpha was set at p < 0.05 employing a false discovery rate (FDR) correction for multiple comparisons. Only regions with clusters of 10 or more contiguous voxels are reported.
Table II shows the MNI coordinates and cluster extents for regions with a negative correlation between gray matter volume and BMI. Higher BMI was associated with smaller gray matter volumes in both anterior and posterior cortical regions including several regions of the inferior, orbital, and medial frontal lobes, middle temporal gyrus, inferior parietal cortex, brainstem, a large right posterior region that included the parahippocampal, fusiform, lingual, and occipital gyri, and right posterior cerebellum that was contiguous with this large posterior region.
Table II.
Areas of negative correlations between gray matter volumes and BMI
| Region | Without HT controlled | With HT controlled | ||||||||
|---|---|---|---|---|---|---|---|---|---|---|
| MNI coordinates | t value | Cluster size | MNI coordinates | t value | Cluster size | |||||
| x | y | z | x | y | z | |||||
| L orbital/inferior frontal | −33 | 49 | −8 | 5.03 | 1468 | −33 | 49 | −7 | 4.37 | 235 |
| R inferior frontal | 43 | 35 | −5 | 4.96 | 1879 | 43 | 35 | −5 | 4.68 | 484 |
| L medial frontal | −2 | 44 | 51 | 3.42 | 102 | n.s. | ||||
| R medial frontal | 7 | 44 | 48 | 3.98 | 766 | n.s. | ||||
| L inferior frontal (opercular) | −39 | 24 | 11 | 3.55 | 212 | n.s. | ||||
| L frontal operculum | −46 | −1 | 16 | 3.41 | 851 | n.s. | ||||
| R lateral precentral | 55 | −6 | 20 | 3.23 | 68 | n.s. | ||||
| R precentral | 32 | −11 | 69 | 3.30 | 36 | 31 | −10 | 71 | 3.98 | 39 |
| L middle temporal | −49 | −41 | −16 | 3.02 | 36 | n.s. | ||||
| L precuneus | −9 | −44 | 67 | 3.05 | 28 | n.s. | ||||
| R cuneus | 11 | −78 | 22 | 3.41 | 98 | n.s. | ||||
| R inferior parietal | 56 | −32 | 48 | 3.23 | 88 | n.s. | ||||
| L occipital | −24 | −83 | −6 | 3.61 | 142 | n.s. | ||||
| L lateral occipital | −44 | −83 | 5 | 3.46 | 99 | n.s. | ||||
| R parahippocampal, fusiform, lingual | 27 | −65 | −7 | 5.27 | 13600 | 27 | −65 | −7 | 4.27 | 3107 |
| R posterior cerebellum | 16 | −66 | −32 | 5.13 | 12383 | 16 | −69 | −32 | 4.44 | 724 |
| R lateral cerebellum | 50 | −50 | −32 | 3.86 | 108 | |||||
| L lateral cerebellum | −49 | −47 | −33 | 3.31 | 250 | n.s. | ||||
| Brainstem | −4 | −37 | −52 | 3.22 | 102 | n.s. | ||||
Areas of significant negative correlations between gray matter volume and BMI controlling for age and intracranial vault from two analyses with and without including hypertension (HT) as a covariate in the regression analysis. The coordinates of the location of maximal significance [from Montreal Neurological Institute template (MNI)], the t value, and volume (in mm3) of each cluster are provided. R: right hemisphere; L: left hemisphere.
To determine the extent to which these volume differences were explained by hypertension, we re‐analysed the data including hypertension as an additional control variable. The results of both analyses are depicted in Figure 1A. For this figure, the SPM t‐maps were binarized, with each significant voxel represented as 1 and each non‐significant voxel as 0, and then overlayed. Thus, the maps represent differences in the extent of significantly correlated voxels with and without hypertension as a covariate. In general, fewer regions of gray matter differences remained once hypertension was added as a covariate, and the extent of significant regions decreased. However, significant areas of negative correlation remained in the left orbitofrontal gyrus, the right inferior and precentral frontal cortex, the right posterior cortex extending from the parahippocampal gyrus to the fusiform and lingual gyri, and the right posterior and lateral cerebellar gray matter. Importantly, no region showed a positive correlation between gray matter volume and BMI in either of the two analyses. The correlation between BMI and gray matter volumes of two representative regions (left orbital frontal gyrus, the right posterior cerebellum) are displayed as scatter plots in Figure 2A,B.
Figure 1.
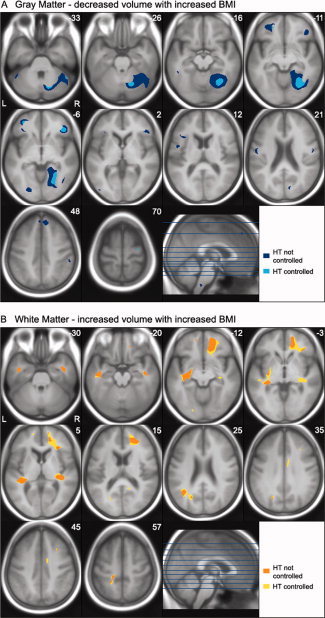
Axial sections depict areas of significant negative correlation between body mass index (BMI) and gray matter volume (A), and areas of positive correlation between BMI and white matter volume (B) controlling for age and intracranial vault. Statistical t‐maps from two regression analyses with and without hypertension (HT) included as a covariate were thresholded at P < 0.05 FDR corrected and transferred into binary images. Binary images of both analyses were superimposed on the study‐specific average T1 template image. The maps represent the extent of significantly correlated voxels with and without hypertension as a covariate. Controlling for hypertension tended to decrease the extent of the gray matter volume negatively correlated with BMI, but increased the extent of regions with positive correlations between white matter volume and BMI. The locations of the axonal sections are indicated on the accompanying sagittal section.
Figure 2.
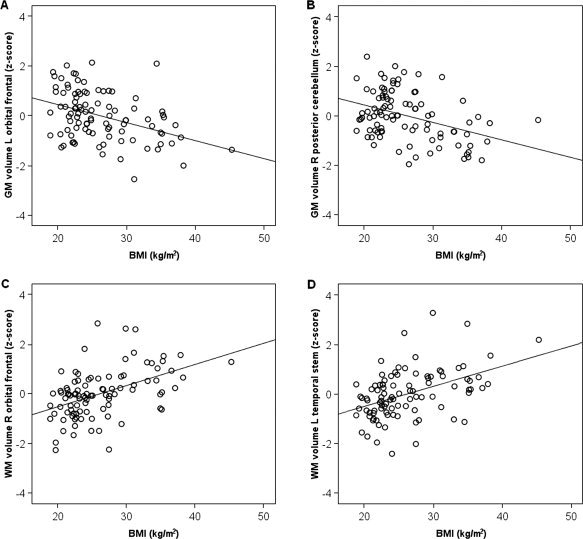
Scatter plots showing the relation between body mass index (BMI) and standardized volumes of (A) the left orbital frontal gray matter (MNI coordinates: −33, 49, −7), (B) the right posterior cerebellar gray matter (16, −69, −32), (C) the right orbital frontal white matter (12, 51, −14), and (D) the left temporal stem white matter (−32, −12, −13). Standardized volumes are adjusted for intracranial volume, age, and hypertension.
In contrast to gray matter, increasing BMI was associated with larger volumes in extensive regions of white matter including frontal, temporal, parietal, and occipital lobes (see Table III). Controlling for hypertension further increased the extent of significant correlation between white matter volume and BMI and also added several regions in the right middle frontal, left superior frontal, right cingulate and left parietal and occipital white matter. The extent of significant correlations with and without hypertension as a covariate are depicted in Figure 1B. No region showed a significant negative correlation between white matter volume and BMI in either analysis. Representative scatter plots showing the positive correlation between BMI and the right orbital frontal white matter and the left temporal stem white matter are depicted in Figure 2C,D.
Table III.
Areas of positive correlations between white matter volume and BMI
| Region | Without HT controlled | With HT controlled | ||||||||
|---|---|---|---|---|---|---|---|---|---|---|
| MNI coordinates | t value | Cluster size | MNI coordinates | t value | Cluster size | |||||
| x | y | z | x | y | z | |||||
| R orbital frontal | 13 | 54 | −14 | 5.58 | 6102 | 12 | 51 | −14 | 5.64 | 12683 |
| R inferior frontal | 35 | 31 | 1 | 3.66 | 392 | |||||
| R superior frontal | 15 | 57 | 12 | 3.06 | 17 | |||||
| R middle frontal | 32 | 18 | 46 | 3.26 | 25 | 31 | 20 | 46 | 3.23 | 34 |
| R middle frontal | n.s. | 31 | 27 | 36 | 3.06 | 27 | ||||
| L orbital frontal | −14 | 53 | −14 | 3.71 | 118 | −14 | 53 | −14 | 3.23 | 177 |
| L superior frontal | n.s. | −16 | 58 | 9 | 3.80 | 115 | ||||
| L temporal stem | −32 | −12 | −13 | 5.03 | 5217 | −32 | −12 | −13 | 5.31 | 6517 |
| R temporal stem | 39 | −1 | −31 | 3.68 | 909 | 39 | −1 | −31 | 3.67 | 933 |
| R superior temporal | 35 | −27 | 6 | 3.51 | 1497 | 35 | −27 | 6 | 3.52 | 2701 |
| R posterior cingulate | n.s. | 22 | −57 | 20 | 3.37 | 298 | ||||
| R cingulate | n.s. | 9 | −6 | 41 | 3.87 | 856 | ||||
| L parietal | −16 | −35 | 59 | 4.05 | 197 | −16 | −35 | 59 | 3.90 | 330 |
| −21 | −43 | 58 | 3.60 | 22 | ||||||
| L parietal/temporal | −39 | −56 | 21 | 3.79 | 727 | −40 | −57 | 23 | 3.97 | 2356 |
| −24 | −69 | 33 | 3.15 | 176 | ||||||
| L parietal (precuneus) | n.s. | −20 | −60 | 52 | 3.25 | 132 | ||||
| L occipital | n.s. | −21 | −82 | −10 | 2.96 | 187 | ||||
Areas of significant positive correlations between white matter volume and BMI controlling for age and intracranial vault from two analyses with and without including hypertension (HT) as a covariate in the regression analysis. The coordinates of the location of maximal significance [from Montreal Neurological Institute (MNI) template], the t value, and volume (in mm3) of each cluster are provided. R: right hemisphere; L: left hemisphere.
The Relationship Between BMI and Neuropsychological Functioning
One‐way ANOVAs of executive function, memory, and visuomotor speed scores indicated that the groups differed on executive function [F(2,92) = 3.1, P < 0.05] but not memory function (F < 1), or visuomotor speed (F < 1). Executive function scores for women in the obese group were significantly lower compared to normal weight females (t = 2.4, P < 0.05). Executive function scores for the overweight group fell midway between the obese and normal weight groups, but did not differ significantly from either group. In spite of the lack of group differences on some of these measures, we hypothesized that the brain volumes obtained from regions that were related to BMI might be better predictors of cognitive function in these three domains. Executive function, memory, and Trails A scores were correlated with the estimates of brain volume from regions identified in the VBM analysis that controlled for hypertension.
For these analyses, estimates of gray and white matter volumes were extracted from significant clusters using MarsBaR a program that is included in the SPM toolkit and used widely for region of interest analyses (http://marsbar.sourceforge.net/). For each cluster observed in the analysis controlling for hypertension, the coordinates of the local maxima (i.e., the voxel with the highest significance value) was used to create a spherical ROI of 2 mm in diameter. The regions of interest were then applied to the smoothed brain images and gray and white matter values were extracted for each participant. The values represent the proportion of gray or white matter within the extracted voxel and are thus considered an estimate of gray or white matter volume [Good et al.,2001].
Values extracted by MarsBaR were then correlated with the executive function, memory, and Trails A scores for all participants using partial correlation that included vocabulary as a covariate. Significant correlations (P < 0.05) for the gray and white matter regions are listed in Table IV. Higher executive functioning was associated with a higher proportion of gray matter in the left orbitofrontal gyrus. Memory function was associated with a higher proportion of gray matter in the lateral cerebellar hemispheres. None of the white matter measures correlated significantly with executive or memory function. Visuomotor speed as assessed by Trails A was also correlated with a higher proportion of gray matter in the right fusiform gyrus and right posterior and lateral cerebellum, as well as a higher proportion of white matter in the left and right temporal stem and right superior temporal white matter.
Table IV.
Significant correlations between gray and white matter volumes and cognitive scores
| Region (MNI coordinates) | Executive | Memory | Trails A | |||
|---|---|---|---|---|---|---|
| ALL | HT− | ALL | HT− | ALL | HT− | |
| Gray matter regions | ||||||
| L orbital frontal (−33, 49, −8) | 0.21 | 0.30 | ||||
| R superior frontal (32, −11, 69) | −0.23 | |||||
| R fusiform (27, −65, −7) | −0.27 | |||||
| R posterior cerebellum (16, −66, −29) | 0.27 | −0.25 | ||||
| R lateral cerebellum (50, −50, −32) | 0.23 | 0.24 | −0.21 | |||
| White matter regions | ||||||
| L superior frontal (−16, 58, 9) | −0.24 | |||||
| L temporal stem (−32, −12, −13) | −0.25 | −0.31 | ||||
| R superior temporal (35, −27, 6) | −0.23 | −0.25 | ||||
| R temporal stem (49, −9, −24) | −0.21 | −0.26 | ||||
Partial correlations (r) were calculated between the proportions of gray or white matter of regions identified in VBM analyses and cognitive scores including executive function, memory, and Trails A scores with vocabulary included as a covariate. Significant correlations (P < 0.05) are presented that include all participants (ALL) and only those participants that do not report hypertension (HT−). R: right hemisphere; L: left hemisphere.
To determine whether hypertension might be accounting for these correlations, we calculated the correlations again including only those individuals without hypertension (n = 72). We chose to exclude hypertense individuals rather than add hypertension as a covariate because of the relatively small number of participants with hypertension (n = 23). The results are also listed in Table IV. In contrast to our expectations, the majority of the correlations were either similar in magnitude or stronger when only normotensive individuals were included in the analyses. The two gray matter regions earlier selected to demonstrate the relationship between BMI and volume were used again to represent the correlation between cognitive scores and the proportion of gray matter. Figure 3A shows the relationship between executive function scores and the standardized residuals of the proportion of left orbitofrontal gray matter after covariating out the effect of vocabulary. Figure 3B shows the relationship between memory function scores and the standardized residuals of the proportion of right posterior cerebellar gray matter after covariating out the effect of vocabulary.
Figure 3.
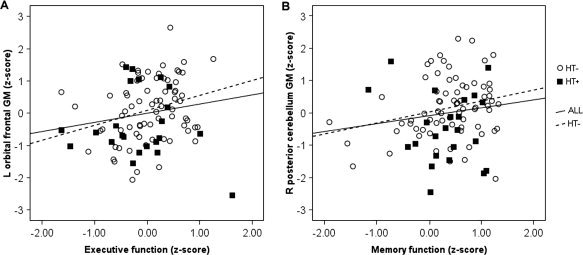
Scatter plots showing the relation between (A) executive function and the standardized residuals of the proportion of left orbital frontal gray matter volume (MNI coordinates: −33, 49, −7) and (B) memory function and standardized residuals of the proportion of gray matter volume of the right posterior cerebellum (16, −69, −32) after controlling for vocabulary. The regression line is displayed for all subjects (ALL), and for those without hypertension (HT–).
DISCUSSION
To summarize, the present study demonstrated a complex association between BMI and alterations in brain volume in a sample of cognitively normal older females, even when an estimate of hypertension was included as a covariate. Higher BMI was associated with smaller volumes in multiple gray matter regions including inferior and orbital frontal cortex (OFC), a large region of right posterior cortex extending from the parahippocampal gyrus to occipital lobe, and the right cerebellum. One of the most striking findings in the present study was the extensive regions of anterior and posterior white matter that were positively correlated with BMI, demonstrating that larger volumes of white matter were associated with higher body weight. On average, executive function scores for obese women were significantly lower than normal weight women. In addition, gray matter volumes in frontal and cerebellar regions that were associated with higher BMI scores predicted executive function, memory function, and a measure of visuospatial speed, while white matter volumes predicted visuomotor speed. Each of these findings will be discussed in more detail below.
BMI, Hypertension, and Gray Matter Volumes
An important aspect of the present study was the inclusion of hypertension as a control variable. After controlling for diagnosed hypertension, volume decreases were observed in two brain regions that have been observed in other studies of BMI [Pannacciulli et al.,2006,2007; Taki et al.,2008], namely OFC and right cerebellum. The prevalence of hypertension increases with body weight and has been shown by itself to result in decreased brain volumes, particularly in prefrontal cortex [Chen et al.,2006; Raz et al.,2003]. Considering hypertension in the present study decreased the extent of gray matter changes associated with higher BMI, but did not account for the relationship completely. It is important to note that self‐reported hypertension represents an underestimate of hypertension. Vargas et al. [1997] and Lima Costa et al. [2004] found sensitivity measures of self‐reported hypertension among women of 77 and 79%, respectively, suggesting that approximately six participants in the present study may have been unaware of their hypertension. Self‐report of hypertension is likely influenced by many factors including access to or utilization of health care, which may lead to the assumption that underreporting might be more likely in obese individuals. However, sensitivity measures of self‐reported hypertension were actually higher for overweight and obese individuals compared to normal weight participants in both studies (for example, Vargas et al. [1997] reported sensitivity rates for BMI < 27.3 of 70 versus 84% for individuals with a BMI ≥ 27.3). Given the large sample size in the present study and that nearly 1/2 of the sample was overweight or obese, it is unlikely that the relationship between BMI and brain volumes observed here was unduly influenced by undiagnosed hypertension. It remains a possibility that having more detailed assessment measures that considered the severity of hypertension and the effectiveness of antihypertensive medication along with the diagnosis of hypertension might increase the amount of variance in gray matter volume loss accounted for by this measure.
A recent fMRI study demonstrated that left OFC responds preferentially to the combination of taste and smell, suggesting that this area might be involved in the multimodal integration of sensory information and the representation of flavor [de Araujo et al.,2003]. OFC is not only involved in the associative representation of flavor but also the rewarding properties of food [Rolls,2000; Small et al.,2007], implicating this region in the regulation of food intake. Additional evidence for the importance of the OFC in eating regulation comes from studies of patients with frontotemporal dementia who commonly show symptoms of hyperphagia, cravings for sweet food, and compulsive overeating. VBM studies have demonstrated that frontotemporal dementia patients with symptoms of disordered eating show decreased gray matter volumes in OFC compared to patients without these symptoms [Whitwell et al.,2007b; Woolley et al.,2007].
Smaller cerebellar volumes associated with higher BMI have been reported in several neuroimaging studies, although the specific region of cerebellum has differed somewhat across studies [Pannacciulli et al.,2006,2007; Taki et al.,2008]. The cerebellum may play a role in regulating food intake via direct and indirect connections between the cerebellum and the hypothalamus [Zhu and Wang,2008]. More specifically, the cerebellum has been related to the response to hunger and satiety through PET studies showing lower regional cerebral blood flow in the cerebellum in response to satiation [Gautier et al.,2000,2001]. These differences were magnified in obese compared to normal weight men, suggesting that body weight may modulate the brain's response to food intake [Gautier et al.,2000].
BMI, Hypertension, and White Matter Volumes
One of the most intriguing findings of the present study was that white matter volumes in both anterior and posterior regions were significantly larger as BMI increased. Interestingly, controlling for hypertension had the opposite effect on the correlations between gray and white matter volumes and BMI. While the extent of gray matter regions correlated with BMI tended to shrink after controlling for hypertension, white matter regions consistently increased in extent. One possible explanation of the results is that BMI and hypertension have separate and competing effects on white matter. Hypertension, regardless of body weight, may have a negative effect on the integrity of white matter that results in volume decreases consistent with Raz et al. [2003], while increasing BMI may offset these volume decreases. The results are consistent with other recent studies with obese younger adults showing larger white matter volume as a function of higher body weight [Haltia et al.,2007; Pannacciulli et al.,2006]. Haltia et al. [2007] hypothesized that increasing body weight may enhance the density of myelin, further supported by the finding that obese adults who dieted showed decreases in white matter volumes.
However, the finding of a positive correlation between BMI and white matter volume is inconsistent with other studies that have suggested that higher body fat may be associated with white matter damage. A study using proton magnetic resonance spectroscopy detected lower concentrations of N‐acetylaspartate in the frontal, temporal, and parietal white matter and lower choline‐containing compounds in the frontal white matter of obese individuals, suggestive of axonal and/or myelin abnormalities [Gazdzinski et al.,2008]. In another study, larger waist‐hip ratios were associated with larger volumes of white matter hyperintensities measured by MRI [Jagust et al.,2005]. In the present study, the amount of white matter hyperintensities included in the VBM analysis of white matter appears to be minimal since regions of frank white matter hyperintensities were excluded from the segmented white matter images. Therefore, it is unlikely that the volume increases associated with higher BMI observed in the present study were confounded by white matter hyperintensities.
Diffusion tensor imaging (DTI) may be helpful in shedding more light on this issue, as it provides measures that are sensitive to the microstructural integrity of white matter. If the higher volume of white matter observed in obese individuals actually reflects increased myelinization, then higher fractional anisotropy should be apparent on DTI. If white matter is damaged in obese individuals, as suggested by Gazdinski et al. [2008], fractional anisotropy should decrease. To date, the only study using DTI comparing obese and normal weight individuals focused solely on gray matter regions, demonstrating increased apparent diffusion coefficients in obese individuals in the hypothalamus, hippocampal gyrus, amygdala, insula, cerebellum, and midbrain [Alkan et al.,2008], all regions previously found to be involved in the control of food intake. Further studies on the relationship between BMI and white matter integrity are warranted.
BMI, Hypertension, and Cognitive Function
Executive function scores were significantly lower for obese women compared to normal weight females, consistent with several previous studies suggesting a link between obesity and deficits in executive functioning [Boeka and Lokken,2008; Gunstad et al.,2007; Volkow et al.,2009]. In addition, our findings suggest that smaller gray matter volume of the left orbital frontal lobe associated with higher BMI was related to poor executive functioning. The result is consistent with a recent PET study reporting that lower baseline prefrontal metabolic activity was associated with higher BMI and lower executive functioning [Volkow et al.,2009].
Gray and white matter regional volumes were also correlated with memory performance and visuomotor speed, even when considering only those older women without hypertension. Regional brain volumes associated with increased BMI were better predictors of cognitive function than BMI itself, likely providing a more direct measure of the functional implications of increased body weight. Memory function was positively correlated with brain volumes in cerebellar regions. Visuomotor speed was positively predicted not only by gray matter volume in cerebellar regions (larger volumes associated with faster visuomotor speed) but also by white matter volume, particularly in the left and right temporal stem and right superior temporal white matter. This is particularly interesting given that individuals with higher BMI showed larger white matter volumes, which would lead to the unlikely conclusion that higher BMI may result in faster visuomotor processing. However, Kuo et al. [2006] also found that higher BMI was associated with faster speed on a visual spatial search task. One hypothesis that warrants further investigation is that the increased density of myelin associated with higher BMI (as suggested by Haltia et al. [2007]) results in nonspecific increases in speeded tasks.
In the present study, we chose to include vocabulary scores rather than years of education as a covariate when assessing the relationship between cognitive scores and brain volumes, as vocabulary provides a better estimate of general cognitive function compared to years of education. Education remains, however, an important variable to be considered in future studies of BMI and brain function. Education correlates with BMI (as evident in the present study) and also with tests of executive function in cognitively normal older adults (for example, see Weintraub et al. [2009]). It remains a possibility that the relationships between brain volumes and cognitive measures observed here, particularly executive function, are driven by a mutual correlation with some third factor (or factors) associated with socioeconomic status, such as access to health care, diet, exercise, or quality of education. Undoubtedly, the relationship between BMI and brain volume is multiply determined, and further careful consideration of health‐related factors including access to quality education is warranted.
While the present results were obtained in a sample of cognitively normal women, Taki et al. [2008] found no relationship between BMI and brain volumes in females; only males showed negative and positive correlations between gray matter volumes and BMI. A possible explanation for the gender differences in Taki et al.'s study as well as the differences between the two studies could be the wide range of ages included in Taki et al. [2008; age range 12–81 years] compared to the present study where only women over age 50 were included. Estrogen levels vary dramatically over the lifespan of women, and this issue is further complicated by the use of estrogen replacements by some women. In older females, variations in estrogen levels have been related to brain volume differences [Boccardi et al.,2006; den Heijer et al.,2003]. For example, den Heijer et al. [2003] reported reduced hippocampal volume with higher levels of endogenous estradiol in females older than 60 years, even when controlling for BMI and age. However, supplemental use of estrogen seems to have opposite effects on brain volume. Extensive regions of larger gray matter volumes in the cerebellum and cerebral cortices were found in postmenopausal females taking estrogens [Boccardi et al.,2006]. Furthermore, endogenous levels of estradiol have been found to increase with BMI [den Heijer et al.,2003] supporting the notion that the relationships between obesity, brain volume, and cognition might be modulated by hormone levels and may result in different patterns of the relationship at different time periods in females and males. Clearly, many questions remain about the interactions between age, estrogen, BMI, and brain volumes and these relationships warrant further investigation.
It is important to note that the present findings do not speak to the issue of whether increased body weight is a cause or a result of structural and functional differences in the brains of obese individuals. Obesity itself, or obesity accompanied by related medical conditions, could result in brain volume changes that in turn lead to poorer cognitive function. Hypertension, cardiovascular disease, diabetes, and obstructive sleep apnea, to name a few, are all factors that are associated with obesity and could potentially impact brain structure and function [Chen et al.,2006; Jongen and Biessels,2008; Morrell and Twigg,2006]. Much larger sample sizes would be needed to consider all these factors in concert. Alternatively, individual differences in brain structure and function due to genetics or other developmental factors may lead to functional differences in brain regions that are critical for controlling food intake, particularly orbital frontal and cerebellar regions. Differences in satiety and food‐related reward signals, perhaps accompanied by relatively poorer executive functions (e.g. impulse control, self‐monitoring, goal‐directed behavior) could affect the ability to control food intake and maintain optimal weight. Longitudinal studies that follow individuals with significant weight gain or loss could provide important information regarding the mechanisms of these differences.
In summary, the present study demonstrated BMI‐related brain volume differences in older women that were associated with differences in cognitive functioning in executive, memory, and visuomotor domains. While the specific mechanisms underlying these volumetric differences remain to be investigated, the study adds to the growing body of research suggesting a negative link between increased body fat and brain functioning in older adults.
Acknowledgements
The project was supported by the Arizona Biomedical Research Commission, the Arizona Alzheimer's Research Consortium (HB 2354, Department of Health Services, Arizona), and the Evelyn F. McKnight Brain Institute. We thank Ms. Kristina Irwin for coordinating and administering neuropsychological testing.
There are no actual or potential conflicts of interest.
REFERENCES
- Alkan A, Sahin I, Keskin L, Cikim AS, Karakas HM, Sigirci A, Erdem G ( 2008): Diffusion‐weighted imaging features of brain in obesity. Magn Reson Imaging 26: 446–450. [DOI] [PubMed] [Google Scholar]
- Ashburner J, Friston KJ ( 2000): Voxel‐based morphometry—The methods. Neuroimage 11: 805–821. [DOI] [PubMed] [Google Scholar]
- Boeka AG, Lokken KL ( 2008): Neuropsychological performance of a clinical sample of extremely obese individuals. Arch Clin Neuropsychol 23: 467–474. [DOI] [PubMed] [Google Scholar]
- Boccardi M, Ghidoni R, Govoni S, Testa C, Benussi L, Bonetti M, Binetti G, Frisoni GB ( 2006): Effects of hormone therapy on brain morphology of healthy postmenopausal women: A voxel‐based morphometry study. Menopause 13: 584–591. [DOI] [PubMed] [Google Scholar]
- Chen X, Wen W, Anstey KJ, Sachdev PS ( 2006): Effects of cerebrovascular risk factors on gray matter volume in adults aged 60–64 years: A voxel‐based morphometric study. Psychiatry Res 147: 105–114. [DOI] [PubMed] [Google Scholar]
- Cournot M, Marquié JC, Ansiau D, Martinaud C, Fonds H, Ferrières J, Ruidavets JB ( 2006): Relation between body mass index and cognitive function in healthy middle‐aged men and women. Neurology 67: 1208–1214. [DOI] [PubMed] [Google Scholar]
- de Araujo IE, Rolls ET, Kringelbach ML, McGlone F, Phillips N ( 2003): Taste‐olfactory convergence, and the representation of the pleasantness of flavour, in the human brain. Eur J Neurosci 18: 2059–2068. [DOI] [PubMed] [Google Scholar]
- Delis DC, Kramer J, Kaplan E, Ober BA ( 1987): The California Verbal Learning Test. San Antonio, TX: Psychological Corporation. [Google Scholar]
- den Heijer T, Geerlings MI, Hofman A, de Jong FH, Launer LJ, Pols HAP, Breteler MMB ( 2003): Higher estrogen levels are not associated with larger hippocampi and better memory performance. Arch Neurol 60: 213–220. [DOI] [PubMed] [Google Scholar]
- Elias MF, Elias PK, Sullivan LM, Wolf PA, D'Agostino RB ( 2003): Lower cognitive function in the presence of obesity and hypertension: The Framingham heart study. Int J Obes Relat Metab Disord 27: 260–268. [DOI] [PubMed] [Google Scholar]
- Firbanks MJ, Wiseman RM, Burton EJ, Saxby BK, O'Brien JT, Ford GA ( 2007): Brain atrophy and white matter hyperintensity change in older adults and relationship to blood pressure. Brain atrophy, WMH change and blood pressure. J Neurol 254: 713–721. [DOI] [PubMed] [Google Scholar]
- Folstein MF, Folstein SE, McHugh PR ( 1975): “Mini‐mental state”. A practical method for grading the cognitive state of patients for the clinician. J Psychiatr Res 12: 189–198. [DOI] [PubMed] [Google Scholar]
- Gautier JF, Chen K, Salbe AD, Bandy D, Pratley RE, Heiman M, Ravussin E, Reiman EM, Tataranni PA ( 2000): Differential brain responses to satiation in obese and lean men. Diabetes 49: 838–846. [DOI] [PubMed] [Google Scholar]
- Gautier JF, Del Parigi A, Chen K, Salbe AD, Bandy D, Pratley RE, Ravussin E, Reiman EM, Tataranni PA ( 2001): Effect of satiation on brain activity in obese and lean women. Obes Res 9: 676–684. [DOI] [PubMed] [Google Scholar]
- Gazdzinski S, Kornak J, Weiner MW, Meyerhoff DJ ( 2008): Body mass index and magnetic resonance markers of brain integrity in adults. Ann Neurol 63: 652–657. [DOI] [PMC free article] [PubMed] [Google Scholar]
- Glisky EL, Kong LL ( 2008): Do young and older adults rely on different processes in source memory tasks? A neuropsychological study. J Exp Psychol Learn Mem Cogn 34: 809–822. [DOI] [PMC free article] [PubMed] [Google Scholar]
- Glisky EL, Rubin SR, Davidson PS ( 2001): Source memory in older adults: An encoding or retrieval problem? J Exp Psychol Learn Mem Cogn 27: 1131–1146. [DOI] [PubMed] [Google Scholar]
- Good CD, Johnsrude IS, Ashburner J, Henson RN, Friston KJ, Frackowiak RS ( 2001): A voxel‐based morphometric study of ageing in 465 normal adult human brains. Neuroimage 14: 21–36. [DOI] [PubMed] [Google Scholar]
- Goodman‐Gruen D, Barrett‐Connor E ( 1996): Sex differences in body fat and body fat distribution in the elderly. Am J Epidemiol 143: 898–906. [DOI] [PubMed] [Google Scholar]
- Gunstad J, Paul RH, Cohen RA, Tate DF, Spitznagel MB, Gordon E ( 2007): Elevated body mass index is associated with executive dysfunction in otherwise healthy adults. Compr Psychiatry 48: 57–61. [DOI] [PubMed] [Google Scholar]
- Gustafson D, Rothenberg E, Blennow K, Steen B, Skoog I ( 2003): An 18‐year follow‐up of body mass index and risk for Alzheimer's disease. Arch Intern Med 163: 1524–1528. [DOI] [PubMed] [Google Scholar]
- Gustafson D, Lissner L, Bengtsson C, Björkelund C, Skoog I ( 2004): A 24‐year follow‐up of body mass index and cerebral atrophy. Neurology 63: 1876–1881. [DOI] [PubMed] [Google Scholar]
- Haltia LT, Viljanen A, Parkkola R, Kemppainen N, Rinne JO, Nuutila P,Kaasinen ( 2007): Brain white matter expansion in human obesity and the recovering effect of dieting. J Clin Endocrinol Metab 92: 3278–3284. [DOI] [PubMed] [Google Scholar]
- Hart RP, Kwentus JA, Wade JB, Taylor JR ( 1988): Modified Wisconsin Card Sorting Test in elderly normal, depressed and demented patients. Clin Neuropsychol 2: 49–56. [Google Scholar]
- Heaton RK, Ryan L, Grant I ( 2009): Demographic influences and use of demographically corrected norms in neuropsychological assessment In: Grant I, Adams KM, editors. Neuropsychological Assessment of Neuropsychiatric and Neuromedical Disorders, 3rd ed New York: Oxford University Press; pp 127–158. [Google Scholar]
- Jagust W, Harvey D, Mungas D, Haan M ( 2005): Central obesity and the aging brain. Arch Neurol 62: 1545–1548. [DOI] [PubMed] [Google Scholar]
- Jongen C, Biessels GJ ( 2008): Structural brain imaging in diabetes: A methodological perspective. Eur J Pharmacol 585: 208–218. [DOI] [PubMed] [Google Scholar]
- Kivipelto M, Ngandu T, Fratiglioni L, Viitanen M, Kåreholt I, Winblad B, Helkala EL, Tuomilehto J, Soininen H, Nissinen A ( 2005): Obesity and vascular risk factors at midlife and the risk of dementia and Alzheimer disease. Arch Neurol 62: 1556–1560. [DOI] [PubMed] [Google Scholar]
- Kopelman PG ( 2000). Obesity as a medical problem. Nature 404: 635–643. [DOI] [PubMed] [Google Scholar]
- Kuo HK, Jones RN, Milberg WP, Tennstedt S, Talbot L, Morris JN, Lipsitz LA ( 2006): Cognitive function in normal‐weight, overweight, and obese older adults: An analysis of the Advanced Cognitive Training for Independent and Vital Elderly cohort. J Am Geriatr Soc 54: 97–103. [DOI] [PMC free article] [PubMed] [Google Scholar]
- Lima‐Costa MF, Peixoto SV, Firmo JO ( 2004): Validity of self‐reported hypertension and its determinants (the Bambuí study). Rev Saude Publica 38: 637–642. [DOI] [PubMed] [Google Scholar]
- Lovejoy JC, Sainsbury A, Stock Conference 2008 Working Group ( 2009): Sex differences in obesity and the regulation of energy homeostasis. Obes Rev 10: 154–167. [DOI] [PubMed] [Google Scholar]
- Morrell MJ, Twigg G ( 2006): Neural consequences of sleep disordered breathing: The role of intermittent hypoxia. Adv Exp Med Biol 588: 75–88. [DOI] [PubMed] [Google Scholar]
- Ogden CL, Carroll MD, Curtin LR, McDowell MA, Tabak CJ, Flegal KM ( 2006): Prevalence of overweight and obesity in the United States, 1999–2004. JAMA 295: 1549–1555. [DOI] [PubMed] [Google Scholar]
- Pannacciulli N, Del Parigi A, Chen K, Le DS, Reiman EM, Tataranni PA ( 2006): Brain abnormalities in human obesity: A voxel‐based morphometric study. Neuroimage 31: 1419–1425. [DOI] [PubMed] [Google Scholar]
- Pannacciulli N, Le DS, Chen K, Reiman EM, Krakoff J ( 2007): Relationships between plasma leptin concentrations and human brain structure: A voxel‐based morphometric study. Neurosci Lett 412: 248–253. [DOI] [PMC free article] [PubMed] [Google Scholar]
- Raz N, Rodrigue KM, Acker JD ( 2003): Hypertension and the brain: Vulnerability of the prefrontal regions and executive functions. Behav Neurosci 117: 1169–1180. [DOI] [PubMed] [Google Scholar]
- Reitan RM ( 1958): The validity of the trail making test as an indicator of organic brain damage. Percept Mot Skills 8: 271–276. [Google Scholar]
- Rolls ET ( 2000): The orbitofrontal cortex and reward. Cereb Cortex 10: 284–294. [DOI] [PubMed] [Google Scholar]
- Rosengren A, Skoog I, Gustafson D, Wilhelmsen L ( 2005): Body mass index, other cardiovascular risk factors, and hospitalization for dementia. Arch Intern Med 165: 321–326. [DOI] [PubMed] [Google Scholar]
- Salerno JA, Murphy DG, Horwitz B, DeCarli C, Haxby JV, Rapoport SI, Schapiro MB ( 1992): Brain atrophy in hypertension. A volumetric magnetic resonance imaging study. Hypertension 20: 340–348. [DOI] [PubMed] [Google Scholar]
- Small DM, Bender G, Veldhuizen MG, Rudenga K, Nachtigal D, Felsted J ( 2007): The role of the human orbitofrontal cortex in taste and flavor processing. Ann N Y Acad Sci 1121: 136–151. [DOI] [PubMed] [Google Scholar]
- Spreen O, Benton AL ( 1977): Neurosensory Center Comprehensive Examination for Aphasia, Revised Edition. Victoria, British Columbia, Canada: University of Victoria Neuropsychology Laboratory. [Google Scholar]
- Stoub TR, Bulgakova M, Leurgans S, Bennett DA, Fleischman D, Turner DA, de Toledo‐Morrell L ( 2005): MRI predictors of risk of incident Alzheimer disease: A longitudinal study. Neurology 64: 1520–1524. [DOI] [PubMed] [Google Scholar]
- Strassburger TL, Lee HC, Daly EM, Szczepanik J, Krasuski JS, Mentis MJ, Salerno JA, DeCarli C, Schapiro MB, Alexander GE ( 1997): Interactive effects of age and hypertension on volumes of brain structures. Stroke 28: 1410–1417. [DOI] [PubMed] [Google Scholar]
- Sturman MT, de Leon CF, Bienias JL, Morris MC, Wilson RS, Evans DA ( 2008): Body mass index and cognitive decline in a biracial community population. Neurology 70: 360–367. [DOI] [PubMed] [Google Scholar]
- Sweat V, Starr V, Bruehl H, Arentoft A, Tirsi A, Javier E, Convit A ( 2008): C‐reactive protein is linked to lower cognitive performance in overweight and obese women. Inflammation 31: 198–207. [DOI] [PMC free article] [PubMed] [Google Scholar]
- Taki Y, Kinomura S, Sato K, Inoue K, Goto R, Okada K, Uchida S, Kawashima R, Fukuda H ( 2008): Relationship between body mass index and gray matter volume in 1,428 healthy individuals. Obesity 16: 119–124. [DOI] [PubMed] [Google Scholar]
- Vargas CM, Burt VL, Gillum RF, Pamuk ER ( 1997): Validity of self‐reported hypertension in the National Health and Nutrition Examination Survey III, 1988–1991. Prev Med 26: 678–685. [DOI] [PubMed] [Google Scholar]
- Volkow ND, Wang GJ, Telang F, Fowler JS, Goldstein RZ, Alia‐Klein N, Logan J, Wong C, Thanos PK, Ma Y, Pradhan K ( 2009): Inverse association between BMI and prefrontal metabolic activity in healthy adults. Obesity 17: 60–65. [DOI] [PMC free article] [PubMed] [Google Scholar]
- Ward MA, Carlsson CM, Trivedi MA, Sager MA, Johnson SC ( 2005): The effect of body mass index on global brain volume in middle‐aged adults: A cross sectional study. BMC Neurol 5: 23. [DOI] [PMC free article] [PubMed] [Google Scholar]
- Wechsler D ( 1981): Wechsler Adult Intelligence Scale—Revised. New York: Psychological Corporation. [Google Scholar]
- Wechsler D ( 1987): Wechsler Memory Scale—Revised. New York: Psychological Corporation. [Google Scholar]
- Wechsler D ( 1997): Wechsler Memory Scale—III. San Antonio, TX: Psychological Corporation. [Google Scholar]
- Wechsler D ( 1999): Wechsler Abbreviated Scale of Intelligence (WASI). San Antonio, TX: Psychological Corporation. [Google Scholar]
- Weintraub S, Salmon D, Mercaldo N, Ferris S, Graff‐Radford NR, Chui H, Cummings J, DeCarli C, Foster NL, Galasko D, Peskind E, Dietrich W, Beekly DL, Kukull WA, Morris JC ( 2009): The Alzheimer's Disease Centers' Uniform Data Set (UDS): The neuropsychologic test battery. Alzheimer Dis Assoc Disord 23: 91–101. [DOI] [PMC free article] [PubMed] [Google Scholar]
- Whitmer RA, Gunderson EP, Barrett‐Connor E ( 2005): Obesity in middle age and future risk of dementia: A 27 year longitudinal population based study. BMJ 330: 1360. [DOI] [PMC free article] [PubMed] [Google Scholar]
- Whitwell JL, Przybelski SA, Weigand SD, Knopman DS, Boeve BF, Petersen RC, Jack CR Jr ( 2007a): 3D maps from multiple MRI illustrate changing atrophy patterns as subjects progress from mild cognitive impairment to Alzheimer's disease. Brain 130: 1777–1786. [DOI] [PMC free article] [PubMed] [Google Scholar]
- Whitwell JL, Sampson EL, Loy CT, Warren JE, Rossor MN, Fox NC, Warren JD ( 2007b): VBM signatures of abnormal eating behaviours in frontotemporal lobar degeneration. Neuroimage 35: 207–213. [DOI] [PubMed] [Google Scholar]
- Wiseman RM, Saxby BK, Burton EJ, Barber R, Ford GA, O'Brien JT ( 2004): Hippocampal atrophy, whole brain volume, and white matter lesions in older hypertensive subjects. Neurology 63: 1892–1897. [DOI] [PubMed] [Google Scholar]
- Wolf PA, Beiser A, Elias MF, Au R, Vasan RS, Seshadri S ( 2007): Relation of obesity to cognitive function: Importance of central obesity and synergistic influence of concomitant hypertension. The Framingham Heart Study. Curr Alzheimer Res 4: 111–116. [DOI] [PubMed] [Google Scholar]
- Woolley JD, Gorno‐Tempini ML, Seeley WW, Rankin K, Lee SS, Matthews BR, Miller BL ( 2007): Binge eating is associated with right orbitofrontal‐insular‐striatal atrophy in frontotemporal dementia. Neurology 69: 1424–1433. [DOI] [PubMed] [Google Scholar]
- Zhu JN, Wang JJ ( 2008): The cerebellum in feeding control: Possible function and mechanism. Cell Mol Neurobiol 28: 469–478. [DOI] [PubMed] [Google Scholar]