

Abstract
The aim of the study was to investigate, with an rTMS/PET protocol, the after‐effects induced by 1‐Hz repetitive transcranial magnetic stimulation (rTMS) in the regional cerebral blood flow (rCBF) of the primary motor cortex (M1) contralateral to that stimulated during a movement. Eighteen healthy subjects underwent a baseline PET scan followed, in randomized order, by a session of Real/Sham low‐frequency (1 Hz) subthreshold rTMS over the right M1 for 23 min. The site of stimulation was fMRI‐guided. After each rTMS session (real or sham), subjects underwent behavioral hand motor tests and four PET scans. During the first two scans, ten subjects (RH group) moved the right hand ipsilateral to the stimulated site and eight subjects (LH group) moved the left contralateral hand. All remained still during the last two scans (rest). Two stroke patients underwent the same protocol with rTMS applied on contralesional M1. Compared with Sham‐rTMS, Real‐rTMS over the right M1 was followed by a significant increase of rCBF during right hand movement in left S1M1, without any significant change in motor performance. The effect lasted less than 1 h. The same rTMS‐induced S1M1 overactivation was observed in the two stroke patients. Commissural connectivity between right dorsal premotor cortex and left M1 after real‐rTMS was observed with a psychophysiological interaction analysis in healthy subjects. No major changes were found for the left hand. These results give further arguments in favor of a plastic commissural connectivity between M1 both in healthy subjects and in stroke patients, and reinforce the potential for therapeutic benefit of low‐frequency rTMS in stroke rehabilitation. Hum Brain Mapp, 2009. © 2008 Wiley‐Liss, Inc.
Keywords: repetitive transcranial magnetic stimulation (rTMS), primary motor cortex (M1), positron emission tomography (PET), transcallosal inhibition, stroke
INTRODUCTION
Each motor cortex in humans exerts inhibitory influences on the opposite motor cortex via transcallosal pathways that are kept in balance under physiological conditions [Ferbert et al.,1992; Gerloff et al.,1998]. These interhemispheric interactions are required for the generation of correct voluntary movements [Nudo,2003]. In healthy subjects, the amount of transcallosal inhibition from the “resting” hemisphere decreases just before onset of a voluntary movement made by the opposite hemisphere [Duque et al.,2005]. The modulation of transcallosal inhibition before a movement of the paretic hand has vanished in patients with subcortical stroke, due to an abnormally high interhemispheric inhibitory drive from M1 of the intact hemisphere to M1 of the lesioned hemisphere in the process of generation of a voluntary movement, and this finding was correlated with poor motor performance [Murase et al.,2004]. Whether this transient hyperexcitability in the unaffected hemisphere has a beneficial or a maladaptive effect on motor recovery of stroke patients remains controversial [Talelli et al.,2006]. Although the role of the contralesional M1 in recovery is still uncertain, two studies have suggested that, in patients with chronic subcortical stroke, its increased activity might be an important causal factor of motor function impairment. Indeed, the inhibition from the nonlesioned to the lesioned hemisphere is more prominent when the patient moves the paretic hand [Duque et al.,2005; Murase et al.,2004]. Recent studies, based on this model of interhemispheric rivalry, have used repetitive transcranial magnetic stimulation (rTMS) as a tool to induce long‐lasting effects on the excitability of the motor cortex and changes in motor performance in healthy subjects and stroke patients.
In healthy subjects, the nature of the after‐effects of rTMS depends on the number, intensity, and frequency of the stimulations. Stimulation at frequencies higher than or equal to 5 Hz tends to increase cortical excitability [Berardelli et al.,1998; Peinemann et al.,2004]. Low‐frequency (1 Hz) rTMS of the motor cortex can reduce corticospinal excitability at the stimulation site for seconds to minutes (depending on the duration of the stimulation) and produces a transient virtual lesion in the targeted cortical region [Chen et al.,1997; Wassermann et al.,1998]. In addition, 1‐Hz rTMS of the motor cortex may also induce changes in the excitability of the contralateral motor cortex (remote effects at distant interconnected sites in the brain) [Plewnia et al.,2003; Schambra et al.,2003; Wassermann,1998], possibly through a reduction of interhemispheric transcallosal inhibition [Gilio et al.,2003; Pal et al.,2005]. Transient improvements in motor performance of the paretic hand ipsilateral to the stimulation (1‐Hz rTMS) have been observed in stroke patients [Fregni et al.,2006; Mansur et al.,2005; Takeuchi et al.,2005] and also in healthy subjects [Kobayashi et al.,2004], encouraging the idea of a therapeutic potential of rTMS in stroke rehabilitation.
The plastic reorganization in the healthy motor system after a single session of 1‐Hz rTMS over M1 was investigated by functional neuroimaging techniques. Most previous neuroimaging studies have focused on the changes in regional cerebral blood flow (rCBF), blood‐oxygen‐level‐dependent (BOLD) signal, or glucose metabolism in resting conditions induced during rTMS, using different frequencies and intensities of stimulation [Bohning et al.,1999; Fox et al.,1997; Paus et al.,1997,1998; Siebner et al.,2001; Speer et al.,2003], or after rTMS [Chouinard et al.,2003].
Our work aimed to explore the neural substrates of low‐frequency rTMS during movement. To that end, PET imaging was used to explore brain synaptic activity. To the best of our knowledge, the side contralateral to the stimulation had never been investigated during movement. Thus, the first aim of our study was to use an rTMS/PET protocol conducted in healthy subjects to investigate post‐rTMS changes in rCBF in the left motor cortex (M1) during a right hand movement versus rest after a single session of subthreshold 1‐Hz‐real‐rTMS (or sham‐rTMS) applied over the right M1. We hypothesized that, if low‐frequency rTMS over the right M1 could induce a virtual transient disruption of interhemispheric transcallosal inhibition as previously suggested by electrophysiological studies, [Gilio et al.,2003; Pal et al.,2005], we should observe an increase of activation in the contralateral M1 during movement. The behavioral effect of 1‐Hz rTMS on hand motor performance just after rTMS was also investigated. To confirm that rTMS was able to modulate interhemispheric connectivity, connectivity analyses (psychophysiological interaction: PPI) were also conducted.
Our second aim concerned rCBF changes under the coil during movement. Post‐rTMS changes in rCBF and effective connectivity during the right hand movement versus rest conditions after subthreshold 1‐Hz rTMS over the left M1 in healthy subjects have been investigated in two studies [Lee et al.,2003; O'shea et al.,2007]. Results were controversial since Lee et al. reported a movement‐related increase at the stimulation site, whereas O'shea et al. reported no such increase during movement of the hand contralateral to the stimulation. This issue needed clarification. Therefore, post‐rTMS changes in rCBF at the site of stimulation (right M1 in the present study) and within areas of the motor network engaged in the left‐hand motor task were explored using an rTMS/PET protocol in healthy subjects. Our hypothesis was that changes, if they existed, must be very subtle and not reproducible from one study to another because of a compensation process in healthy brains.
Our third aim was to check whether movement‐related changes induced by rTMS in healthy subjects could be transferred to patients moving the paretic hand in a pilot experiment conducted in two stroke patients. In this case, the site of stimulation was the contralesional M1.
MATERIALS AND METHODS
Healthy Subjects
Twenty healthy subjects (10 men and 10 women) with no history of neurological or psychiatric diseases were recruited by the clinical investigation center of Toulouse. Ten subjects were assigned to the “right hand” (RH) group (mean age 51.2 ± 9.3 years; range: 41–63 years) for neuroimagery of right hand movement (ipsilateral to the stimulation) and ten were assigned to the “left hand” (LH) group (mean age 51.7 ± 8.2 years; range: 42–65 years) for neuroimagery of left hand movement. Two groups were formed to avoid additive radioactivity in the same subjects. Exclusion criteria were pregnancy, contraindications to MRI and PET‐Scan, and contraindications to TMS [Wassermann,1998]. All the subjects were right‐handed. One subject (LH group) was not included because of claustrophobia in the magnet, and another (LH group) because of electroencephalogram (EEG) abnormalities (asymptomatic spikes on temporal region). All subjects gave their written informed consent before the study. The experimental protocol was approved by our local Institutional Human Studies Committee (CCPPRB Toulouse).
Patients
Two cases were studied. Patient No. 1 was a 62‐year‐old man with a left subcortical ischemic lesion and Patient No. 2 was a 75‐year‐old woman with a right subcortical ischemic lesion. In addition to the neurological examination, the Motricity index [Wade,1982], the Barthel index [Mahoney and Barthel,1965], and the NIHSS [Brott et al.,1989] were performed in the acute phase. The upper limb motor function was assessed on the Fugl Meyer scale [Fugl‐Meyer et al.,1975] at the time of the experiment. The Fugl Meyer scale is an assessment tool that is widely used for upper and lower limb motor function in stroke rehabilitation. Duplex Doppler color‐coded ultrasonography of the supra‐aortic vessels was performed in both cases and did not disclose any significant (>50%) extracranial or intracranial artery stenosis that could have impaired cerebral blood flow. The rTMS/PET protocol was performed 4 weeks after stroke for Patient No. 1 and 6 weeks after for Patient No. 2.
Experimental Protocol
The subjects underwent two sessions, one for a standard 18 channel EEG with activation by hyperventilation and intermittent light stimulation, fMRI examinations and behavioral test familiarization, and another, 1 or 2 weeks later, for the rTMS/PET scan session. EEG was performed in order to exclude subjects or patients at risk for potential rTMS‐induced seizures even though the risk is very low with 1‐Hz stimulation [Rosa et al.,2004]. Real‐ and sham‐rTMS were given outside the PET scanner. Each subject and each patient received both real and sham‐rTMS. The order of intervention (real vs. sham) was counterbalanced across healthy subjects and patients. The duration of the whole rTMS/PET scan session was around 5 h.
Anatomical and fMRI data acquisition
MRI was performed on a 1.5‐T scanner (Siemens Vision, Erlangen, Germany) equipped for echo‐planar imaging (EPI). A 3D high‐resolution T 1‐weighted data set of the whole brain was acquired for each subject (256 × 256 FOV, 190 contiguous 1‐mm‐thick sagittal slices).
The location of the target, that is, the right M1, was derived from a BOLD activation that involved wrist movements (extension) of the left hand contrasted with rest. After the sagittal localization images, sixteen 3‐mm‐thick, axial anatomic fMRI images were obtained (1 slice on AC‐PC and 15 on the motor area).
For the functional MR imaging study, BOLD signal contrast was obtained using a T2‐weighted single‐shot EPI sequence (240 × 240 FOV, 64 × 64 matrix, 3‐mm slice thickness). Eighteen slices were acquired every 3 s for the motor task. One run was recorded for each subject. Before image acquisition, the task was explained to the subject in a preliminary session outside the scanner. Then, they were positioned in the scanner and were instructed to keep their eyes closed for the whole duration of the procedure. Head motion was minimized using foam padding and ear blocks. “Rest” alternated with “Activation” periods. The activation task was the same for all the subjects. It consisted of repeated 1 Hz‐paced active extension‐relaxation of the left wrist. During rest, subjects were instructed to stay motionless. The task paradigm consisted of eight 30‐s epochs alternating between rest and activation.
rTMS intervention
Subjects were seated in a comfortable reclining chair located outside the PET scanner room with their forearm pronated and supported by an armrest. The coil was positioned with the handle at 45° to the sagittal plane. The site of rTMS stimulation was located at the motor hot spot, which was defined by the maximum of right M1 fMRI activation (maximal Z‐score) previously acquired. Magnetic resonance T1 anatomical images were entered into a navigated brain stimulation software, (NBS; Nexstim, Helsinki, Finland) [Ilmoniemi et al.,1999], which optimized the position of the coil at the motor hot spot in real‐time navigation during the time of the intervention. Based on the understanding that TMS preferentially stimulates neurons located in the area where the induced current is strongest [Thielscher and Kammer,2002,2004], NBS displays on a screen the exact location of the coil over the cortical area being stimulated by highlighting the electric field maximum in the cortex and allows online calculation of exact TMS stimulus within 2‐mm accuracy.
rTMS was applied over the right primary motor hand area for both RH and LH groups using a Medtronic MagPro® stimulator (Medtronic Functional Diagnostics, Skovlunde, Denmark). A standard figure‐of‐eight shaped coil (MC‐B70; Medtronic Functional Diagnostics) was used for real‐rTMS. For sham‐rTMS, a specially designed sham coil was used, which provided a comparable acoustic stimulus (Medtronic Functional Diagnostics). The order of intervention (real/sham) was counterbalanced across subjects. One rTMS session (real or sham) consisted of two successive blocks of 11.5‐min duration each, separated by an interval of 1 min. Each block consisted of 10 trains at 1 Hz (600 pulses) of 1‐min duration each with an intertrain interval of 10 s. Subjects received a total of 1,200 biphasic stimuli delivered in 23 min (11.5 × 2) at each session (real or sham). Stimulation intensity was set to 90% of the resting motor threshold (RMT) of the left first dorsal interosseous (FDI) muscle.
The RMT was defined as the lowest stimulus intensity that elicited a motor evoked potential (MEP) of ≥50 μV in at least five twitches out of ten successive stimuli in the FDI muscle.
PET data acquisition and paradigm
Each subject underwent three PET sessions lasting 40 min each: baseline, post‐real‐rTMS, and post‐sham‐rTMS, with a half‐hour pause before the last session. Because activation is always more intense for the first scans, which could have biased the cross‐over design [Loubinoux et al.,2001; Raichle et al.,1994], baseline scans (movement and rest) were carried out before the rTMS sessions, which allowed the subjects to become familiarized with the scanning. Moreover, baseline scans allowed a comparison to be made between healthy subjects and patients. The cross‐over was then made between the post‐real‐rTMS scans and the post‐sham‐rTMS scans. Each one comprised a 2 × 2 factorial design, with two levels per factor: “Intervention” (real‐rTMS vs. sham‐rTMS) and “Task” (movement vs. rest). Because we were more interested in the movement condition and because the after‐effects of a 23‐min‐rTMS stimulation were supposed to be short‐lived [Chen and Seitz,2001; Chen et al.,1997], each session consisted of four consecutive scans with the two conditions always in the same order, (MvtMvtRestRest), to better disclose rTMS‐by‐movement interaction. However, it has been shown in a previous PET study that rCBF after‐effects could last 1 h beyond the stimulation [Lee et al.,2003]. Thus, an rTMS‐by‐rest interaction could be expected despite nonoptimal conditions for rest exploration. “Mvt” (activation) was an extension‐relaxation movement of the right wrist (maximal amplitude of 60°) for the RH group, left wrist for the LH group. The starting position of the wrist was neutral (neither extended nor flexed), the arm was along the body (shoulder neither flexed nor extended). “Rest” was a rest condition during which subjects were instructed to stay still. The number of wrist movements during the “Mvt” condition was counted. For patients, mirror and associated movements were checked visually. Subjects were asked to adopt a 1‐Hz self‐pace after pretraining, which was verified during the experiment.
All post‐rTMS PET scans were acquired during the hour after intervention, with the movement scanning during the first 30 min. Subjects were scanned with eyes closed in a darkened room. The head was immobilized and head position was aligned transaxially to the orbitometeal line with a laser beam and checked before each acquisition. Regional distribution of radioactivity was measured with an ECAT HR+ (Siemens®) PET camera with full volume acquisition (planes 63, thickness 2.4 mm, axial field‐of‐view 158 mm, in plane resolution ≈4.2 mm in all directions, 3D acquisition). The duration of each scan was about 120 s and about 6 mCi of H2O15 was administered to each subject as an intravenous bolus. Stimulation in the experimental conditions was started ≈20 s before data acquisition and continued until scan completion. The interscan interval was ≈8 min.
Behavioral motor study
Healthy subjects were asked to perform a wrist‐tapping task and a wrist‐force task with the dominant and nondominant hands successively just after each rTMS session and before PET scans (see Fig. 1). The wrist extension force was assessed by means of a calibrated dynamometer made in our laboratory, which measures the maximal strength during a tonic isometric wrist extension and expresses it in newtons as previously described [Castel‐Lacanal et al.,2007]. The wrist extension force task consisted of three consecutive trials (intertrial interval 60 s), where the subjects were asked to perform a brief wrist extension at maximal strength for ∼5 s. Three measures were taken at each session for the right and left hands. For the wrist‐tapping test, subjects were asked to press the “space” key of a keyboard as many times as possible within 10 s by exerting a repetitive focal extension movement of the wrist. The test was repeated three consecutive times each for the right and left hands.
Figure 1.
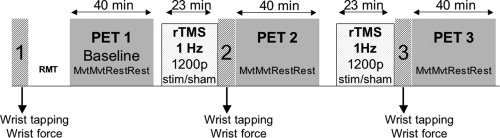
Experimental design for the rTMS/PET/motor behavior protocol.
The two patients performed the Jebsen–Taylor test [Jebsen et al.,1969], at baseline and just after each real‐ or sham‐rTMS session with the nonparetic and paretic hands. The JTT is widely used to assess functional hand motor skills and has a good validity and reliability in stroke rehabilitation [Alon et al.,2003; Kraft et al.,1992]. Six out of the seven items proposed were used here (turning over cards, picking up small objects and placing them in a can, picking up small objects with a teaspoon and placing them in a can, stacking checkers, moving large light cans, and moving heavy cans). This test was chosen, because it was more appropriate to disclose an effect of cortical stimulation on motor behavior in stroke patients [Fregni et al.,2005,2006; Liepert et al.,2007], than the wrist tapping or wrist force. The sum of partial subtest JTT times was recorded for analysis, and results were expressed as a time ratio between the paretic and nonparetic hands.
Healthy subjects and patients were familiarized with each test during the first session (fMRI/EEG/behavioral familiarization).
Image Postprocessing and Statistical Analyses
Functional MR image postprocessing
Image analysis was carried out first with home‐written software (Repikarr) in order to convert images from the Nema to Analyze format and second, using Matlab interactive image display software (Math Works, Natick, MA), and SPM2 (Statistical Parametric Mapping, Wellcome department of cognitive Neurology, London) [Friston and Ashburner,2004]. The first four images of each time series were discarded to eliminate signal intensity variations arising from progressive saturation. Echo‐planar images were realigned to the first functional image of each time series to remove residual head movement and smoothed with a 7‐7‐10‐mm Gaussian filter. Effect of movement was assessed for each subject. Using image analysis (SPM2), data analysis was performed by modeling the movement and rest conditions as reference waveforms (box‐car function).
PET imaging postprocessing
Neuroimaging data were analyzed with SPM2. Images were realigned using the first scan as the reference, and then transformed into the standard space of the Montreal Neurological Institute MRI template. The normalization included linear transformations and deformations based on a nonlinear basis function. The resulting transformation matrix was subsequently used to transform each individual scan. To lessen residual interindividual anatomical and functional differences after spatial normalization, the scans were smoothed with a Gaussian filter of 12‐mm full width at half maximum.
The primary analysis used a general linear model that included 12 covariates modeling the task (movement vs. rest) under each condition of treatment (baseline, real‐rTMS, and sham‐rTMS). This statistical model provided characterization of the main effects of the task (movement vs. rest) after real‐ or sham‐rTMS, and of movement‐by‐rTMS interactions. Comparisons between conditions were analyzed using ANCOVA tests showing the areas activated on average in the subjects. The effect of global differences in cerebral blood flow among scans was removed by treating global activity as a confound and scaling to a nominal grand mean of 50 ml/100 g per minute. The resulting set of voxel values made up a statistical parametric map of the t statistic SPM.
First, the effect of rTMS was assessed on the “rest” condition: [rest]real‐rTMS versus [rest]sham‐rTMS (n = 17, P < 0.001 uncorrected, k = 50). Second, for each group, “main contrasts” (e.g., movement vs. rest) were calculated using a height threshold (T value) > 3.06 [P < 0.05 corrected free discovery rate (FDR)], a cluster extent (k) > 20. On the figures, activations are superimposed on T1 images. Third, for each group, movement‐by‐rTMS interactions, for example, [movement]real‐rTMS versus [movement]sham‐rTMS comparisons, were calculated using k > 50 and P < 0.001 for the height threshold, uncorrected for multiple comparisons, inclusively masked by the main effect of movement [movement‐rest]stim‐rTMSs (P < 0.05) to withdraw deactivated voxels (rest > movement). Covariates of no interest took into account the order of real‐, sham‐rTMS, movement, and rest. Fourth, to compare the results of the LH group with previously published results investigating effects under the coil [Lee et al.,2003], movement‐by‐rTMS interactions were also assessed by [movement‐rest]real‐rTMS versus [movement‐rest]sham‐rTMS. Comparisons were calculated using k > 50 and P < 0.001, uncorrected for multiple comparisons, inclusively masked by the main effect of movement (e.g., [movement‐rest]stim‐rTMSs (P < 0.05)). Finally, effects of time‐by‐rTMS interactions were also assessed: [movement1‐movement2]real‐rTMS versus [movement1‐movement2]sham‐rTMS..
The same comparisons were made for patients.
Comparisons between each patient and the group of healthy subjects were made on motor activation (fixed effect analysis, P < 0.05) and resting rCBF (two sample t test, P < 0.05).
Predicted changes in connectivity were assessed in healthy subjects using the PPI method described by Friston et al. [Friston and Ashburner,2004]. PPI refers to the interaction between physiological activity (movement condition) in the brain and an experimental context (level of rTMS, real or sham). The analysis is constructed to test for differences in the regression slope of activity in all areas, on the activity in the index area under the two stimulations conditions. The PPI, therefore, identifies areas in which the degree of coupling with the index region is modulated significantly by rTMS. For each group, the physiological variable comprised the first eigenvariate of the rCBF signal from a sphere (radius 8 mm) centered on the voxel in the primary motor cortex showing the greatest TMS‐induced increase. SPM was used to test for the PPI (index area, real‐rTMS, and sham‐rTMS as covariates of interest). Any subject‐specific effect was removed. Each group, RH and LH, was tested separately. Movement scans and rest scans were also tested separately to disentangle the effect of movement/rest on rCBF values. The level of significance was set at P < 0.05, FDR corrected (n = 50 voxels).
Behavioral data analysis
For each behavioral test, a four‐way repeated measures ANOVARM was performed with factors HAND (two levels: dominant and nondominant hands), INTERVENTION (three levels: baseline, real‐, or sham‐TMS), and REPETITION (three consecutive trials for each test), with the session order (real‐rTMS or sham‐rTMS first) as independent variable. The threshold for significance was P < 0.05.
RESULTS
One subject of the RH group was discarded from the PET analysis because of artifact movements, but not from the behavior analysis. Neither healthy subjects nor patients reported adverse side effects during the course of the study.
Healthy Subjects
TMS data
For RH and LH groups, mean RMT was 49.8% ± 7.9% (SD) and 54.2% ± 6.2%, respectively and mean stimulus intensity (90% RMT) was 44.8 ± 7.1 (range 38–59%) and 48.8 ± 5.5 (range 40–54%), respectively. The difference of motor threshold between RH and LH groups was not significant, (P = 0.13, Mann–Whitney test).
The mean rTMS target defined by the maximal M1 fMRI activation averaged across subjects (non‐normalized brains) was located at x = 34 ± 4.5; y = −27 ± 4.5; z = 52 ± 4.0. The hotspot reached by the coil with the neuronavigation system was at a mean distance from the fMRI target of 2.1 ± 0.76 mm, and the E‐field at the target was 94 ± 11.2 V/m.
PET imaging data
• Hand‐movement‐related changes in rCBF (task effect in RH and LH groups).
In the RH group, after sham‐rTMS, the effect of movement for main contrast (Mvt—Rest) was associated with increased rCBF in a classical network of areas engaged in right hand movement (P < 0.05 corrected). These included left S1M1, medial premotor cortex (PMC), bilateral thalami, cerebellum, putamen, BA 40‐42, and BA 22. (Table I, Fig. 2).
Table I.
Effect of movement after sham‐rTMS (maxima of regional increases in normalized rCBF during right‐hand movement vs. rest) at (P < 0.05 corrected FDR) for the RH group
| Brain region | MNI Coordinates of peak‐activation {x; y; z} (mm) | Z‐value of peak activation | P‐ FDR corrected | P‐value adjusted for search volume | |
|---|---|---|---|---|---|
| RH group | |||||
| S1M1 (BA 3,4) | Left | −36 −26 56 | 4.10 | 0.001 | <0.001 |
| Medial premotor cortex (BA 6) | Left | −8 −12 58 | 2.65 | 0.050 | 0.004 |
| Cerebellum | Right | 8 −56 −16 | 7.80 | <0.001 | <0.001 |
| Left | −28 −72 −32 | 4.45 | <0.001 | <0.001 | |
| Thalamus | Right | 14 −22 8 | 3.93 | 0.002 | <0.001 |
| Left | −18 −16 12 | 4.90 | <0.001 | <0.001 | |
| Putamen | Right | 28 16 6 | 3.06 | 0.021 | 0.001 |
| Left | −28 −4 8 | 4.51 | <0.001 | <0.001 | |
| Superior temporal gyrus (BA22) | Right | 54 4 2 | 3.74 | 0.003 | <0.001 |
| Inferior parietal cortex (BA 40−42) | Right | 70 −34 16 | 4.74 | <0.001 | <0.001 |
| Left | −48 −32 18 | 3.00 | 0.024 | 0.001 |
Figure 2.
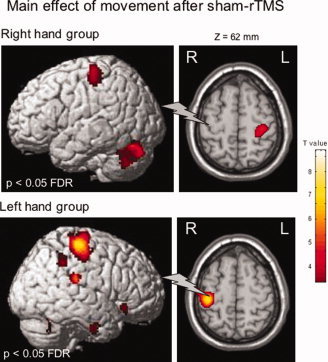
Areas of increased normalized regional cerebral blood flow (rCBF) during movement of the right hand (RH Group) or the left (LH Group) hand after sham‐rTMS. Statistical parametric maps are rendered on the SPM template and statistical threshold of P < 0.05, corrected FDR. The gray flash symbolizes the sham‐rTMS site.
Symmetrical areas of activation were found in the LH group, after sham‐rTMS, (Table II, Fig. 2).
Table II.
Effect of movement after sham‐rTMS (maxima of regional increases in normalized rCBF during left‐hand movement vs. rest) at (P < 0.05 corrected FDR) for the LH group
| Brain region | MNI Coordinates of peak‐activation {x; y; z} (mm) | Z‐value of peak activation | P‐FDR corrected | P‐value adjusted for search volume | |
|---|---|---|---|---|---|
| LH group | |||||
| S1M1(BA 3,4) | Right | 40 −26 58 | 6.44 | <0.001 | <0.001 |
| Medial premotor cortex (BA 6) | Right | 4 −4 48 | 3.11 | 0.036 | 0.001 |
| Cerebellum | Left | −14 −56 −26 | 6.07 | <0.001 | <0.001 |
| Right | 10 −66 −36 | 4.10 | 0.002 | <0.001 | |
| Thalamus | Left | −6 −8 10 | 3.37 | 0.019 | <0.001 |
| Right | 16 −24 −2 | 3.15 | 0.033 | 0.001 | |
| Putamen | Right | 30 −2 0 | 4.49 | 0.001 | <0.001 |
| Superior temporal gyrus (BA22) | Right | 68 −50 12 | 3.28 | 0.024 | 0.001 |
| Inferior parietal cortex (BA 40−42) | Right | 64 −44 42 | 3.92 | 0.004 | <0.001 |
| 66 −30 24 | 3.79 | 0.006 | <0.001 |
• Changes in rCBF induced by real‐rTMS during right hand movement (intervention effect in the RH group)
Significant increases in movement‐induced activation (movement condition) after real‐rTMS versus sham‐rTMS were observed in S1M1 contralateral to the stimulation (located in the cluster found for main effect of movement) (Table III, Fig. 3).
Table III.
Effect of real‐rTMS vs. sham‐rTMS on movement‐related activation (maxima of regional increases/decreases in normalized rCBF during right hand movement) at P < 0.001 uncorrected, k = 50, masked at P < 0.05 by main effect of movement
| Brain region | MNI Coordinates of peak‐activation {x; y; z} (mm) | Z‐value of peak activation | P‐value adjusted for search volume | |
|---|---|---|---|---|
| RH group | ||||
| Increased rCBF | ||||
| S1M1 (BA 3,4) | Left | −34 −24 66 | 3.82 | <0.001 |
| Inferior parietal cortex (BA 40) | Left | −68 −40 32 | 4.58 | <0.001 |
| Inferior parietal cortex (BA 40) | Left | −48 −40 58 | 3.96 | <0.001 |
| dPMC | Right | 26 −14 62 | 3.65 | <0.001 |
| SMA | Right | 20 −14 52 | 4.30 | <0.001 |
| Decreased rCBF | ||||
| Cerebellum (vermis _9) | Right | 6 −56 −32 | 3.93 | <0.001 |
Figure 3.
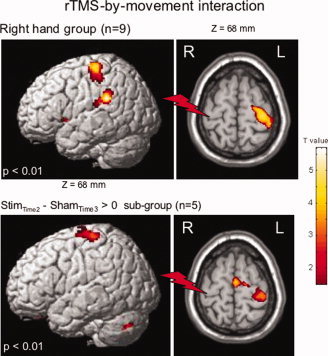
Areas of increased normalized regional cerebral blood flow (rCBF) after real‐rTMS (Effect of real‐rTMS vs. sham‐rTMS on movement‐related activation) during movement of the right hand (RH Group). Same comparison is shown for the subgroup having real‐rTMS first and sham‐rTMS afterward. Statistical parametric maps are rendered on the SPM template and statistical threshold of P < 0.01. The red flash symbolizes the real‐rTMS site.
rTMS‐by‐movement interaction was also studied in the RH subgroup (n = 5) receiving rTMS first and sham second in order to obtain an “approximation” of the duration of the rTMS‐induced after‐effects on rCBF. The same results were found in this subgroup as in the whole RH group (n = 9), that is, an rTMS‐induced increase of rCBF in S1M1 contralateral to the stimulation, indicating that rCBF in contralateral S1M1 is higher in the real‐rTMS condition than in the sham condition. Thus, rTMS after‐effects lasted less than 1 h and vanished before the sham stimulation.
No effect of time was seen on rTMS intervention (no difference of rTMS effect on Mvt1 vs. Mvt2). Thus, rTMS‐effects outlasted the stimulation for at least 30 min.
• Changes in rCBF induced by rTMS during left hand movement (intervention effect in the LH group).
No significant increase in movement‐induced activation (movement condition) after real‐rTMS versus sham‐rTMS were observed. A significant decrease was observed in the left cerebellum_6 (−20 −60 −20, Z = 4.06, P < 0.001) and vermis_6 (−2 −68 −20, Z = 4.22, P < 0.001), [Maldjian et al.,2003,2004; Tzourio‐Mazoyer et al.,2002]. When making the same comparison as a previous study investigating the interaction of rTMS with [movement‐rest] [Lee et al.,2003], we found an increase in task‐specific activation after real‐rTMS versus sham‐rTMS in the right S1M1 under the coil, which was medially displaced in comparison with the site of stimulation, but it was under the significance threshold (x = 28; y = −30; z = 52; Z = 2.75; P = 0.003, 49 voxels at P < 0.01).
• Changes in resting rCBF induced by rTMS (intervention effect in both groups merged, n = 17)
Compared to sham, 1‐Hz rTMS did not induce any rCBF changes beyond the stimulation at rest in the motor network, either at the stimulation site, or at the contralateral site.
• Connectivity in healthy subjects.
Taking areas with an rTMS effect as the index area, no coupling was found with another area in the brain in the LH group for either movement scans or rest scans. For the RH group, taking the left rTMS‐induced overactivated M1 (−34 −24 64) as index area, a different coupling was found between sham and real‐rTMS with the right dorsal PMC (46 −8 64) for movement scans (P = 0.046, FDR corrected) (see Fig. 4). Significance was retested with Statistica® and found at P = 0.0004. No coupling was found for rest scans for the RH group.
Figure 4.
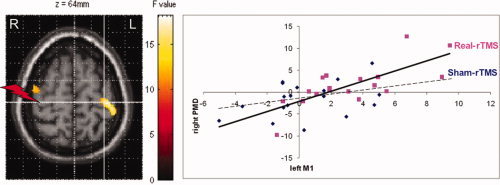
Areas showing a change in connectivity (P = 0.046, FDR corrected). White cross indicates the index area in left M1. Red flash indicates the site of 1‐Hz rTMS. Real‐rTMS induced a coupling between left M1 and right dorsal PMC, whereas no coupling existed after sham‐rTMS. Regression lines have been fitted (real‐rTMS: r = 0.54, P = 0.0005; sham‐rTMS: r = 0.15, P = 0.11, NS).
Methodological issue
As postulated, an order effect was observed for the movement of the dominant hand: the activation in left S1 (−42 −38 62) was 10% more intense at the first examination (baseline right hand movement vs. rest scans) than after sham‐rTMS. No difference was seen whatever the order of the sham examinations (sham as the second or third examination). A very slight order effect was seen in the cerebellum (12 −54 −18), the first activation being 4% less intense than the second and third. This effect was previously observed and interpreted as a habituation effect [Loubinoux et al.,2001]. This effect was not observed for the left hand movement, possibly because movements of the nondominant hand are less automatic. For comparison, the difference between the real‐ and sham‐rTMS‐induced increases in S1M1 was 8%.
Behavioral data
All 18 participants found the motor tasks easy to perform. For the two motor tests (wrist force and wrist tapping), ANOVARM did not disclose any significant effect of the intervention whatever the comparison between baseline, real‐rTMS, and sham‐rTMS, nor any significant effect between the right or left hand, nor any significant effect of the order of the session.
For the left and right hands (n = 18), no change in motor performance was disclosed by the statistical analysis for the Wrist Tapping, [F(2,38) = 0,23, P = 0.79; mean value after sham‐rTMS = 54 ± 8; after real‐rTMS = 54 ± 8], [F(2,38) = 3,6, P = 0.37; mean value after sham‐rTMS = 57 ± 7; after real‐rTMS = 58 ± 8] respectively, or for the hand dynamometer, [F(2,38) = 0,72, P = 0.49; mean value after sham‐rTMS = 52 ± 13; after real‐rTMS = 51 ± 12 N], [F(2,38) = 0,83, P = 0.44; mean value after sham‐rTMS = 55 ± 12; after real‐rTMS = 55 ± 13 N] respectively.
Patient No. 1
In the acute phase after the stroke, Patient No. 1 had a right lower limb predominant hemiparesia with upper limb paresthesias (NIHSS: 2, Barthel index: 100, Motricity index: 100). At the time of the experiment, he partially recovered and had a mild right upper limb sensori‐motor deficit. Except for the deficit, the neurological examination was normal and he did not show any cortical symptoms, aphasia or neglect. The lesion was in the internal capsule and corona radiata, (lesion volume = 1.1 cm3). Score of the upper limb section on the Fugl‐Meyer was 57/66.
TMS data
Stimulation over the contralesional M1 was set at 41% of the stimulator output (90% RMT).
PET imaging data
At baseline, comparing movement‐related activation ofthis patient with the group of healthy subjects, we found a decreased activation of anterior cingulate (−2 1826).
The effect of right hand movement for main contrast (Mvt—Rest) was associated with increased rCBF in the classical network except that S1M1 activation was medially displaced along the central sulcus (x = −14, y = −30, z = 56) in the baseline condition (see Fig. 5). 1‐Hz rTMS did not induce any after‐effects on the rCBF at rest at the stimulation site, nor at the site contralateral to the stimulation. A significant increase in movement‐induced activation (movement condition) after real‐rTMS versus sham‐rTMS was observed in the ipsilesional S1M1, contralateral to the stimulation (x = −24, y = −18, z = 66, Z = 4.35, P < 0.001). The maximum of the cluster returned to the normal position, at the knob site, after real‐rTMS. This normalization was still observed after sham‐rTMS.
Figure 5.
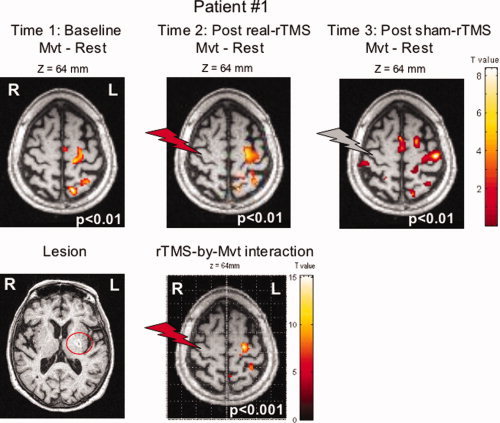
Lesion of Patient No. 1, activation related to the movement of the paretic hand, and rTMS effect during movement at P < 0.001. Statistical parametric maps are rendered on the T1 images of the patient. The red and gray flashes symbolize the real‐ and sham‐rTMS site respectively.
Behavioral data
The time ratio for the Jebsen–Taylor test performed at baseline on the day of the experiment between the impaired and the healthy hand was 1.06. Neither improvement nor worsening was observed for this patient in the Jebsen–Taylor test after real‐rTMS (1.04) compared to sham‐rTMS (1.05).
To disclose any putative decrease in rCBF in ipsilesional M1, scans at baseline and at rest were compared to those of healthy subjects (n = 17). No abnormality (increased or decreased blood flow) was seen in basal rCBF (at rest) in the sensorimotor cortices of this patient.
Patient No. 2
In the acute phase, this patient had a left motor hemiparesis and dysarthria (NIHSS: 2, Barthel index: 95, Motricity index: 92). Six weeks later, at the time of the experiment, she still had a mild pure left upper limb motor deficit without any other neurological symptom. The lesion was in the internal capsule, putamen, and corona radiata (volume = 2.7 cm3). Her score on the upper limb part of the Fugl‐Meyer Motor scale was 58/66.
TMS data
Stimulation over the contralesional M1 was set at 38% of the stimulator output (90% RMT).
PET imaging data
Comparing movement‐related activation of this patient with that of the group of healthy subjects at baseline, we did not find any increased or decreased activation.
The effect of left‐hand movement for main contrast (Mvt—Rest) was associated with increased rCBF in the classical network except that the main activation was on the primary sensory cortex (S1) (x = 44, y = −26, z = 58) in the sham condition (see Fig. 6). Significant increase in movement‐induced activation (movement condition) after real‐rTMS versus sham‐rTMS was observed in ipsilesional S1, contralateral to the stimulation (x = 42, y = −28, z = 60, Z = 3.99, P < 0.001). One‐Hz rTMS also induced an increase in rCBF at rest at the same site contralateral to the stimulation. No increase of rCBF was observed for the comparison [movement‐rest]real‐rTMS versus [movement‐rest]sham‐rTMS, indicating that the rTMS‐induced increase in rCBF was of the same amplitude at rest as under the movement condition. No abnormality (increased or decreased blood flow) was seen in basal rCBF (at rest) in the sensorimotor cortices in this patient compared to the 17 healthy subjects.
Figure 6.
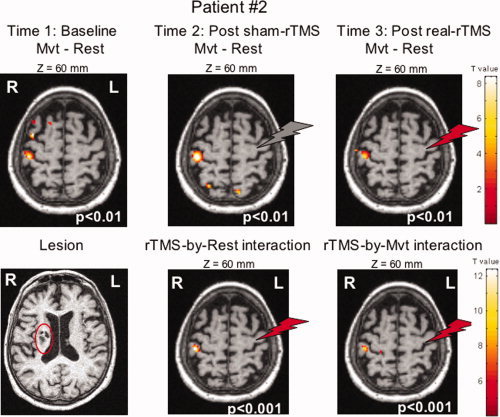
Lesion of Patient No. 2, activation related to the movement of the paretic hand, and rTMS effect during movement at P < 0.001. Statistical parametric maps are rendered on the T1 images of the patient. The red and gray flashes symbolize the real‐ and sham‐rTMS site respectively.
Behavioral data
The time ratio for the Jebsen–Taylor test performed at baseline between the impaired and the healthy hand was 1.75. Neither improvement nor worsening was observed after real‐rTMS (1.39) compared to sham‐rTMS (1.37) in the Jebsen–Taylor test.
DISCUSSION
In agreement with our hypothesis, rTMS intervention induced a rapid remapping of motor activation. One session of real 1‐Hz rTMS over the right M1 in the group of healthy subjects moving the right hand compared to the sham session was followed by an increase in movement‐related rCBF in the contralateral unstimulated left primary sensorimotor cortex, suggesting that the level of interhemispheric inhibition could be modulated for at least 30 min by rTMS intervention in movement conditions. When the subjects moved the left hand, 1‐Hz rTMS over the right M1 was not associated with any major change, either increase or decrease, of right M1 rCBF. rTMS‐induced increase was movement‐specific and was not observed at rest in healthy subjects. Modulation of interhemispheric connectivity by rTMS was confirmed with a PPI analysis and underlined the role of dPMC‐M1 connections. These rCBF changes were not associated with any changes of motor performance, and thus were not confounded by performance‐related effects. Remote effects may reflect compensatory responses to maintain normal function of the motor system. Finally, for the first time, we have demonstrated in two cases that results obtained in healthy subjects can be transferred to stroke patients, whose ipsilesional M1 can be overactivated by the intervention. However, this result needs to be confirmed in a larger population.
Changes in rCBF Induced by rTMS During Rest
Low‐frequency rTMS usually results in a decrease of corticospinal excitability at the stimulated site outlasting the duration of the stimulation (increase in RMT, decrease in MEP amplitude or in input–output curves [Chen et al.,1997; Muellbacher et al.,2000b]. Changes in MEP amplitudes or rest motor threshold after the rTMS session were not investigated here, because this work had been done previously with similar rTMS protocols and because it would have taken too much time and reduced the opportunity of observing any transient short‐lasting rCBF changes beyond the intervention, which was our primary aim.
Previous neuroimaging studies have focused on rCBF changes at the stimulating site during the stimulation and have most often shown an intensity‐dependent rCBF increase at rest and during the intervention [Fox et al.,1997; Siebner et al.,2001; Speer et al.,2003]. Our PET results obtained after the intervention did not show any rCBF changes at rest in healthy subjects.
The absence of any rTMS effect that outlasted the stimulation in right M1 at the site of stimulation and during rest, found here in 17 healthy subjects, is in agreement with the results of Chouinard et al., obtained in a group of 7 subjects [Chouinard et al.,2003]. However, we could not reproduce their results reporting an increase in resting rCBF in the left M1 contralateral to the stimulation site. This discrepancy might arise from the fact that the resting condition was scanned in our study between 30 and 60 min after the end of the intervention. However, using a similar rTMS protocol, Lee et al. reported the presence of rCBF changes that outlasted the intervention for at least 1h [Lee et al.,2003]. Thus, our results are in favor of an absence of after‐effect of low‐frequency rTMS on rCBF at rest.
Changes in rCBF Induced by rTMS During Right Hand Movement
To our knowledge, this is the first study investigating changes in rCBF during movement of the right hand induced after a subthreshold 1‐Hz rTMS session applied over ipsilateral M1 in healthy subjects. Our results demonstrate that a conditioning subthreshold 1‐Hz rTMS applied for 23 min over the right M1 induces large, lasting changes in rCBF within the sensorimotor system, including increased movement‐related rCBF at the site contralateral to the stimulation. Thus, a widespread network is affected by the stimulation of a single site.
Our results were consistent with recent data using near infrared spectroscopy showing a similar rTMS‐induced increase in oxyhemoglobin during movement in unstimulated M1 after 1‐Hz rTMS [Chiang et al.,2007]. TMS‐dedicated neuronavigation combined with previous fMRI localization of M1 activation allowed us to insure that stimulation was applied precisely at the maximum of individual motor activation in M1. rTMS‐induced rCBF increase was observed at the same contralateral z level. The increase in rCBF in left S1M1 contralateral to the stimulation during right hand movement activation after real‐rTMS reinforces the idea that commissural connectivity from the stimulated hemisphere to the unstimulated hemisphere could be modulated during movement by 1‐Hz rTMS, and apparently not during rest. Connectivity analyses confirmed this modulation of interhemispheric connectivity. Interhemispheric connections between dPMC and M1 have been poorly studied during movement. Anatomical connections are known to exist in primates [Boussaoud et al.,2005; Marconi et al.,2003]. As outlined by Mochizuki et al. [2004], dPMC‐M1 interhemispheric effects are thought to be attributable primarily to activity in a transcallosal pathway that leads to changes in the excitability of the M1 hand area. The dPMC can facilitate or suppress movements, plays a role in the selection of movement and in the direction of movements based on sensory information, and is also involved in learning [Koch et al.,2006; Petrides,1985,1997]. The lack of coupling in the sham condition suggests that right dPMC does not play a crucial role in normal conditions for this simple motor task (wrist extension). However, after a “transient virtual lesion” induced by 1‐Hz TMS, compensation entails the exploitation of connected areas in the existing network, and right dPMC in the reorganized network may then play a new role. Our results highlight the possibility of rapid plastic reorganization in the healthy sensorimotor system after a transient alteration of cortical excitability as was previously shown by Lee et al. [2003] using another paradigm. Connectivity analyses also highlight the role of dPMC, which has often been described as a substrate of recovery in stroke patients [Fridman et al.,2004; Johansen‐Berg et al.,2002]. It would be interesting to work with a larger group of patients to confirm whether rTMS over contralesional M1 is able to induce a functional connectivity between contralesional dPMC and ipsilesional M1 in order to compensate the lesion.
The precise mechanisms underlying these changes are unknown, but the results of electrophysiological studies assessing the level of interhemispheric inhibition by means of a paired‐pulse TMS method suggest that the distant excitatory effect observed on the motor cortex contralateral to that stimulated with 1‐Hz rTMS could be due to a reduction of interhemispheric transcallosal inhibition [Gilio et al.,2003; Pal et al.,2005]. Thus, the most plausible explanation for the increase in rCBF found in left M1 after 1‐Hz rTMS applied on right M1 would be that the “virtual lesion” caused by 1‐Hz rTMS induced a lasting decrease in the level of interhemispheric inhibition from the right M1 to the left M1. Excitatory connections between right and left M1 through transcallosal pathways have been described in animal experiments [Asanuma and Okamoto,1959; Matsunami and Hamada,1984] and in humans [Baumer et al.,2006; Ferbert et al.,1992; Hanajima et al.,2001]. In human TMS experiments, M1 transcallosal facilitation can be reliably obtained only under particular conditions (medially antero‐posterior currents), very subthreshold intensities [Reis et al.,2008]. The possibility that the increased movement‐related rCBF in left M1 could be related to the stimulation of excitatory interhemispheric transcallosal pathways can be ruled out, because the direction of the current (posterior–anterior) and the intensity (90% × RMT) and low‐frequency of the magnetic stimulation used here were not the most suitable parameters to induce such facilitation, which was probably overwhelmed by the concomitant interhemispheric inhibition.
If we consider applying low‐frequency rTMS on contralesional M1 in stroke patients, these rTMS‐induced plastic changes could have a beneficial impact on motor recovery where the increased ipsilesional M1 activation is correlated with a better recovery [Loubinoux et al.,2007] and intervention‐related increase in activation is associated with improved motor function [Pariente et al.,2001; Tardy et al.,2006]. Also, disrupting the reaction time with a single pulse TMS on ipsilesional M1 has underlined the key role of this area in the recovery process [Werhahn et al.,2003]. Interhemispheric inhibition from the nonlesioned to the lesioned hemisphere (M1) when a stroke patient moves the paretic hand is abnormally high, and does not change to facilitation around movement onset as it does in healthy volunteers [Duque et al.,2005; Harris‐Love and Cohen,2006; Murase et al.,2004]. Although we did not study the changes of the modulation of interhemispheric inhibition in the process of generation of a voluntary movement in our patients before performing the rTMS intervention, we suggest that the possibility of alleviating interhemispheric inhibition during movement by low‐frequency rTMS in stroke patients is part of the most promising therapeutic potential of this technique.
Changes in rCBF Induced by rTMS in Patients During Paretic Hand Movement
To the best of our knowledge, this is the first demonstration that rCBF changes induced by rTMS obtained in healthy subjects can be transferred to stroke patients. Moreover, the duration of the rCBF changes, which outlasted the single rTMS session, was similar in patients and in healthy subjects, (i.e., less than 1 h). Increase in movement‐related rCBF was observed in the ipsilesional sensorimotor cortex of both patients studied after one session of 1‐Hz rTMS applied to the contralesional M1. However, one patient overactivated the ipsilesional motor cortex whereas the other overactivated the ipsilesional sensory cortex. Sensorimotor activation is likely to be slightly displaced in the recovery phase after stroke because of the disruption of the pyramidal tract below [Tombari et al.,2004]. This could explain why group studies may have had some difficulties in evidencing such an effect [Nowak et al.,2008].
Changes in rCBF Induced by rTMS During Left Hand Movement
A slight increase in task‐specific activation (movement vs. rest) after real‐rTMS versus sham‐rTMS was found in right S1M1, medially displaced in comparison with the site of stimulation, but it did not reach a good level of significance. Previous results reported in the literature are controversial, with an increase in S1M1 rCBF ventrally displayed in a PET study (P = 0.028, small volume correction) [Lee et al.,2003] and no increase in an fMRI study [O'shea et al.,2007]. Our PET experiment leads us to conclude that no major and significant rCBF changes could be evidenced at the site of stimulation.
The lack of significant changes in rCBF at the site of stimulation contrasts with results of electrophysiological studies showing that remote effects of 1‐Hz rTMS over M1 include an increase in the amplitude of the motor‐evoked potential (MEP recruitment curve) in the motor cortex contralateral to the stimulated motor cortex in healthy subjects [Plewnia et al.,2003; Schambra et al.,2003] and contrasts with the increase in rCBF found in contralateral M1. This confirms that, despite the lack of significant rCBF changes at the site of stimulation, rTMS is able to induce long‐lasting cortical excitability changes in the contralateral hemisphere.
Other Remote Effects of 1‐Hz rTMS on rCBF
We have mainly concentrated our discussion on the interhemispheric inhibitory connections between the primary motor cortices and have not addressed the possible effects of 1‐Hz TMS on the motor system in general. However, and unexpectedly, a rTMS‐induced decrease in rCBF was observed in the vermis during both left and right hand tasks, not exactly in the same location (vermis_9 for RH group; and vermis_6 for the LH group). This supports the argument that the stimulation of M1 not only affects contralateral M1 through transcallosal inhibitory pathways, but also affects other regions of the motor network through other pathways that need to be determined. Moreover, a decrease of rCBF was observed in the cerebellum ipsilateral to the moved hand during left hand task. This is in line with an rTMS‐induced inhibitory effect on right M1 and the existence of facilitatory connections between the motor cortex and contralateral cerebellum [Brooks,1986; Sasaki,1979], even though we did not observe an rCBF effect on the right inhibited M1.
Motor Performance
We did not find any significant after‐effect of 1‐Hz rTMS in the healthy subject group whichever of the two motor tests was performed just after the intervention (wrist tapping or wrist force) and whichever the hand tested. There are several possible explanations for the absence of change in motor performance: the tests were too simple and not sensitive enough to detect small changes, or performed too early after the intervention (within 5 min after) or the parameters used for the rTMS intervention were not suitable. In our study, we used a subthreshold (90% RMT) intensity of TMS in order to avoid muscle twitches during rTMS, which could have modulated central processing via sensory afferents. This may not be the most effective paradigm to induce transcallosally mediated effects resulting in measurable changes in motor performance [Talelli et al.,2006].
Two studies report the absence of significant changes in “basic” motor performance after 1‐Hz rTMS performed in healthy subjects either in the hand contralateral to the stimulation [Lee et al.,2003; Muellbacher et al.,2000a] or in the hand ipsilateral to the stimulation [Schambra et al.,2003]. As suggested by Lee et al. [2003] and O'shea et al. [2007], healthy subjects are able to compensate for rTMS‐induced reductions in cortical excitability by using a plastic acute remapping within the motor system, but without a significant effect on motor performance. However, when a more complex sequential key‐pressing task was used, a 10‐min subthreshold 1‐Hz rTMS over M1 in 16 healthy subjects shortened execution time of the motor task with the hand ipsilateral to the stimulation without affecting performance with the contralateral hand [Kobayashi et al.,2004]. Moreover, 1‐Hz rTMS interfered transiently with a motor learning task in healthy subjects (lower performance compared to sham) only when applied ipsilateral to the training hand and had no effect when applied contralaterally [Carey et al.,2006].
In the two acute stroke patients, neither behavioral improvement nor worsening of the paretic side was observed in the Jebsen–Taylor test although some transient motor improvements in the pegboard test, on reaction times, and pinch acceleration have been previously reported in the paretic hand of stroke patients after one session of 1‐Hz rTMS applied on the contralesional M1 [Mansur et al.,2005; Takeuchi et al.,2005]. Was the JTT not sensitive enough, or the stimulation inefficient or not performed in the suitable period of the recovery phase, or were these patients not good candidates for this intervention because they did not overactivate the contralesional M1? A recent study has demonstrated an improvement in the 9 Hole Peg test in 12 very acute stroke patients (7 days poststroke) [Liepert et al.,2007]. Further studies must confirm whether low‐frequency stimulation may be suitable for acute stroke patients or not. Moreover, multisession interventions are more likely to have real therapeutic potential [Boggio et al.,2006; Fregni et al.,2006]. Finally, one can speculate that a behavioral training in the presence of the rCBF effect might be required to consolidate a longer lasting behavioral learning effect.
In conclusion, our pilot study in two patients showed that low‐frequency rTMS had an effect on brain motor activation focused on the unstimulated ipsilesional M1 as demonstrated in healthy subjects. It confirms that the potential therapeutic benefit of low‐frequency rTMS in stroke rehabilitation could be mediated by indirect stimulation of ipsilesional M1 activity.
Acknowledgements
The authors are grateful to the PET center of TOULOUSE (Gérard Viallard), Florent Aubry and the Centre d'Investigation Clinique of Toulouse University Hospital for their assistance.
REFERENCES
- Alon G,Sunnerhagen KS,Geurts AC,Ohry A ( 2003): A home‐based, self‐administered stimulation program to improve selected hand functions of chronic stroke. NeuroRehabilitation 18: 215–225. [PubMed] [Google Scholar]
- Asanuma H,Okamoto K ( 1959): Unitary study on evoked activity of callosal neurons and its effect on pyramidal tract cell activity on cats. Jpn J Physiol 9: 473–483. [DOI] [PubMed] [Google Scholar]
- Baumer T,Bock F,Koch G,Lange R,Rothwell JC,Siebner HR,Munchau A ( 2006): Magnetic stimulation of human premotor or motor cortex produces interhemispheric facilitation through distinct pathways. J Physiol 572 (Part 3): 857–868. [DOI] [PMC free article] [PubMed] [Google Scholar]
- Berardelli A,Inghilleri M,Rothwell JC,Romeo S,Curra A,Gilio F,Modugno N,Manfredi M ( 1998): Facilitation of muscle evoked responses after repetitive cortical stimulation in man. Exp Brain Res 122: 79–84. [DOI] [PubMed] [Google Scholar]
- Boggio PS,Alonso‐Alonso M,Mansur CG,Rigonatti SP,Schlaug G,Pascual‐Leone A,Fregni F ( 2006): Hand function improvement with low‐frequency repetitive transcranial magnetic stimulation of the unaffected hemisphere in a severe case of stroke. Am J Phys Med Rehabil 85: 927–930. [DOI] [PubMed] [Google Scholar]
- Bohning DE,Shastri A,McConnell KA,Nahas Z,Lorberbaum JP,Roberts DR,Teneback C,Vincent DJ,George MS ( 1999): A combined TMS/fMRI study of intensity‐dependent TMS over motor cortex. Biol Psychiatry 45: 385–394. [DOI] [PubMed] [Google Scholar]
- Boussaoud D,Tanne‐Gariepy J,Wannier T,Rouiller EM ( 2005): Callosal connections of dorsal versus ventral premotor areas in the macaque monkey: A multiple retrograde tracing study. BMC Neurosci 6: 67. [DOI] [PMC free article] [PubMed] [Google Scholar]
- Brooks V ( 1986): The cerebellum In: The Neural Basis of Motor Control. Oxford University Press: New York: pp 256–257. [Google Scholar]
- Brott T,Adams HP Jr,Olinger CP,Marler JR,Barsan WG,Biller J,Spilker J,Holleran R,Eberle R,Hertzberg V,Rorick M,Moomaw CJ,Walker M ( 1989): Measurements of acute cerebral infarction: A clinical examination scale. Stroke 20: 864–870. [DOI] [PubMed] [Google Scholar]
- Carey JR,Fregni F,Pascual‐Leone A ( 2006): rTMS combined with motor learning training in healthy subjects. Restor Neurol Neurosci 24: 191–199. [PubMed] [Google Scholar]
- Castel‐Lacanal E,Gerdelat‐Mas A,Marque P,Loubinoux I,Simonetta‐Moreau M ( 2007): Induction of cortical plastic changes in wrist muscles by paired associative stimulation in healthy subjects and post‐stroke patients. Exp Brain Res 180: 113–122. [DOI] [PubMed] [Google Scholar]
- Chen R,Seitz RJ ( 2001): Changing cortical excitability with low‐frequency magnetic stimulation. Neurology 57: 379–380. [DOI] [PubMed] [Google Scholar]
- Chen R,Classen J,Gerloff C,Celnik P,Wassermann EM,Hallett M,Cohen LG ( 1997): Depression of motor cortex excitability by low‐frequency transcranial magnetic stimulation. Neurology 48: 1398–1403. [DOI] [PubMed] [Google Scholar]
- Chiang TC,Vaithianathan T,Leung T,Lavidor M,Walsh V,Delpy DT ( 2007): Elevated haemoglobin levels in the motor cortex following 1 Hz transcranial magnetic stimulation: A preliminary study. Exp Brain Res 181: 555–560. [DOI] [PubMed] [Google Scholar]
- Chouinard PA,Van Der Werf YD,Leonard G,Paus T ( 2003): Modulating neural networks with transcranial magnetic stimulation applied over the dorsal premotor and primary motor cortices. J Neurophysiol 90: 1071–1083. [DOI] [PubMed] [Google Scholar]
- Duque J,Hummel F,Celnik P,Murase N,Mazzocchio R,Cohen LG ( 2005): Transcallosal inhibition in chronic subcortical stroke. Neuroimage 28: 940–946. [DOI] [PubMed] [Google Scholar]
- Ferbert A,Priori A,Rothwell JC,Day BL,Colebatch JG,Marsden CD ( 1992): Interhemispheric inhibition of the human motor cortex. J Physiol 453: 525–546. [DOI] [PMC free article] [PubMed] [Google Scholar]
- Fox P,Ingham R,George MS,Mayberg H,Ingham J,Roby J,Martin C,Jerabek P ( 1997): Imaging human intra‐cerebral connectivity by PET during TMS. Neuroreport 8: 2787–2791. [DOI] [PubMed] [Google Scholar]
- Fregni F,Boggio PS,Mansur CG,Wagner T,Ferreira MJ,Lima MC,Rigonatti SP,Marcolin MA,Freedman SD,Nitsche MA,Pascual‐Leone A ( 2005): Transcranial direct current stimulation of the unaffected hemisphere in stroke patients. Neuroreport 16: 1551–1555. [DOI] [PubMed] [Google Scholar]
- Fregni F,Boggio PS,Valle AC,Rocha RR,Duarte J,Ferreira MJ,Wagner T,Fecteau S,Rigonatti SP,Riberto M,Freedman SD,Pascual‐Leone A ( 2006): A sham‐controlled trial of a 5‐day course of repetitive transcranial magnetic stimulation of the unaffected hemisphere in stroke patients. Stroke 37: 2115–2122. [DOI] [PubMed] [Google Scholar]
- Fridman EA,Hanakawa T,Chung M,Hummel F,Leiguarda RC,Cohen LG ( 2004): Reorganization of the human ipsilesional premotor cortex after stroke. Brain 127 (Part 4): 747–758. [DOI] [PubMed] [Google Scholar]
- Friston KJ,Ashburner J ( 2004): Generative and recognition models for neuroanatomy. Neuroimage 23: 21–24. [DOI] [PubMed] [Google Scholar]
- Fugl‐Meyer AR,Jaasko L,Leyman I,Olsson S,Steglind S ( 1975): The post‐stroke hemiplegic patient. I. A method for evaluation of physical performance. Scand J Rehabil Med 7: 13–31. [PubMed] [Google Scholar]
- Gerloff C,Cohen LG,Floeter MK,Chen R,Corwell B,Hallett M ( 1998): Inhibitory influence of the ipsilateral motor cortex on responses to stimulation of the human cortex and pyramidal tract. J Physiol 510 (Part 1): 249–259. [DOI] [PMC free article] [PubMed] [Google Scholar]
- Gilio F,Rizzo V,Siebner HR,Rothwell JC ( 2003): Effects on the right motor hand‐area excitability produced by low‐frequency rTMS over human contralateral homologous cortex. J Physiol 551(Part 2): 563–573. [DOI] [PMC free article] [PubMed] [Google Scholar]
- Hanajima R,Ugawa Y,Machii K,Mochizuki H,Terao Y,Enomoto H,Furubayashi T,Shiio Y,Uesugi H,Kanazawa I ( 2001): Interhemispheric facilitation of the hand motor area in humans. J Physiol 531 (Part 3): 849–859. [DOI] [PMC free article] [PubMed] [Google Scholar]
- Harris‐Love ML,Cohen LG ( 2006): Noninvasive cortical stimulation in neurorehabilitation: A review. Arch Phys Med Rehabil 87 ( 12 Suppl 2): S84–S93. [DOI] [PubMed] [Google Scholar]
- Ilmoniemi RJ,Ruohonen J,Karhu J ( 1999): Transcranial magnetic stimulation—A new tool for functional imaging of the brain. Crit Rev Biomed Eng 27: 241–284. [PubMed] [Google Scholar]
- Jebsen RH,Taylor N,Trieschmann RB,Trotter MJ,Howard LA ( 1969): An objective and standardized test of hand function. Arch Phys Med Rehabil 50: 311–319. [PubMed] [Google Scholar]
- Johansen‐Berg H,Rushworth MF,Bogdanovic MD,Kischka U,Wimalaratna S,Matthews PM ( 2002): The role of ipsilateral premotor cortex in hand movement after stroke. Proc Natl Acad Sci USA 99: 14518–14523. [DOI] [PMC free article] [PubMed] [Google Scholar]
- Kobayashi M,Hutchinson S,Theoret H,Schlaug G,Pascual‐Leone A ( 2004): Repetitive TMS of the motor cortex improves ipsilateral sequential simple finger movements. Neurology 62: 91–98. [DOI] [PubMed] [Google Scholar]
- Koch G,Franca M,Del Olmo MF,Cheeran B,Milton R,Alvarez Sauco M,Rothwell JC ( 2006): Time course of functional connectivity between dorsal premotor and contralateral motor cortex during movement selection. J Neurosci 26: 7452–7459. [DOI] [PMC free article] [PubMed] [Google Scholar]
- Kraft GH,Fitts SS,Hammond MC ( 1992): Techniques to improve function of the arm and hand in chronic hemiplegia. Arch Phys Med Rehabil 73: 220–227. [PubMed] [Google Scholar]
- Lee L,Siebner HR,Rowe JB,Rizzo V,Rothwell JC,Frackowiak RS,Friston KJ ( 2003): Acute remapping within the motor system induced by low‐frequency repetitive transcranial magnetic stimulation. J Neurosci 23: 5308–5318. [DOI] [PMC free article] [PubMed] [Google Scholar]
- Liepert J,Zittel S,Weiller C ( 2007): Improvement of dexterity by single session low‐frequency repetitive transcranial magnetic stimulation over the contralesional motor cortex in acute stroke: A double‐blind placebo‐controlled crossover trial. Restor Neurol Neurosci 25: 461–465. [PubMed] [Google Scholar]
- Loubinoux I,Carel C,Alary F,Boulanouar K,Viallard G,Manelfe C,Rascol O,Celsis P,Chollet F ( 2001): Within‐session and between‐session reproducibility of cerebral sensorimotor activation: A test–retest effect evidenced with functional magnetic resonance imaging. J Cereb Blood Flow Metab 21: 592–607. [DOI] [PubMed] [Google Scholar]
- Loubinoux I,Dechaumont‐Palacin S,Castel‐Lacanal E,De Boissezon X,Marque P,Pariente J,Albucher JF,Berry I,Chollet F ( 2007): Prognostic value of fMRI in recovery of hand function in subcortical stroke patients. Cereb Cortex 17: 2980–2987. [DOI] [PubMed] [Google Scholar]
- Mahoney FI,Barthel DW ( 1965): Functional evaluation: The Barthel Index. Md State Med J 14: 61–65. [PubMed] [Google Scholar]
- Maldjian JA,Laurienti PJ,Kraft RA,Burdette JH ( 2003): An automated method for neuroanatomic and cytoarchitectonic atlas‐based interrogation of fMRI data sets. Neuroimage 19: 1233–1239. [DOI] [PubMed] [Google Scholar]
- Maldjian JA,Laurienti PJ,Burdette JH ( 2004): Precentral gyrus discrepancy in electronic versions of the Talairach atlas. Neuroimage 21: 450–455. [DOI] [PubMed] [Google Scholar]
- Mansur CG,Fregni F,Boggio PS,Riberto M,Gallucci‐Neto J,Santos CM,Wagner T,Rigonatti SP,Marcolin MA,Pascual‐Leone A ( 2005): A sham stimulation‐controlled trial of rTMS of the unaffected hemisphere in stroke patients. Neurology 64: 1802–1804. [DOI] [PubMed] [Google Scholar]
- Marconi B,Genovesio A,Giannetti S,Molinari M,Caminiti R ( 2003): Callosal connections of dorso‐lateral premotor cortex. Eur J Neurosci 18: 775–788. [DOI] [PubMed] [Google Scholar]
- Matsunami K,Hamada I ( 1984): Effects of stimulation of corpus callosum on precentral neuron activity in the awake monkey. J Neurophysiol 52: 676–691. [DOI] [PubMed] [Google Scholar]
- Mochizuki H,Huang YZ,Rothwell JC ( 2004): Interhemispheric interaction between human dorsal premotor and contralateral primary motor cortex. J Physiol 561 (Part 1): 331–338. [DOI] [PMC free article] [PubMed] [Google Scholar]
- Muellbacher W,Facchini S,Boroojerdi B,Hallett M ( 2000a): Changes in motor cortex excitability during ipsilateral hand muscle activation in humans. Clin Neurophysiol 111: 344–349. [DOI] [PubMed] [Google Scholar]
- Muellbacher W,Ziemann U,Boroojerdi B,Hallett M ( 2000b): Effects of low‐frequency transcranial magnetic stimulation on motor excitability and basic motor behavior. Clin Neurophysiol 111: 1002–1007. [DOI] [PubMed] [Google Scholar]
- Murase N,Duque J,Mazzocchio R,Cohen LG ( 2004): Influence of interhemispheric interactions on motor function in chronic stroke. Ann Neurol 55: 400–409. [DOI] [PubMed] [Google Scholar]
- Nowak DA,Grefkes C,Dafotakis M,Eickhoff S,Kust J,Karbe H,Fink GR ( 2008): Effects of low‐frequency repetitive transcranial magnetic stimulation of the contralesional primary motor cortex on movement kinematics and neural activity in subcortical stroke. Arch Neurol 65: 741–747. [DOI] [PubMed] [Google Scholar]
- Nudo RJ ( 2003): Functional and structural plasticity in motor cortex: Implications for stroke recovery. Phys Med Rehabil Clin N Am 14 ( 1 Suppl): S57–S76. [DOI] [PubMed] [Google Scholar]
- O'shea J,Johansen‐Berg H,Trief D,Gobel S,Rushworth MF ( 2007): Functionally specific reorganization in human premotor cortex. Neuron 54: 479–490. [DOI] [PubMed] [Google Scholar]
- Pal PK,Hanajima R,Gunraj CA,Li JY,Wagle‐Shukla A,Morgante F,Chen R ( 2005): Effect of low‐frequency repetitive transcranial magnetic stimulation on interhemispheric inhibition. J Neurophysiol 94: 1668–1675. [DOI] [PubMed] [Google Scholar]
- Pariente J,Loubinoux I,Carel C,Albucher JF,Leger A,Manelfe C,Rascol O,Chollet F ( 2001): Fluoxetine modulates motor performance and cerebral activation of patients recovering from stroke. Ann Neurol 50: 718–729. [DOI] [PubMed] [Google Scholar]
- Paus T,Jech R,Thompson CJ,Comeau R,Peters T,Evans AC ( 1997): Transcranial magnetic stimulation during positron emission tomography: A new method for studying connectivity of the human cerebral cortex. J Neurosci 17: 3178–3184. [DOI] [PMC free article] [PubMed] [Google Scholar]
- Paus T,Jech R,Thompson CJ,Comeau R,Peters T,Evans AC ( 1998): Dose‐dependent reduction of cerebral blood flow during rapid‐rate transcranial magnetic stimulation of the human sensorimotor cortex. J Neurophysiol 79: 1102–1107. [DOI] [PubMed] [Google Scholar]
- Peinemann A,Reimer B,Loer C,Quartarone A,Munchau A,Conrad B,Siebner HR ( 2004): Long‐lasting increase in corticospinal excitability after 1800 pulses of subthreshold 5 Hz repetitive TMS to the primary motor cortex. Clin Neurophysiol 115: 1519–1526. [DOI] [PubMed] [Google Scholar]
- Petrides M ( 1985): Deficits on conditional associative‐learning tasks after frontal‐ and temporal‐lobe lesions in man. Neuropsychologia 23: 601–614. [DOI] [PubMed] [Google Scholar]
- Petrides M ( 1997): Visuo‐motor conditional associative learning after frontal and temporal lesions in the human brain. Neuropsychologia 35: 989–997. [DOI] [PubMed] [Google Scholar]
- Plewnia C,Lotze M,Gerloff C ( 2003): Disinhibition of the contralateral motor cortex by low‐frequency rTMS. Neuroreport 14: 609–612. [DOI] [PubMed] [Google Scholar]
- Raichle ME,Fiez JA,Videen TO,MacLeod AM,Pardo JV,Fox PT,Petersen SE ( 1994): Practice‐related changes in human brain functional anatomy during nonmotor learning. Cereb Cortex 4: 8–26. [DOI] [PubMed] [Google Scholar]
- Reis J,Swayne OB,Vandermeeren Y,Camus M,Dimyan MA,Harris‐Love M,Perez MA,Ragert P,Rothwell JC,Cohen LG ( 2008): Contribution of transcranial magnetic stimulation to the understanding of cortical mechanisms involved in motor control. J Physiol 586: 325–351. [DOI] [PMC free article] [PubMed] [Google Scholar]
- Rosa MA,Odebrecht M,Rigonatti SP,Marcolin MA ( 2004): [Transcranial magnetic stimulation: Review of accidental seizures]. Rev Bras Psiquiatr 26: 131–134. [DOI] [PubMed] [Google Scholar]
- Sasaki K ( 1979): Cerebro‐cerebellar interconnections in cats and monkeys In: Masion J,Sasaki K, editors. Cerebro‐Cerebellar Interactions. Elsevier; pp 105–124. [Google Scholar]
- Schambra HM,Sawaki L,Cohen LG ( 2003): Modulation of excitability of human motor cortex (M1) by 1 Hz transcranial magnetic stimulation of the contralateral M1. Clin Neurophysiol 114: 130–133. [DOI] [PubMed] [Google Scholar]
- Siebner HR,Takano B,Peinemann A,Schwaiger M,Conrad B,Drzezga A ( 2001): Continuous transcranial magnetic stimulation during positron emission tomography: A suitable tool for imaging regional excitability of the human cortex. Neuroimage 14: 883–890. [DOI] [PubMed] [Google Scholar]
- Speer AM,Willis MW,Herscovitch P,Daube‐Witherspoon M,Shelton JR,Benson BE,Post RM,Wassermann EM ( 2003): Intensity‐dependent regional cerebral blood flow during 1‐Hz repetitive transcranial magnetic stimulation (rTMS) in healthy volunteers studied with H215O positron emission tomography. I. Effects of primary motor cortex rTMS. Biol Psychiatry 54: 818–825. [DOI] [PubMed] [Google Scholar]
- Takeuchi N,Chuma T,Matsuo Y,Watanabe I,Ikoma K ( 2005): Repetitive transcranial magnetic stimulation of contralesional primary motor cortex improves hand function after stroke. Stroke 36: 2681–2686. [DOI] [PubMed] [Google Scholar]
- Talelli P,Greenwood RJ,Rothwell JC ( 2006): Arm function after stroke: Neurophysiological correlates and recovery mechanisms assessed by transcranial magnetic stimulation. Clin Neurophysiol 117: 1641–1659. [DOI] [PubMed] [Google Scholar]
- Tardy J,Pariente J,Leger A,Dechaumont‐Palacin S,Gerdelat A,Guiraud V,Conchou F,Albucher JF,Marque P,Franceries X,Cognard C,Rascol O,Chollet F,Loubinoux I ( 2006): Methylphenidate modulates cerebral post‐stroke reorganization. Neuroimage 33: 913–922. [DOI] [PubMed] [Google Scholar]
- Thielscher A,Kammer T ( 2002): Linking physics with physiology in TMS: A sphere field model to determine the cortical stimulation site in TMS. Neuroimage 17: 1117–1130. [DOI] [PubMed] [Google Scholar]
- Thielscher A,Kammer T ( 2004): Electric field properties of two commercial figure‐8 coils in TMS: Calculation of focality and efficiency. Clin Neurophysiol 115: 1697–1708. [DOI] [PubMed] [Google Scholar]
- Tombari D,Loubinoux I,Pariente J,Gerdelat A,Albucher JF,Tardy J,Cassol E,Chollet F ( 2004): A longitudinal fMRI study: In recovering and then in clinically stable sub‐cortical stroke patients. Neuroimage 23: 827–839. [DOI] [PubMed] [Google Scholar]
- Tzourio‐Mazoyer N,Landeau B,Papathanassiou D,Crivello F,Etard O,Delcroix N,Mazoyer B,Joliot M ( 2002): Automated anatomical labeling of activations in SPM using a macroscopic anatomical parcellation of the MNI MRI single‐subject brain. Neuroimage 15: 273–289. [DOI] [PubMed] [Google Scholar]
- Wade DT ( 1982): Measurement in Neurological Rehabilitation. London: Oxford Medical Publications. [Google Scholar]
- Wassermann EM ( 1998): Risk and safety of repetitive transcranial magnetic stimulation: Report and suggested guidelines from the International Workshop on the Safety of Repetitive Transcranial Magnetic Stimulation, June 5–7, 1996. Electroencephalogr Clin Neurophysiol 108: 1–16. [DOI] [PubMed] [Google Scholar]
- Wassermann EM,Wedegaertner FR,Ziemann U,George MS,Chen R ( 1998): Crossed reduction of human motor cortex excitability by 1‐Hz transcranial magnetic stimulation. Neurosci Lett 250: 141–144. [DOI] [PubMed] [Google Scholar]
- Werhahn KJ,Conforto AB,Kadom N,Hallett M,Cohen LG ( 2003): Contribution of the ipsilateral motor cortex to recovery after chronic stroke. Ann Neurol 54: 464–472. [DOI] [PubMed] [Google Scholar]