Abstract
Despite rapidly increasing interests in specific contributions of different components of human medial temporal lobe (MTL) to memory and memory impairments in normal aging and in many abnormal conditions such as Alzheimer's disease and Pick's disease, few modern neuroanatomical studies are available about the borders, extent, and topography of human perirhinal areas 35 and 36, which are important components of the MTL memory system. By a combined use of several cellular, neurochemical, and pathological markers, which mainly include neuronal nuclear antigen, calcium‐binding proteins (parvalbumin and calbindin‐D28k), nonphosphorylated neurofilament protein (SMI‐32), Wisteria floribunda agglutinin, and abnormally phosphorylated tau (AT8), this study has revealed that the borders of human perirhinal areas 35 and 36 are significantly different from those defined with conventional Nissl staining. In general, areas 35 and 36 occupy the ventromedial temporopolar and rhinal sulcal regions, the collateral sulcal region, and the anterior two‐thirds of fusiform gyrus or occipitotemporal gyrus. Furthermore, the precise borders, extent, and topography of human areas 35 and 36 and adjoining entorhinal cortex were marked at different anteroposterior levels of the MTL with reference to variations of rhinal and collateral sulci and other useful landmarks. These findings would provide reliable neuroanatomical base for the great and yet rapidly increasing number of neuroimaging studies of the human MTL structures in healthy and many abnormal conditions. Hum Brain Mapp, 2010. © 2010 Wiley‐Liss, Inc.
Keywords: medial temporal lobe, entorhinal cortex, parahippocampal gyrus, perirhinal cortex, fusiform gyrus, Tau pathology, calcium‐binding proteins, collateral sulcus, aging brain, cortical mapping
INTRODUCTION
The perirhinal cortex or area 35 was assigned by Brodmann [1909] a century ago to cortex “near” the so‐called rhinal sulcus (RS) which he viewed as a transitional zone between the entorhinal cortex (EC) medially and the ectorhinal cortex (area 36) laterally. In modern literature, especially in neuropsychological and neuroimaging studies, however, the perirhinal cortex (PC) has often included both areas 35 and 36. Although recognized as a neuroanatomical entity in many mammals, the PC received little notice for seven decades until shown by Jones and Powell [1970] that it forms a convergence zone for cortical sensory association inputs. Van Hoesen et al. extended these observations by demonstrating additional inputs from multimodal areas and the important fact that perirhinal output was directed strongly to the EC and also to the subiculum/CA1 zones of the hippocampal formation [Van Hoesen,1982; Van Hoesen and Pandya,1975a,b; Van Hoesen et al.,1972,1975].
The PC (including areas 35 and 36) is an important component of the medial temporal memory system. Many previous studies of both nonhuman primates and human have shown that PC plays a critical role in declarative memory and may also involve visual perception [Buckley,2005; Lee et al.,2005; Murray et al.,2005; Squire et al.,2004,2007]. Neuropathological studies have revealed that PC and its interconnected neural systems are involved in Alzheimer's disease (AD), Pick's disease, Down's syndrome, Parkinson's disease, progressive supranuclear palsy, dementia with argyrophilic grains, Huntington's disease, and schizophrenia [Arnold,2000; Braak and Braak,1992; Davis et al.,1999; Davies et al.,2004; Gomez‐Isla et al.,1996; Hyman et al.,1984; Kordower et al.,2001; Mitchell et al.,2002; Van Hoesen et al.,1986]. In fact, PC is targeted first in AD and aging, and it may be the locus for preclinical changes seen in normal aging humans [Arnold et al.,1991; Braak and Braak,1991,1992; Ding et al.,2009]. Magnetic resonance volumetric studies in the AD, frontotemporal dementia, and temporal lobe epilepsy suggest that PC as well as the EC and neighboring hippocampal structures are among the first to show atrophy [Bernasconi et al.,2000; Bobinski et al.,1999; Chan et al.,2001; Davies et al.,2004; De Toledo‐Morrell et al.,2000; Jutila et al.,2001; Killiany et al.,2000,2002; Turetsky et al.,2003] and that more precise borders are needed to precisely evaluate the volume of these cortices [Bonilha et al.,2004; Davies et al.,2004; Gold and Squire,2005; Kirwan and Stark,2004; Pihlajamaki et al.,2003,2004; Pruessner et al.,2002; Squire et al.,2004; Strange et al.,2002]. Given the important functions of the PC and the urgent need of the precise borders of the PC and adjoining cortices in human studies, it is important to expand our understanding of the organization, precise borders, extent, and topography of the human PC.
Abbreviations
- 35, 36
temporal areas 35 and 36 based on Brodmann [1909]
- ACF
anterior calcarine fissure
- AD
Alzheimer's disease
- AI
primary auditory cortex
- Am
amygdala
- AT8
abnormally phosphorylated tau
- CA1–3
subfields 1–3 of the hippocampus
- CB
calbindin D‐28k
- CS
collateral sulcus
- CSa
collateral sulcus, anterior segment
- CSp
collateral sulcus, posterior segment
- DG
dentate gyrus
- EC
Entorhinal cortex
- FG
fusiform gyrus
- GI
Gyrus intralimbicus
- GP
Globus pallidus
- H
hippocampus
- HF
hippocampal fissure
- In
Insuala
- ITG
inferior temporal gyrus
- ITS
inferior temporal sulcus
- LF
lateral fissure
- LGN
lateral geniculate nucleus
- LI
limen insula
- LV
lateral ventricle
- MTG
middle temporal gyrus
- MTL
medial temporal lobe
- NeuN
neuronal nuclear antigen or neuronal nuclei
- NFT
neurofibrillary tangle
- OTG
occipitotemporal gyrus
- OTS
occipitotemporal sulcus
- PAC
periamygdaloid cortex
- PACo
a special subarea of the PAC
- PaS
parasubiculum
- PC
perirhinal cortex
- PHG
parahippocampal gyrus
- Pir
piriform cortex
- PPHG
posterior parahippocampal gyrus
- PrS
presubiculum
- psm, psl
medial and lateral temporopolar sulci
- Pu
putamen
- PV
parvalbumin
- RS
rhinal sulcus
- S
subiculum
- SMI‐32
nonphosphorylated neurofilament protein
- SS
semiannular sulcus
- STG
superior temporal gyrus
- STS
superior temporal sulcus
- TE, TH, TF
temporal areas TE, TH, and TF, based on Von Economo [1929]
- TEv, TEd
ventral and dorsal portion of area TE
- TFm, TFl
medial and lateral subdivisions of area TF
- TG
temporopolar area TG, based on Ding et al. [2009]
- TI
temporal insular area, based on Ding et al. [2009]
- TL
temporal area TL, based on Blatt et al. [2003]
- TPC
temporopolar cortex
- TPUJ
temporopolar uncal junction
- U
uncus
- WFA
Wisteria floribunda agglutinin
Previous human studies mainly on Nissl preparations revealed inconsistent borders and topography of human PC [Brodmann,1909; Insausti et al.,1998a,b; Sarkissov et al.,1955; Von Economo,1929; Von Economo and Koskinas,1925]. However, our recent studies have shown that consistent borders can be determined by means of a combined use of different markers on adjacent sequential sections [Ding et al.,2003,2009]. Using this strategy, we have successfully parcellated the complex human temporal polar cortex (TPC) [Ding et al.,2009]. In our study we aim to define precise borders, extent, and topography of the human PC (areas 35 and 36) using the same strategy, to provide a modern neuroanatomical basis for the designation of more precise measure of the medial temporal lobe (MTL) structures.
MATERIALS AND METHODS
Selection, Processing, and Staining of Human Specimens
Human specimens used in this study were donated to the Deeded Body Program at the University of Iowa. Procurement of autopsy tissue was carried out in accordance with the University of Iowa's human study guidelines. A total of 130 hemispheres from 90 brains were examined for sulcal patterns of the RS and collateral sulcus (CS), which are closely associated with the location of human areas 35 and 36. For a combined analysis of different neurochemical markers to determine the borders, extent, and topography of areas 35 and 36, 18 brains with postmortem times before fixation ranging from 3 to 6 h were used in this study, and among these 15 cases (temporal polar regions) were used recently for mapping the TPC [Ding et al.,2009] and three are new additions. All these brains were divided into three groups based on the criteria described recently [Ding et al.,2009]. Briefly, six normal specimens were from subjects at ages 65–81 without any history of neurological or psychiatric illness and with no or few neurofibrillary tangles (NFTs) and amyloid plaques in medial temporal cortex in our routine Thioflavin‐S staining; seven normal aging specimens were from subjects without a clinical neurological history but with brain NFTs at Braak's stages I–IV and five AD specimens from subjects with apparent clinical dementia and with brain NFTs at Braak's stages V and VI (see Braak and Braak,1992]. The brains were placed in 0.1 M phosphate‐buffered saline (PBS; pH 7.3) for a quick rinse after removal and then the temporal lobe blocks were dissected and fixed by immersion in 4% paraformaldehyde in PBS for 48 h at 4°C. The blocks were transferred to a 30% sucrose/PBS solution at 4°C for 48–36 h. All blocks were frozen and sectioned at 50 μm on a sliding microtome and collected in an ordered series of 10. The first four sets of sections were stained with Thionin or myelin, Thioflavin‐S, acetylcholinesterase, and Wisteria floribunda agglutinin (WFA) histochemistry, respectively. One set was stored for possible future use, and the remaining five sets of sections were stained immunohistochemically with the following primary antibodies and dilutions: parvalbumin (PV, 1:10,000; Swant, Bellinzona, Switzerland), calbindin‐D28k (CB, 1:10,000, Swant), nonphosphorylated neurofilament protein (SMI‐32, 1: 5,000; Sternberger Monoclonal, Baltimore, MD), neuronal nuclear antigen or neuronal nuclei (NeuN, 1:1,500; Chemicon, Temecula, CA), and abnormally phosphorylated tau (AT8, 1:1,000; Innogenetics, Ghent, Belgium), as detailed exactly in our recent report [Ding et al.,2009].
Nomenclature of Human PC and Adjoining Cortices
In this study, anterior MTL structures were named mainly based on Brodmann [1909]. Thus area 35 indicates Brodmann's PC, area 36 means Brodmann's ectorhinal cortex, and the EC includes both Brodmann's area 34 (the region roughly corresponding to gyrus ambiens) and area 28. However, the area lateral to area 36 was named area TE based on our detailed study [Ding et al.,2009] and Von Economo's work [1929]. The posterior MTL region was subdivided into three areas and termed, respectively, as areas TH, TL/TFm, and TF/TFl mediolaterally, corresponding to agranular, dysgranular, and granular regions, respectively, of the so‐called posterior parahippocampal region. These combinational terms were adopted based on cytoarchitectonic description of human MTL (areas THa, TH, and TF by Von Economo [1929]) and modern neuroanatomical description of nonhuman primates (areas TH, TF2, and TF1 by Tranel et al. [1988]; areas TH, TL, and TF by Blatt and Rosene [1998] and Blatt et al. [2003]; areas TH, TFm, and TFl by Suziki and Amaral [2003]). In addition, although both the EC and area 36 are composed of six layers, these layers are not correspondent in these two types of cortex. To avoid confusion, the cortical layers in the EC were named in Arabic numerals with the lamina dissecans named as layer 4. In contrast, the cortical layers in areas 35 and 36 were named in Roman numerals. It should be pointed out that the border between area 35 and the EC was placed obliquely because layers 3 and 5 of the EC extended into the deep part of the medial area 35 in human brains. However, a thin and small portion of layers 3 and 5 from the EC sandwiched between layers IIIu and V of area 35a was included as part of area 35a (for details, see Result section). Finally, RS was defined as the sulcus passing through the temporopolar‐uncal junction (TPUJ; indicated by arrowheads in Fig. 1A,B) and extending posterolaterally toward the anterior CS, which is the one located lateral to the parahippocampal gyrus (PHG). The sulcus lateral to the CS was labeled occipitotemporal sulcus (OTS) and the gyrus between the CS and OTS was labeled fusiform gyrus/occipitotemporal gyrus (FG/OTG). More laterally, the sulcus lateral to the OTS was termed inferior temporal sulcus (ITS) and the gyrus located between the OTS and ITS was named inferior temporal gyrus (ITG).
Figure 1.
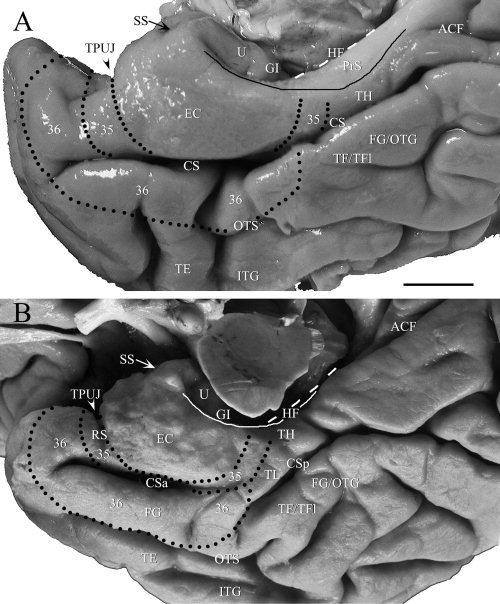
Photographs of the MTL from two brains show some landmarks and the two basic sulcal patterns of the CS, which is the medial border of the FG/OTG. Dotted lines outline the locations and extent of areas 35 and 36 on the cortical surface. The dashed line shows the long axis of the HF, which can be used with the TPUJ to define the border between the anterior portion of the EC and area 35 when RS does not exist (see text for detail). The solid line marks the proximate border of the PrS with PaS (note the variation of location of the PrS in A and B). (A) One MTL with no RS and a long CS (Type I CS). The shiny and white appearance (due to thick myelinated axons in layer I) on the medial surface of the PPHG indicates the approximate location of the PrS. Area TL/TFm is not seen on the surface of the PPHG because it is hidden in the medial bank of the posterior CS. (B) Another MTL with a deep RS and an interrupted CS (Type II CS). In this case, an anterior (CSa) and a posterior (CSp) segment of the CS were separated by a small cortical bulge. Part of area TL/TFm (TL) is seen on the surface of the PPHG in this case. For abbreviations, see list. Scale bar: 1 cm.
RESULTS
Sulcal Patterns of the RS and CS in Human MTL
As human PC is mainly located in and around the rhinal and collateral sulci, this study examined the sucal patterns of these two sulci in 130 hemispheres from 90 brains (only one hemisphere available for examination for some brains). As for the RS, 34% of hemispheres have no RS, 43% have shallow RS, and only 23% have deep RS. As for the CS, we found that two sulcal patterns of the CS are of high frequencies. The first pattern (Type I) is a long CS which extends from the posterior TPC region to ventral occipital region without interruption (45%; e.g., Fig. 1A) and is always deep. The second pattern (Type II) is a discontinuous CS which has an anterior segment (CSa) and a posterior segment (CSp) separated by a small bridge of cortex (52%; e.g., Fig. 1B). Other sulcal patterns of the CS only account for 3% of the hemispheres examined in this study. Within the second group, two subgroups were noted. The first subgroup has a longer CSa, which often extended posteriorly to the level of gyrus intralimbicus (GI; Type IIa), and the second has a shorter CSa, which extended for a short distance (Type IIb) and ended much more anteriorly than Type IIa. In both Types IIa and IIb, the CSp is usually longer and deeper than the CSa although CSp itself could be shorter (e.g., Fig. 1B) or longer. The longer CSp usually extended anterioventrally to locate laterally to the posterior portion of the CSa. In some cases, the RS merges with the anterior portion of the CS, which is usually deeper than the RS. Another interesting finding is that the depth of the laterally located OTS is often related to that of the CS (Figs. 2 and 3). Specifically, when the CS is deeper, the OTS is usually shallower, and when the CS is shallower, the OTS is usually deeper. When depth of the CS is moderate, depth of OTS is also moderate, i.e., the depths of both CS and OTS are similar.
Figure 2.
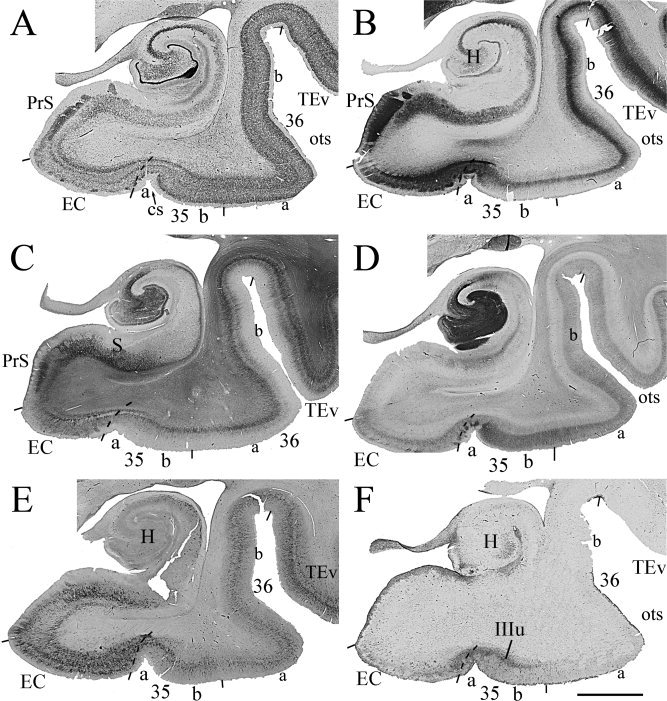
Photomicrographs of six adjacent coronal sections through the GI from a normal case and stained for NeuN (A), PV (B), SMI‐32 (C), CB (D), WFA (E), and AT8 (F) show general features of areas 35 and 36 as well as adjoining regions as seen in sections stained with these markers. It is much easier to define the borders using a combination of different markers. Area 35 can be subdivided into 35a (a) which merges with the EC, and 35b (b) which merges with area 36. Note that some changes in staining intensity and density exist mediolaterally within area 36 (36a vs. 36b), but the borders of area 36 can be confidently placed on the base of multiple stainings. Note also some tau lesion labeled with AT8 was mainly found in layer IIIu (IIIu) of area 35 and less in the EC (F) in this normal case. For abbreviations, see list. Scale bar: 0.5 cm.
Figure 3.
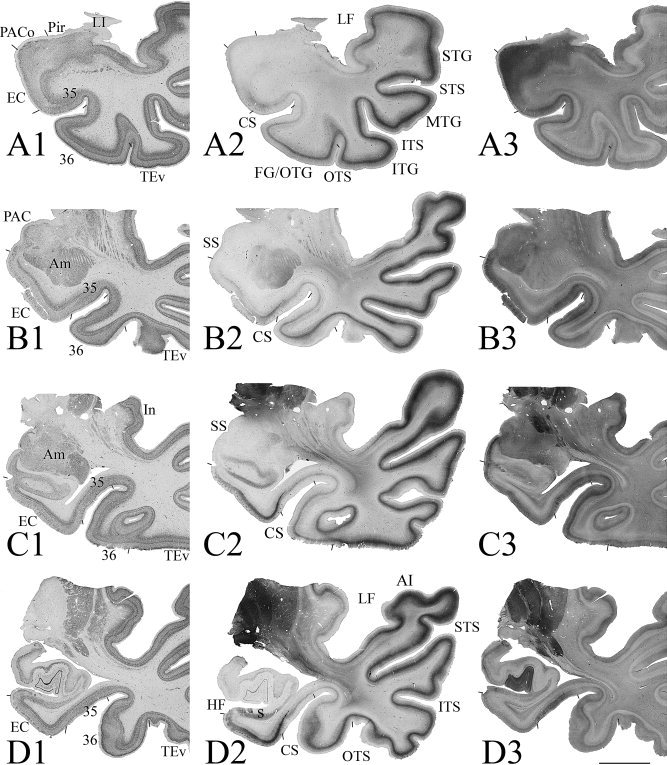
Photomicrographs of sequential coronal sections through four different anterior–posterior (AP) levels (A–D) of the MTL from a normal case show the main features of areas 35 and 36 in comparison with adjoining areas. This case has a Type I CS (deep CS) and no RS. At each AP level three adjacent sections were shown and they were stained for NeuN (A1‐D1), PV (A2‐D2), and CB (A3‐D3), respectively. Borders of areas 35 and 36 were defined by a combined analysis of the different markers. Examples of areas 35 and 36 at higher magnifications from this case were shown in Figure 4. For abbreviations, see list. Bar: 1 cm.
Major Defining Features of the Human Areas 35 and 36
This study does not rely on Nissl preparation for border defining because it stains both glial cells and neurons and the borders of human areas 35 and 36 cannot be confidently placed on Nissl preparation (e.g., Fig. 4A,E). Instead, NeuN stains only neurons and displays better cortical cytoarchitecture (e.g., Fig. 4B,F). A combined use of NeuN with other markers makes the border defining of human areas 35 and 36 much easier (Figs. 2, 3, 4, 5).
Figure 4.
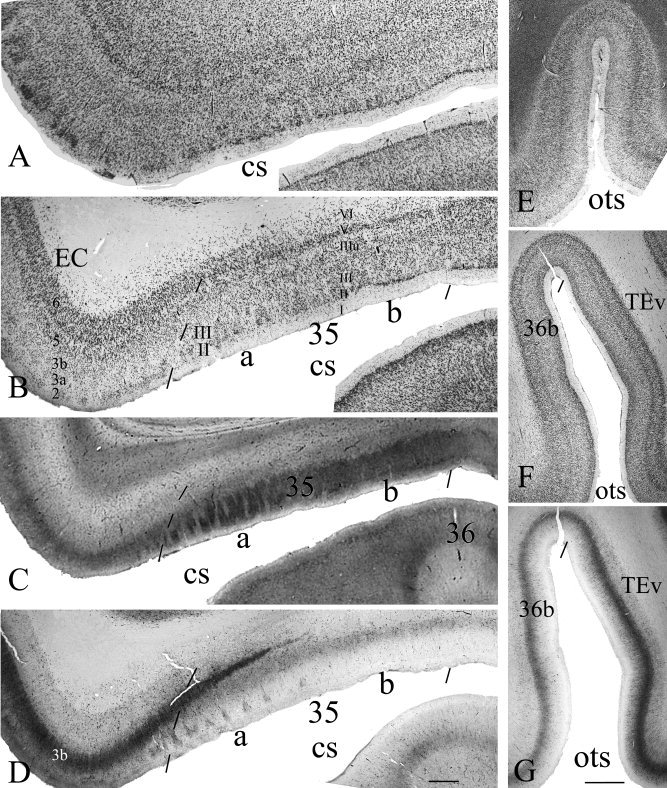
Comparison of conventional Nissl stains with a combined use of multiple stains for border definition of human areas 35 and 36. The borders of area 35 with EC and area 36 are less easily appreciated in Nissl preparation (A) than in NeuN stain (B). In contrast, the borders of area 35 can be confidently placed using adjacent sections stained for NeuN (B), CB (C), and PV (D), respectively. Note the distinct CB+ columns in area 35a (C) and the extension of dense PV+ layer 3b of the EC into area 35a (D). Similarly, the border between areas 36 (36b) and TE (TEv) is less easily identified in Nissl preparation (E) than in NeuN (F) and PV (G) stains. Note in (G) the PV staining intensity and density in area TE is much greater than in area 36. For abbreviations, see list. Scale bars: 1 mm in D (A–D); 2 mm in G (E–G).
Figure 5.
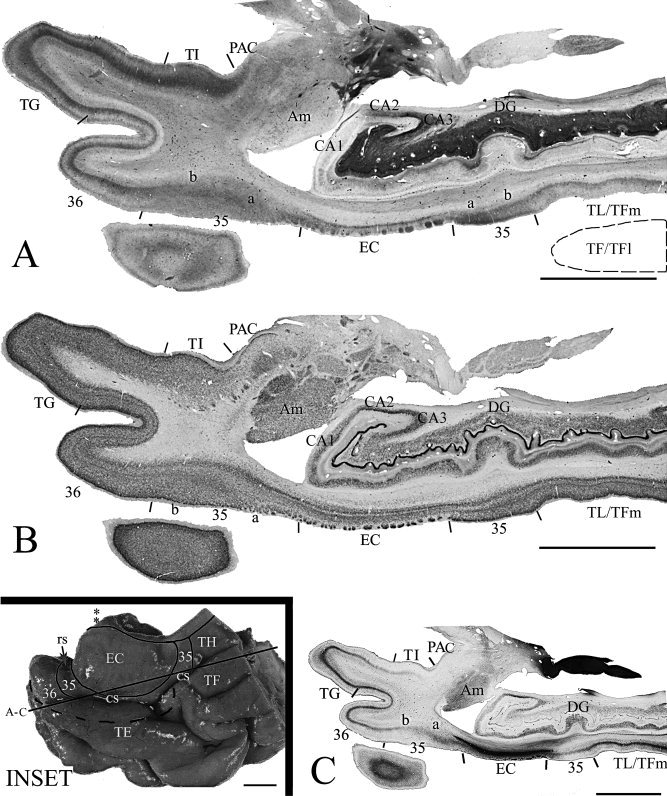
Localization and topography of areas 35 and 36 in a normal aging case with deep CS and shallow RS, as revealed by adjacent horizontal sections of the temporal lobe stained for CB (A), NeuN (B), and PV (C). Area 35 and its adjoining areas were outlined in the inset, where the location of the LI (indicated by two asterisks) and sections (A)–(C) were also marked. Note that the most anterior and most posterior area 35 can be easily distinguished from the anterior area 36 and the posteriorly located area TL/Tm, respectively, by a combined analysis of different markers. The dashed outline in (A) indicates the location of a missing piece of the lateral bank of the posterior CS, which is occupied by area TF/TFl. For abbreviations, see list. Scale bars: 1 cm.
Human area 35 can be divided into two subareas, 35a and 35b [see Ding et al.,2009]. Based on our detailed analysis of sequential adjacent sections stained respectively for NeuN, PV, CB, SMI‐32, and WFA and the tau pathology revealed by AT8 (or Thioflavin‐S), the major defining features of human area 35 include the following: (1) lack of distinct granular layer IV (Figs. 2A, 3A1–D1, 4A,B, and 5B); (2) dark CB+ immunoreactivity (due to many CB+ pyramidal neurons) in both layers II and III (Figs. 2D, 3A3–D3, 4C, and 5A); (3) generally light PV, SMI‐32, and WFA staining (Figs. 2B,C,E, 3A2–D2, and 6A1–C1,A2–C2); (4) an existence of unique layer IIIu [u for unique; for details see Ding et al.,2009], which is located superficial to layer V and deep to typical layer III and is the earliest target of tau lesion (Figs. 2F, 6A3–C3, and 7J,K); (5) columnar organization in layers II and III, especially in its medial portion (area 35a) adjoining the EC (Figs. 2D, 3A3–D3, 4C,D, and 5A).
Figure 6.
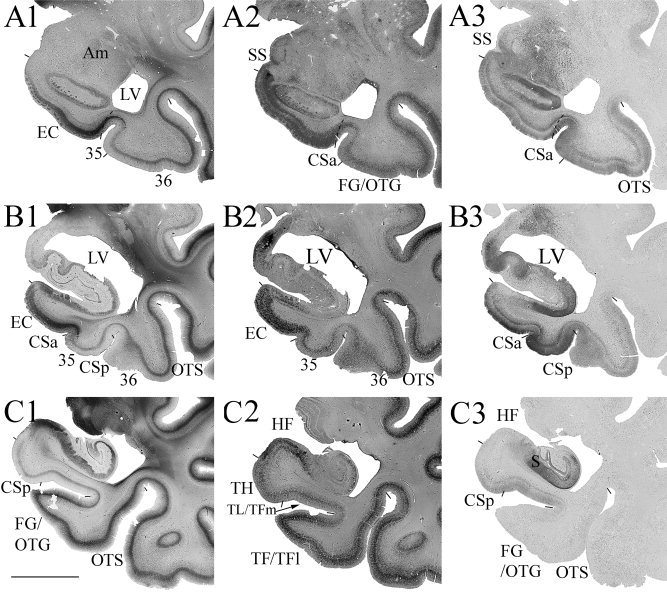
Photomicrographs of representative coronal sections through three different AP levels (A–C) of the MTL from a normal aging case with a Type II CS (shallow) and no RS show the main features of areas 35 and 36 in comparison with adjoining EC and areas TEv, TH, TL/TFm, and TF/TFl. At each AP level, three adjacent sections were shown and they were stained for PV (A1–C1), WFA (A2–C2), and AT8 (A3–C3), respectively. Borders of areas 35 and 36 and adjoining areas were defined by a combined analysis of different markers. Clear differences between the anterior FG/OTG (area 36 in A1–A3, B1–B3) and posterior FG/OTG (area TF/TFl in C1–C3) is appreciated in PV (B1, C1), WFA (B2, C2) and AT8 (B3, C3) stained sections. Note the distinct staining intensity in areas 35, 36 and TEv in AT8‐stained sections (A3–C3). Difference in staining intensity of areas 36 and TL/TFm is also seen in PV (B1, C1) and WFA (B2, C2) stained sections. For abbreviations, see list. Scale bar: 1 cm.
Figure 7.
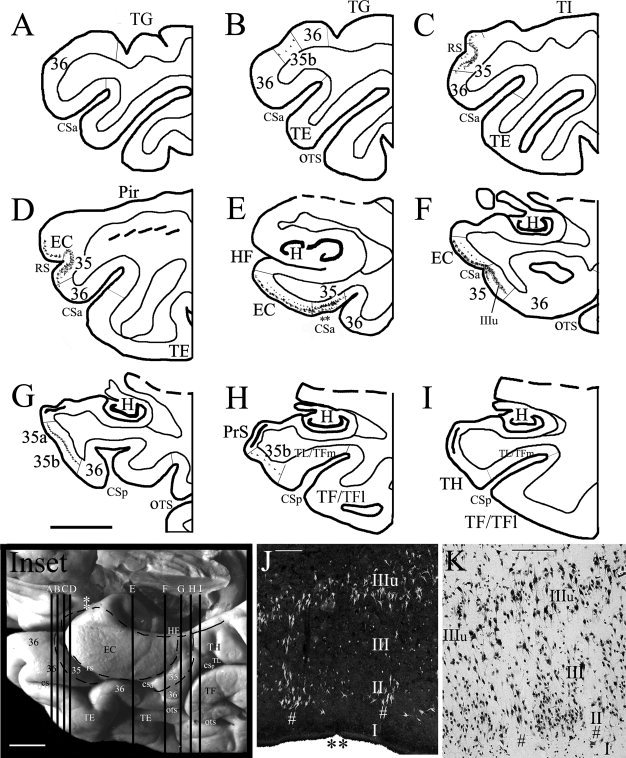
Localization and topography of human area 35 in a normal aging case with a Type II CS (deeper CS) and a deeper RS, as determined with Thioflavin‐S and Nissl stains in sequential coronal sections. Area 35 and its adjoining areas were outlined in the inset, where the location of the LI (indicated by two white asterisks) and sections (A)–(I) were marked. (A–I) The location of large NFT+ cells at different AP levels in areas 35 and the EC. The microphotograph of the area 35 in (E) was shown in (J) (the double black asterisks in E and J mark corresponding region). Note that in the most anterior and posterior coronal sections (B, H), large NFT+ pyramidal cells can be observed only in the unique layer IIIu of area 35b but not in the adjoining areas 36, TH, and TL/TFm. (J, K) Microphotographs of the sections from area 35 stained with Thioflavin‐S (J) and NeuN (K) show tau pathology (J) and normal cytology (K) of area 35. Note the early tau lesion in the large pyramidal neurons in layer IIIu and in large‐celled vertical columns (indicated by #) of the superficial layers. For abbreviations, see list. Scale bars: 1 cm in (A)–(I) and inset; 300 μm in J; 200 μm in K.
In comparison with area 35, area 36 contains thin but distinct granular layer IV, generally moderate immunostaining for PV, SMI‐32, and WFA, clearly weaker CB staining in layer II, no unique layer IIIu, and no columnar organization in layers II and III (Figs. 2, 3, 4, 5, 6 and 8). However, it should be mentioned that some changes in staining intensity and density exist mediolaterally within area 36. Thus human area 36 can be subdivided into 36a and 36b (e.g., Figs. 2 and 4). This phenomenon was also reported for monkey area 36 (e.g., Suzuki and Amaral,2003].
Figure 8.
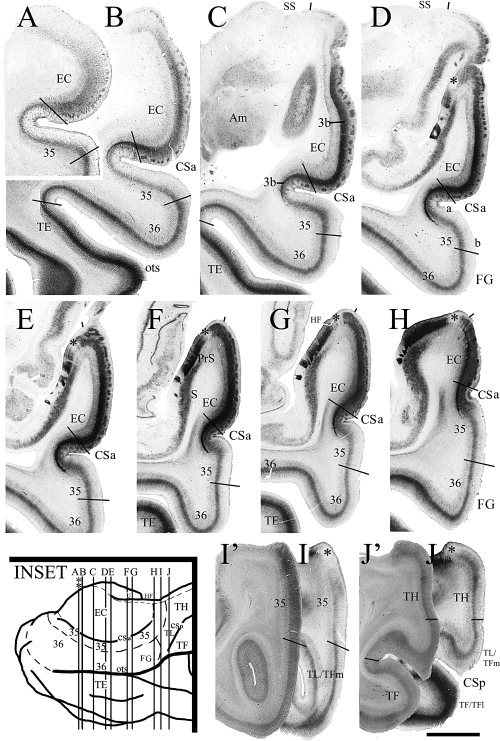
Localization and topography of human areas 35 and 36 in a normal case with a Type II CS (very shallow CSa) and no RS. In this case, area 35 is mainly located in the fundus, lateral bank of the CSa and the medial half of the crown of the FG/OTG (FG), whereas area 36 occupies the remaining portion of the FG/OTG, including the lateral crown of the FG/OTG and the medial bank of OTS, as determined by adjacent coronal sections stained for different markers (see example in Fig. 2). The topography of areas 35 and 36 and adjoining areas was shown in the inset, where the location of the LI (indicated by two asterisks) and sections (A)–(J) were also marked. (A–J) PV stained sections from different AP levels illustrate the PV staining patterns of areas 35 and 36 and adjoining areas TE, TL/TFm, TH, as well as the EC and PaS. Note in (B) and (C) area 36 can be easily distinguished from adjoining area TE on the base of the staining intensity and density. (I′, J′) CB‐stained sections illustrate the difference between the most posterior area 35 (I′) and the anterior portion of areas TL/TFm and TH (I′, J′). (I′) and (I), (J′) and (J) are adjacent sections. Note the dark CB labeling (I′) and light PV staining (I) in the PaS (indicated by * in D–J). For abbreviations, see list. Scale bar: 500 μm.
All these features were consistently observed throughout the whole anteroposterior (AP) axis of human areas 35 and 36 and are consistent with those demonstrated for the temporopolar portion of human areas 35 and 36 [Ding et al.,2009]. Thus, this study mainly focuses on defining the borders, extent, and topography of the middle (major), anterior, and posterior portions of areas 35 and 36 using these defining features rather than describing their detailed organization. The three subdivisions of areas 35 and 36 are purely for the convenience of description of their location.
Borders, Extent, and Topography of the Middle (Major) Portion of Areas 35 and 36
This portion is the typical areas 35 and 36 which can be easily identified as located laterally to the EC and medially to area TEv (Figs. 2, 3, 4 and 6, 7, 8, 9, 10). The major portion of areas 35 and 36 extend along the CS and OTS from limen insula (LI) level to the GI level and have the typical defining features described earlier. However, the precise location of this portion of areas 35 and 36 depends on the sulcal patterns of the CS. In brains with Type I CS which are always deep (>1.0 cm), area 35 (both 35a and 35b) always occupies most of the medial bank of the anterior portion of the long CS, whereas area 36 occupies the fundus of the CS and most of remaining portion of the FG/OTG including the lateral bank of the CS, the crown of the FG/OTG, and most of the medial bank of the OTS (Figs. 3, 4, and 9). In brains with Type II CS, area 35 is usually located along the CSa rather than the CSp. Specifically, in the brains with Type II CS, the CSa could be relatively deep or shallow. When the CSa is relatively deep (but usually not as deep as Type I CS), area 35 occupies almost the whole medial bank of the CSa, whereas area 36 takes nearly the whole FG/OTG (e.g., Fig. 7E). When the CSa is shallow, area 35 is located in the medial bank, fundus, and lateral bank of the CSa (e.g., Figs. 6 and 10) or even extends to cover the medial half of the crown of the FG/OTG (e.g., Figs. 2 and 8), whereas area 36 usually takes the remaining FG/OTG including the medial banks of OTS, which is usually deep when the CS is shallow (Figs. 2, 6, 8, and 10). Generally, the CSa is usually shallow in the brains with Type IIb CS. In the brains with Type IIa CS, the CSa could be relatively deep or shallow, but in cases where the anterior CSa merge with a deeper RS, the CSa is often deep.
Figure 9.
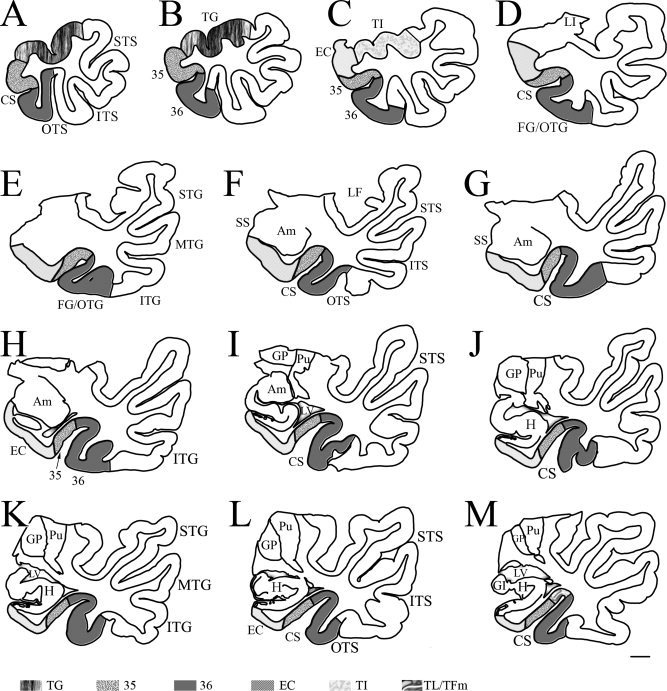
Neurolucida drawing of sequential sections (A–M) from a temporal lobe (same case as in Fig. 3) with Type I CS (deep) shows the borders, extent, and topography of areas 35 and 36 and adjoining areas as determined with a combined analysis of different markers. The interval between each section is about 2.5 mm. The anterior portion of the FG/OTG (A–M) and the ventromedial portion of the posterior TPC (not shown) is occupied mostly by area 36, whereas the majority of area 35 was located in the medial bank of the CS with the most anterior and posterior area 35 exposed on the medial cortical surface. The microphotographs of the adjacent sections at levels (D), (F), (H), and (K) were shown in Figure 3A1–3,B1–3,C1–3,D1–3, respectively. For abbreviations, see list. Scale bar: 5 mm.
Figure 10.
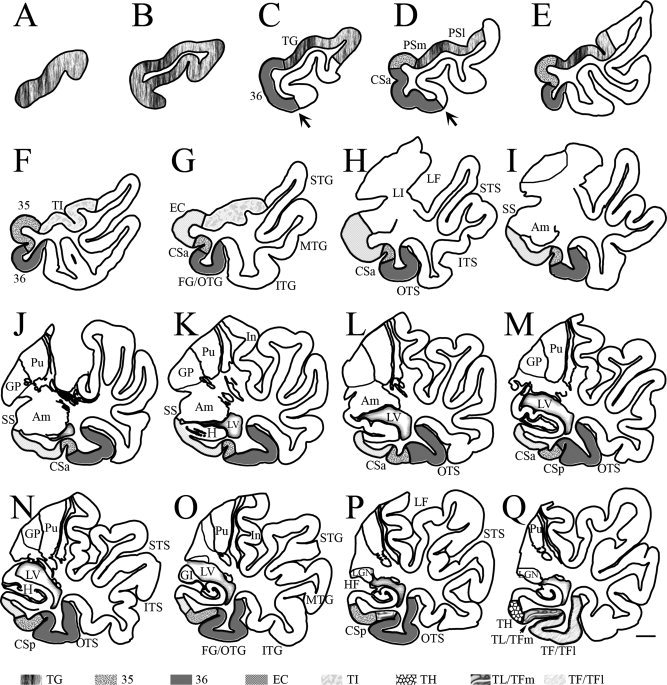
Neurolucida drawing of sequential sections (A–Q) from a temporal lobe (same case as in Fig. 6) with Type II (shallow) CS shows the borders, extent, and topography of areas 35 and 36 and adjoining areas as determined with a combined analysis of different markers. The interval between each section is about 2.5 mm. The arrows in (C) and (D) point to the junction of lateral and ventral aspects of the TPC. Note that area 36 occupies most of the ventromedial portion of the posterior TPC (C, D) and the anterior portion of the FG/OTG (E–P). In this case, the majority of area 35 was located in the fundus and lateral bank of the shallow CSa with the most anterior and posterior area 35 exposed on the medial cortical surface. The microphotographs of the adjacent sections at levels (K), (M), and (Q) were shown in Figure 6A1–3,B1–3,C1–3, respectively. For abbreviations, see list. Scale bar: 5 mm.
Three major differences between the middle portion of area 35 and the medially adjoining EC can be used to identify the border between them. First, the EC has round or horizontally elongated cell islands in layer 2 consisting of large star‐like neurons, whereas area 35 (i.e., adjoining area 35a) has alternative large and small pyramidal cell columns oriented vertically (Figs. 2D, 3A3–D3, 4C,D, and 7J,K). Second, the unique layer IIIu exists in area 35 but not in the adjoining EC (Figs. 2F and 7J,K). Third, area 35 (adjoining 35a) always contains distinct CB+ small pyramidal cell columns, whereas the EC usually does not (Figs. 2D, 3A3–D3, and 4C).
The middle portion of area 36 is easily distinguishable from medially adjoining area 35 based on the following reasons: (1) area 36 has thin but clear and continuous granular layer IV, whereas area 35 lacks a distinct granular layer IV (Figs. 2A, 3A1–D1, and 4F); (2) area 36 has dark CB+ labeling only in deep layer III, whereas area 35 has dark CB+ labeling in both layers II and III (Figs. 2D and 3A3–D3) [also see Ding et al.,2009]; (3) area 36 does not, whereas area 35 does have the unique layer IIIu (Figs. 2A,F and 7J,K); (4) area 36 has relatively stronger overall staining compared with area 35 in PV, WFA, and SMI‐32–stained sections (Figs. 2B,C,E, 3A1–D1, and 6A1–C1,A2–C2); (5) area 36 has lighter AT8 staining than area 35 does in aging brains (Figs. 2F and 6A3–D3). Area 36 identified in our study is about 28 mm in its wideness, 3.5 times larger than area 35 (about 8 mm) (Figs. 9 and 10). This wideness is significantly wider than that displayed in the previous reports [Insausti et al.,1998a,b], which located human area 36 mainly in the lateral bank of the CS. The ratio of areas 36 vs. 35 in this study is similar to that displayed in monkeys [Saleem et al.,2007; Suzuki and Amaral,2003].
Distinct differences between areas 36 and TEv can be identified in SMI‐32, PV, CB, WFA, and AT8‐stained sections. Specifically, area TEv has much stronger SMI‐32 labeling in layer IIIb and PV and WFA staining in layers IIIb and IV, and much weaker CB labeling in layers II and III, and less AT8 staining in aging brains, in comparison with area 36 (Figs. 2, 3, 4, 6, and 8).
Borders, Extent, and Topography of the Anterior Portion of Areas 35 and 36
The anterior portions of areas 35 and 36 are the ones located anterior to the level of LI. Generally, this portion of areas 35 and 36 gradually shifts out from the anterior CS and turns onto the medial surface of the posterior TPC region, where area 35 takes the course along the RS (when it is present; see Fig. 7) or turns onto the medial surface located anterior to the anterior EC (when a RS is absent or just a wide groove; see the insets in Figs. 5 and 8). Anterior area 36 surrounds the anterior area 35 anterolaterally. The borders, extent, and topography of anterior areas 35 and 36 have been investigated in detail recently [Ding et al.,2009] and were confirmed in three more additional cases in this study. Briefly, anterior areas 35 and 36 have the defining features described earlier and occupy most of the ventromedial aspect of the TPC region. The temporopolar area TG and the agranular insular area TI are located anterior and dorsolateral to anterior areas 35 and 36, whereas the anterior area TE is located ventrolateral to the anterior area 36 [for details, see Ding et al.,2009] (also see Fig. 10).
Borders, Extent, and Topography of the Posterior Portion of Areas 35 and 36
The posterior area 35 also gradually shifts out from the CS at about the GI level and turns onto the cortical surface of the posterior PHG (PPHG). Posterior area 35 is located posterior to EC, anterior to area TH, medial to area TL/TFm, and lateral to the parasubiculum (PaS). The posterior area 35 displays the defining features of area 35 described earlier and is easy to tell from EC and area 36, respectively, as described in the above sections (Figs. 5, 7, and 8H–J). The difference between areas 35 (35b) and TH can also be easily appreciated because area TH has much lighter CB+ and slightly darker PV+ labeling (Fig. 8I′–J) and does not contain the unique layer IIIu (thus no large NFT+ pyramidal neurons; see Fig. 7) in comparison with area 35b. The border between the posterior area 35 and area TH is at about the level where the most posterior putamen displays at least 3 clear islands (e.g., Fig. 10Q) in coronal sections cut perpendicular to the anterior–posterior commissural line. Posterior area 35 is also distinguishable from the PaS because the latter has few PV+ and no NFT+ (in aging cases) labeling although both regions lack granular layer IV and have dark CB+ labeling (Fig. 8I′,I).
Posterior area 36 has the typical defining features for the middle portion of area 36 but does not shift to the medial surface of the PPHG along with posterior area 35. Instead, posterior area 36 is separate medially from posterior area 35 by the most anterior portion of area TL/TFm and continues/mergers posteriorly with area TF/TFl, although laterally it still adjoins area TEv as middle area 36 does. The difference between areas 36 and 35 or TEv is apparent as described for the middle area 36. The difference between posterior area 36 and area TL/TFm can be appreciated by examination of NeuN, PV, WFA, and AT8‐stained sections, although both areas have dysgranular layer IV and display similar labeling patterns in CB and SMI‐32–stained sections (data not shown). In NeuN‐stained sections, area 36 has a densely packed layer II and a relatively large‐celled and sparsely packed layer III (thus the border of layers II and III is distinct), whereas area TL/TFm has a less densely packed layer II and a small‐celled and similarly packed layer III (thus the border of layers II and III is not distinct). In comparison with posterior area 36, area TL/TFm has relatively weaker PV and WFA staining and stronger AT8 staining (see Fig. 6). In addition, TL/TFm is mainly located in the medial bank of the posterior CS or CSp, whereas area 36 is mainly located in the FG/OTG including the lateral bank of the CS when the CS is deep. Posteriorly, area 36 adjoins area TF/TFl which is located in the posterior portion of the FG/OTG. The difference between posterior area 36 and area TF/TFl is distinct because the latter has a thicker granular layer IV, much darker PV, SMI‐32, and WFA staining, and much lighter AT8 staining than the former does (e.g., Fig. 6).
Identification of Human Areas 35 and 36 With Reference to Useful Landmarks
Based on our combined analysis of different markers described earlier, human PC (including both areas 35 and 36) can be reliably defined according to several critical landmarks including the TPUJ, RS, CS, OTS, GI, HF, PSm, and the most posterior putamen. In coronal planes perpendicular to the anterior–posterior commissural line, the anterior border between the EC and PC exists along the fundus of the RS and directly extends in a line to the anterior CS when RS is available (either shorter or longer, shallow or deep; see Fig. 1B). When the RS does not exist, an imaging line starting from the TPUJ, perpendicular to the HF (dashed line in Fig. 1A), and connecting the anterior CS approximates the anterior border between the EC and PC. This border usually begins 4–7 mm anterior to the LI in all the brains examined in this study (Figs. 5, 7, 8, 9, 10, and 11A,B). The lateral border between EC and PC depends on the depth of the CS. For Type‐I CS which is usually deep (e.g., Figs. 9 and 11A), and some Type‐II CS with deeper CSa, the border between EC and PC usually lies at the medial edge of the CS or CSa. For some other Type‐II CS with shallow CSa (e.g., Figs. 8, 10, and 11B), the border is often located near the fundus of the CSa. The posterior border between the EC and PC usually lies at the level immediately posterior to the tip of the GI and where the anterior LGN clearly shows up.
Figure 11.
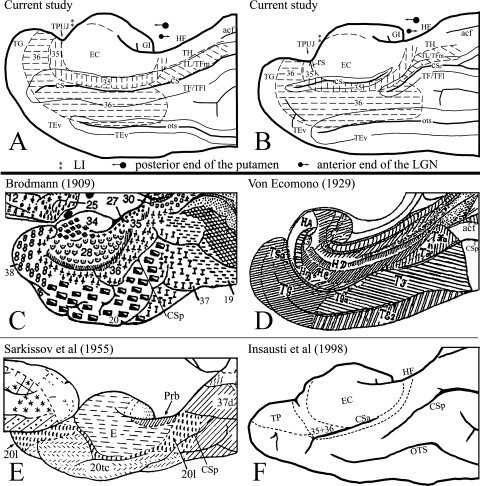
Summary of the present mapping of human areas 35 and 36 (A, B) and comparison with previous mappings (C–F). (A, B) Medial aspect views of human MTL show the locations and topography of areas 35 and 36 and adjoining regions (outlined by dashed lines) in the brains with type‐I CS (deep CS, A) and type‐II CS (shallow CS, B). The CS and OTS were opened up (outlined by fine continuous lines) for easy viewing of the areas in the sulci. The locations of some critical landmarks for border definition were also labeled. For detailed explanation, see text. (C–F) Medial aspect views of human MTL from previous maps were shown for comparison with the current maps. (C) Map of Brodmann [1909]; (D) map of von Economo [1929]; (E) map of Sarkissov et al. [1955]; (F) map of Insausti et al. [1998b]. Note the CSp is indicated in each map for reference and comparison.
As for the border between the PC and area TE, the OTS is a good landmark along most of its AP course, i.e., the border is usually located near the fundus of the anterior two‐thirds of the OTS (Fig. 11A,B). At the most anterior levels the majority of the medioventral surface of the posterior TPC region is covered by the PC (Figs. 10 and 11A,B). Dorsally, the PC borders with area TI and the posterior area TG lie at the medial edge of the PSm (see Fig. 10). Ventrally, the border between the PC and the anterior area TE is approximately located at the junction between the ventral and lateral aspects of the TPC region (arrows in Fig. 10C,D). At the most posterior levels, areas 35 and 36 were separated by the slightly anterior intrusion of area TL/TFm (Fig. 10P) and thus the most posterior limit of the PC can only be approximated at the level that contains the posterior end of the putamen but the posterior end of the GP disappeared (Fig. 10Q). Thus, this level is the approximate border between the PC and the PPHG regions (areas TH and TL/TFm).
In summary, examining the sulcal patterns and depth of the RS, CS, and OTS of the MTL before mapping could help precise definition of the borders, extent, and topography of the PC and adjoining cortical areas.
DISCUSSION
A key point of defining the borders and extent of human areas 35 and 36 is to find out a marker or a combination of markers that consistently and clearly label the whole AP extent of areas 35 and 36. In this investigation, a combined use of markers such as NeuN, PV, CB, SMI‐32, WFA, or tau pathology (labeled by AT8/Thioflavin‐S in aging and AD cases) were found to be useful to define the borders of areas 35 and 36. For example, NeuN is helpful in determining the border between area 35 and the EC in normal brains because the overall staining intensity and neuronal density in these two regions is clearly different (e.g., Figs. 3 and 4) [see also Ding et al.,2009]. CB can be used successfully for normal brains because it consistently and darkly labels both layers II and III of area 35 (due to the existence of many CB+ pyramidal neurons), while adjoining areas were less darkly labeled or only darkly labeled in layer IIIb (e.g., area 36). AT8 and Thioflavin‐S stains were also successfully used in this study for aging and AD brains to distinguish area 35 from area 36 and the EC. Specifically, the unique location and early existence of the tau lesion (labeled by AT8 or Thioflavin‐S) in the unique layer IIIu of the whole AP extent of area 35 made area 35 easily identifiable from adjoining EC and areas 36 and TH, as demonstrated in this (e.g., Fig. 7) and our recent studies [Ding et al.,2009]. More importantly, we found that a combined use of NeuN with PV, CB, SMI‐32, WFA, and AT8 immunohistochemistry results in confident borders of human areas 35 and 36 in both normal and aging cases. This same strategy has been successful in border determining of some complex brain regions in human and monkeys, such as the cingulo‐parahippocampal isthmus, orbitofrontal, and temporopolar cortices [Ding et al.,2003,2009; Ongur et al.,2003].
Borders, Extent, and Topography of Human Areas 35 and 36: Comparison With Previous Studies
Using the combinational strategies, this study revealed that human area 35 is an elongated transverse “C” shaped (i.e., the open portion of the “C” toward dorsal) structure, which surrounds the anterior, middle, and posterior portions of the EC and is encompassed by anterior, middle, and posterior area 36, as well as area TH at the most posterior level (Figs. 9, 10, and 11A,B). Specifically, the most anterior area 35 extends mediodorsally into the dorsal aspect of the posterior TPC, whereas the most posterior area 35 shifted out from the CS and moved onto the medial surface of the PPHG at the level of the GI. The posterior area 35 separates the posterior EC and area TH, which is also an agranular cortex. The middle (major) portion of human area 35 is located in and around the anterior CS or CSa, where it is situated lateral to the EC and medial to area 36. Lateral to area 36 is the larger area TE. Significant differences between this and the previous studies were noted on the most anterior and the most posterior areas 35 and 36 and on the extent of areas 35 and 36 in human brains.
Brodmann [1909] located human area 35 in or around the so‐called “rhinal” sulcus (CS in modern neuroanatomy), thus its name perirhinal cortex (see Fig. 11C). Brodmann's area 35 extends from the posterior TPC region all the way to the level of the anterior calcarine fissure (ACF) along with the laterally located ectorhinal area 36. In his study, the anterior area 35 does not extend into the dorsal aspect of the posterior TPC region, which has been proven not to be the case in this and our recent studies [Ding et al.,2009]. This study also demonstrated that the most posterior area 35 did not extend to the level of the ACF and instead it ended on the medial surface of the PPHG at the level posterior to the GI and where the GP disappears but the posterior putamen still exists. Area 36 (the anterior portion) in Brodmann's map appeared to be smaller in wideness than that identified in this study. The posterior portion of Brodmann's area 36 extended posteriorly to the level of ACF. In this study, the corresponding region to Brodmann's posterior area 36 was labeled as area TL/TFm based on our combined analysis of different cellular markers.
Von Economo [1929] treated the human area 35 as a subdivision (area TGa) of the large temporal polar area (i.e., area TG) (see Fig. 11D). Similar to our finding, in his study, area TGa lacked granular layer IV and was located in and around the anterior CS, although he was not able to identify laterally adjoining area 36 which appeared to be included in area TG and TF. The area TGa anteriorly extended into the dorsal aspect of the posterior TPC region and posteriorly ended at the PPHG posterior to the uncal tip; the region posterior to the TGa was labeled area THa, which is also an agranular region. This is basically consistent with this study, although a slight difference was found about the dorsal portion of the anterior area 35, where Von Ecomono [1929] included an agranular region corresponding to the temporal insular cortex (area TI) [see Ding et al.,2009] in area TGa. This portion of area 35 and the area TI were distinguishable in this and our recent studies [Ding et al.,2009].
Sarkissov et al. [1955] treated the perirhinal region (area 20l) as a subarea of area 20 (see Fig. 11E). Consistent with this finding, in their study, area 20l extended mainly around the RS and anterior segment of the CS. However, more anteriorly, area 20l extended into and occupied large portion of the mediodorsal aspect of TPC region, which is much different from our mapping (see above). At the posterior level, area 20l in the map of Sarkissov et al. [1955] shifted onto the medial surface of the PPHG posterior to the EC and anterior to their area 37d. This is basically in line with this study although the region similar to area TH was not identified at the location posterior to this part of area 20l. Another subarea of area 20 (20tc) in the map of Sarkissov et al. [1955] appeared to roughly correspond to area 36 identified in this study except for its most anterior portion where area 20tc did not extend to the ventromedial aspect of the TPC, which instead was occupied by the anterior area 20l (area 35). This was found not true in this and our recent studies [Ding et al.,2009]. In addition, Sarkissov et al. [1955] were not able to identify the corresponding regions to areas TH, TL/TFm, and TF/TFl at the location posterior to area 20l (area 35) and 20tc (area 36).
Recently, Insausti et al. [1998a,b] also mapped human areas 35 and 36 at different AP levels mainly based on Nissl preparation (see Fig. 11F). For example, in their study, PC (including both areas 35 and 36) was marked in and around the CS for the middle (major) portion of the PC and on the medial surface of the PPHG immediately posterior to the GI for the posterior portion of the PC [Insausti et al.,1998b], which is basically similar to this study regarding the general location. However, several differences were noted between their and our mappings. First, our PC (including both area 35 and 36) were much wider mediolaterally than theirs (compare Fig. 5 in their work with our Fig. 10). For example, area 36 identified in this study covers nearly the whole width of the anterior two‐thirds of the FG/OTG including the lateral bank (or part of it) of the CS, the crown of the FG/OTG, and the medial bank of the OTS (Figs. 9 and 10), whereas in their study, area 36 occupied mainly the lateral bank of the CS (see Fig. 5 in their work). Second, the most posterior PC was located posterior to the EC in one of their papers [Insausti et al.,1998b], but in another paper [Insausti et al.,1998a] the PC was not labeled to surround the EC posteriorly. Actually in either paper they did not describe the evidence for the difference between the PC (areas 35 and 36) and the PPHG region (areas TH and TL/TFm). In fact, it is very difficult to tell the PC region from the PPHG region on Nissl preparations because both regions contain agranular and dysgranular parts. In contrast, this study has revealed the differences by using a combined analysis of multiple modern neuroanatomical and pathological markers (see Figs. 5, 7, and 8). Third, the location and extent of the most anterior PC in the reports of Insausti et al. [1998a,b] is significantly different from our findings [Ding et al.,2009; this study]. Briefly, a significant portion of the anterior EC in their reports was treated as their anterior PC, as pointed out and discussed in our recent investigation [Ding et al.,2009] and confirmed in this study. For instance, the region they labeled as PC in their Figures 2C,D, 4D, and 5‐section 10 [Insausti et al.,1998b] was found to be the anterior EC in all brains examined in our investigation, with combined analysis of multiple markers [Ding et al.,2009; this study). In fact, the anterior EC begins at least 4 mm (4–7 mm) anterior to the LI in the brains examined in this study (the vertical double asterisks in the insets of Figures 5, 7, and 8 mark the appearance of the LI), rather than a few millimeters posterior to the LI as reported by Insausti et al. [1998a,b].
Therefore, the previous mappings of human areas 35 and 36 based mainly on Nissl preparations are variable, inconsistent, and less precise because it is difficult to distinguish areas 35 and 36 from the anterior EC and areas TI, TG anteriorly and from areas TH and TL/TFm posteriorly (e.g., Fig. 4A). This could explain the large variability of the anterior and posterior borders of human areas 35 and 36 reported by the previous researchers aforementioned. In addition, it is also difficult to precisely distinguish area 36 from area TE based on only one marker such as Nissl staining (e.g., Fig. 4E). This could explain the variability of the extent of area 36 among different research groups. The advantages of the combined analysis versus the traditional methods can be clearly seen in our recent [Ding et al.,2003,2009] and the present studies. Thus the borders identified with the former are almost clear‐cut and consistent, whereas the borders identified with the latter are often meager, variable, and inconsistent in some complex cortical regions.
Sulcal Patterns of the RS and CS and Localization of Human Areas 35 and 36
In this study, we found that the location of human areas 35 and 36 depends on the sulcal patterns of the RS and CS, especially the CS. Another important finding is that the depth of OTS is often related to that of the CS. Specifically, when the CS is deeper, the laterally located OTS is usually shallower and vice versa. This made the extent of the FG/OTG between these two sulci relatively stable. Thus, in the brains with Type I CS and some Type IIa CS (mainly those with deep RS which merge with the CSa), area 35 is located in the medial bank of the CS because the CS is usually deep, whereas area 36 occupies fundus and the lateral bank of the anterior CS or CSa and the crown of the FG/OTG as well as part of the medial bank of the OTS (Fig. 11A). In the brains with Type IIb CS and some Type IIa CS, area 35 often occupies both medial and lateral banks of the CSa, because CSa is usually shallow, whereas area 36 takes the whole FG crown and the whole medial bank of the OTS (Figs. 10 and 11B). Insausti et al. [1998b] also related the location of the PC (areas 35 and 36 together) to the depth of the CS. However, they did not report the detailed relationship between the localization of areas 35 and 36 and the sulcal patterns of the RS and CS.
Borders of Areas 35 and 36 and Neuroimaging Studies of the MTL Structures
More and more neuroimaging studies have been measuring the MTL and their functions in the brains of normal, aging and neurological diseases such as AD, Pick's disease, temporal lobe epilepsy, and schizophrenia, to investigate whether individual regions in the MTL contribute specifically to memory functions and whether volume changes occur associated with the progression of these diseases [Bernasconi et al.,2000; Bobinski et al.,1999; Chan et al.,2001; Davies et al.,2004; De Toledo‐Morrell et al.,2000; Feczko et al.,2009; Jutila et al.,2001; Killiany et al.,2000,2002; Kirwan and Stark,2004; Pihlajamaki et al.,2003,2004; Strange et al.,2002; Turetsky et al.,2003]. Obviously, these types of investigation are important for the understanding of human MTL function and for the early diagnosis of the MTL‐related diseases.
One of the key technical problems for these studies is to identify individual structures in the MTL and their borders, as pointed by many researchers in these fields [Bonilha et al.,2004; Davies et al.,2004; Kirwan and Stark,2004; Pihlajamaki et al.,2003; Pruessner et al.,2002; Squire et al.,2004]. The border determining of areas 35 and 36 is a key issue to be addressed in these types of studies because this will not only affect the volume of areas 35 and 36 but also the volume of adjoining EC and areas TI, TH, TL/TFm, TF/TFl, and TE. Unfortunately, little detailed information is available about the borders, extent, and topography of human areas 35 and 36 until our recent study [Ding et al.,2009]. Consequently, most of the imaging studies aforementioned heavily relied on a general description of the borders between the PC (areas 35 and 36) and adjoining temporal pole, EC, and PPHG [Insausti et al.,1998b]. As discussed earlier, the border determining in this study is mainly based on Nissl stain and is proven to be less precise than our recent [Ding et al.,2009] and the present studies (see Fig. 4). For example, the borders of area 35 with the anterior EC and with the agranular temporo‐insular area TI is difficult to be placed on Nissl preparations because all these areas lack the granular layer IV and have similar organization on Nissl‐stained sections; thus, both area TI and the anterior EC were mistreated as part of area 35 [Insausti et al.,1998b]. In addition, the size (width) of the PC they identified based on Nissl staining was much smaller (limited in the lateral bank of the CS laterally) than that identified in this study (reached to the medial bank of the OTS laterally) as appreciated with comparing their Figure 5 and our Figure 10 and as discussed earlier (see Fig. 11 for comparison). In contrast, our investigations have combined several different markers and determined confidentially the borders, extent, and topography of human areas 35 and 36 along different AP levels. More practically, this study has also revealed the relationships between the locations of human areas 35 and 36 and the sulcal patterns of the RS, CS, and OTS. In general, area 35 is located along the RS and the anterior portion of the CS, whereas area 36 occupies the medioventral aspect of the TPC and the major portion of the anterior two‐thirds of the FG/OTG (see summary in Fig. 11A,B).
Acknowledgements
The authors thank Dr. Jean Augustinack for critical reading of the early version of this manuscript, Tina Knutson and Diana Lei for histological help, and Darrell Wilkins for tissue acquisition via the University of Iowa Deeded Body Program.
REFERENCES
- Arnold SE ( 2000): Cellular and molecular neuropathology of the parahippocampal region in schizophrenia. Ann NY Acad Sci 911: 275–292. [DOI] [PubMed] [Google Scholar]
- Arnold SE,Hyman BT,Flory J,Damasio AR,Van Hoesen GW ( 1991): The topographical and neuroanatomical distribution of neurofibrillary tangles and neuritic plaques in the cerebral cortex of patients with Alzheimer's disease. Cereb Cortex 1: 103–116. [DOI] [PubMed] [Google Scholar]
- Bernasconi N,Bernasconi A,Caramanos Z,Andermann F,Dubeau F,Arnold DL ( 2000): Morphometric MRI analysis of the parahippocampal region in temporal lobe epilepsy. Ann NY Acad Sci 911: 495–500. [DOI] [PubMed] [Google Scholar]
- Blatt GJ,Rosene DL ( 1998): Organization of direct hippocampal efferent projections to the cerebral cortex of the rhesus monkey: Projections from CA1, prosubiculum, and subiculum to the temporal lobe. J Comp Neurol 392: 92–114. [DOI] [PubMed] [Google Scholar]
- Blatt GJ,Pandya DN,Rosene DL ( 2003): Parcellation of cortical afferents to three distinct sectors in the parahippocampal gyrus of the rhesus monkey: An anatomical and neurophysiological study. J Comp Neurol 466: 161–179. [DOI] [PubMed] [Google Scholar]
- Bobinski M,de Leon MJ,Convit A,De Santi S,Wegiel J,Tarshish CY,Saint Louis LA,Wisniewski HM ( 1999): MRI of entorhinal cortex in mild Alzheimer's disease. Lancet 353: 38–40. [DOI] [PubMed] [Google Scholar]
- Bonilha L,Kobayashi E,Cendes F,Li LM ( 2004): Protocol for volumetric segmentation of medial temporal structures using high‐resolution 3‐D magnetic resonance imaging. Hum Brain Mapp 22: 145–154. [DOI] [PMC free article] [PubMed] [Google Scholar]
- Braak H,Braak E ( 1991): Neuropathological stageing of Alzheimer‐related changes. Acta Neuropathol (Berl) 82: 239–259. [DOI] [PubMed] [Google Scholar]
- Braak H,Braak E ( 1992): The human entorhinal cortex: Normal morphology and lamina‐specific pathology in various diseases. Neurosci Res 15: 6–31. [DOI] [PubMed] [Google Scholar]
- Brodmann K ( 1909): Vergleichende Lokalisationslehre der Grosshirnrinde. Leipzig: Barth. [Google Scholar]
- Buckley MJ ( 2005): The role of the perirhinal cortex and hippocampus in learning, memory, and perception. Q J Exp Psychol B 58: 246–268. [DOI] [PubMed] [Google Scholar]
- Chan D,Fox NC,Scahill RI,Crum WR,Whitwell JL,Leschziner G,Rossor AM,Stevens JM,Cipolotti L,Rossor MN ( 2001): Patterns of temporal lobe atrophy in semantic dementia and Alzheimer's disease. Ann Neurol 9: 433–442. [PubMed] [Google Scholar]
- Davies RR,Graham KS,Xuereb JH,Williams GB,Hodges JR ( 2004): The human perirhinal cortex and semantic memory. Eur J Neurosci 20: 2441–2446. [DOI] [PubMed] [Google Scholar]
- Davis DG,Schmitt FA,Wekstein DR,Markesbery WR ( 1999): Alzheimer neuropathologic alterations in aged cognitively normal subjects. J Neuropathol Exp Neurol 58: 376–388. [DOI] [PubMed] [Google Scholar]
- De Toledo‐Morrell L,Goncharova I,Dickerson B,Wilson RS,Bennett DA ( 2000): From healthy aging to early Alzheimer's disease: In vivo detection of entorhinal cortex atrophy. Ann NY Acad Sci 911: 240–253. [DOI] [PubMed] [Google Scholar]
- Ding SL,Morecraft RL,Van Hoesen GW ( 2003): The topography, cytoarchitecture and cellular phenotypes of cortical areas that form the cingulo‐parahippocampal isthmus and adjoining retrocalcarine areas in the monkey. J Comp Neurol 456: 184–201. [DOI] [PubMed] [Google Scholar]
- Ding SL,Van Hoesen GW,Cassell MD,Poremba A ( 2009): Parcellation of human temporal polar cortex: A combined analysis of multiple cytoarchitectonic, chemoarchitectonic, and pathological markers. J Comp Neurol 514: 595–623. [DOI] [PMC free article] [PubMed] [Google Scholar]
- Feczko E,Augustinack JC,Fischl B,Dickerson BC ( 2009): An MRI‐based method for measuring volume, thickness and surface area of entorhinal, perirhinal, and posterior parahippocampal cortex. Neurobiol Aging 30: 420–431. [DOI] [PMC free article] [PubMed] [Google Scholar]
- Gold JJ,Squire LR ( 2005): Quantifying medial temporal lobe damage in memory‐impaired patients. Hippocampus 15: 79–85. [DOI] [PMC free article] [PubMed] [Google Scholar]
- Gomez‐Isla T,Price JL,McKeel DW Jr,Morris JC,Growdon JH,Hyman BT ( 1996): Profound loss of layer II entorhinal cortex neurons occurs in very mild Alzheimer's disease. J Neurosci 16: 4491–4500. [DOI] [PMC free article] [PubMed] [Google Scholar]
- Hyman BT,Van Horsen GW,Damasio AR,Barnes CL ( 1984): Alzheimer's disease: Cell‐specific pathology isolates the hippocampal formation. Science 225: 1168–1170. [DOI] [PubMed] [Google Scholar]
- Insausti R,Insausti AM,Sobreviela MT,Salinas A,Martinez‐Penuela JM ( 1998a): Human medial temporal lobe in adding: Anatomical base of memory preservation. Micros Res Tech 43: 8–15. [DOI] [PubMed] [Google Scholar]
- Insausti R,Juottonen K,Soininen H,Insausti AM,Partanen K,Vainio P,Laakso MP,Pitkanen A ( 1998b): MR volumetric analysis of the human entorhinal, perirhinal, and temporopolar cortices. Am J Neuroradiol 19: 659–671. [PMC free article] [PubMed] [Google Scholar]
- Jones EG,Powell TP ( 1970): An anatomical study of converging sensory pathways within the cerebral cortex of the monkey. Brain 93: 793–820. [DOI] [PubMed] [Google Scholar]
- Jutila L,Ylinen A,Partanen K,Alafuzoff I,Mervaala E,Partanen J,Vapalahti M,Vainio P,Pitkänen A ( 2001): MR volumetry of the entorhinal, perirhinal, and temporopolar cortices in drug‐refractory temporal lobe epilepsy. Am J Neuroradiol 22: 1490–1501. [PMC free article] [PubMed] [Google Scholar]
- Killiany RJ,Gomez‐Isla T,Moss M,Kikinis R,Sandor T,Jolesz F,Tanzi R,Jones K,Hyman BT,Albert MS ( 2000): Use of structural magnetic resonance imaging to predict who will get Alzheimer's disease. Ann Neurol 47: 430–439. [PubMed] [Google Scholar]
- Killiany RJ,Hyman BT,Gomez‐Isla T,Moss MB,Kikinis R,Jolesz F,Tanzi R,Jones K,Albert MS ( 2002): MRI measures of entorhinal cortex vs hippocampus in preclinical AD. Neurology 58: 1188–1196. [DOI] [PubMed] [Google Scholar]
- Kirwan CB,Stark CE ( 2004): Medial temporal lobe activation during encoding and retrieval of novel face‐name pairs. Hippocampus 14: 919–930. [DOI] [PMC free article] [PubMed] [Google Scholar]
- Kordower JH,Chu Y,Stebbins GT,DeKosky ST,Cochran EJ,Bennett D,Mufson EJ ( 2001): Loss and atrophy of layer II entorhinal cortex neurons in elderly people with mild cognitive impairment. Ann Neurol 49: 202–213. [PubMed] [Google Scholar]
- Lee AC,Barense MD,Graham KS ( 2005): The contribution of the human medial temporal lobe to perception: Bridging the gap between animal and human studies. Q J Exp Psychol B 58: 300–325. [DOI] [PubMed] [Google Scholar]
- Mitchell TW,Mufson EJ,Schneider JA,Cochran EJ,Nissanov J,Han LY,Bienias JL,Lee VM,Trojanowski JQ,Bennett DA,Arnold SE ( 2002): Parahippocampal tau pathology in healthy aging, mild cognitive impairment, and early Alzheimer's disease. Ann Neurol 51: 182–189. [DOI] [PubMed] [Google Scholar]
- Murray EA,Graham KS,Gaffan D ( 2005): Perirhinal cortex and its neighbours in the medial temporal lobe: Contributions to memory and perception. Q J Exp Psychol B 58: 378–396. [DOI] [PubMed] [Google Scholar]
- Ongur D,Ferry AT,Price JL ( 2003): Architectonic subdivision of the human orbital and medial prefrontal cortex. J Comp Neurol 460: 425–449. [DOI] [PubMed] [Google Scholar]
- Pihlajamaki M,Tanila H,Hanninen T,Kononen M,Mikkonen M,Jalkanen V,Partanen K,Aronen HJ,Soininen H ( 2003): Encoding of novel picture pairs activates the perirhinal cortex: An fMRI study. Hippocampus 13: 67–80. [DOI] [PubMed] [Google Scholar]
- Pihlajamaki M,Tanila H,Kononen M,Hanninen T,Hamalainen A,Soininen H,Aronen HJ ( 2004): Visual presentation of novel objects and new spatial arrangements of objects differentially activates the medial temporal lobe subareas in humans. Eur J Neurosci 19: 1939–1949. [DOI] [PubMed] [Google Scholar]
- Pruessner JC,Kohler S,Crane J,Pruessner M,Lord C,Byrne A,Kabani N,Collins DL,Evans AC ( 2002): Volumetry of temporopolar, perirhinal, entorhinal and parahippocampal cortex from high‐resolution MR images: Considering the variability of the collateral sulcus. Cereb Cortex 12: 1342–1353. [DOI] [PubMed] [Google Scholar]
- Saleem KS,Price JL,Hashikawa T ( 2007): Cytoarchitectonic and chemoarchitectonic subdivisions of the perirhinal and parahippocampal cortices in macaque monkeys. J Comp Neurol 500: 973–1006. [DOI] [PubMed] [Google Scholar]
- Sarkissov SA,Filimonoff IN,Kononowa EP,Preobraschenskaja IS,Kukuew LA ( 1955): Atlas of the Cytoarchitectonics of the Human Cerebral Cortex. Moscow: Medgiz. [Google Scholar]
- Squire LR,Stark CEL,Clark RE ( 2004): The medial temporal lobe. Ann Rev Neurosci 27: 279–306. [DOI] [PubMed] [Google Scholar]
- Squire LR,Wixted JT,Clark RE ( 2007): Recognition memory and the medial temporal lobe: A new perspective. Nat Rev Neurosci 8: 872–883. [DOI] [PMC free article] [PubMed] [Google Scholar]
- Strange BA,Otten LJ,Josephs O,Rugg MD,Dolan RJ ( 2002): Dissociable human perirhinal, hippocampal, and parahippocampal roles during verbal encoding. J Neurosci 22: 523–528. [DOI] [PMC free article] [PubMed] [Google Scholar]
- Suzuki WA,Amaral DG ( 2003): Perirhinal and parahippocampal cortices of the macaque monkey: Cytoarchitectonic and chemoarchitectonic organization. J Comp Neurol 463: 67–91. [DOI] [PubMed] [Google Scholar]
- Tranel D,Brady DR,Van Hoesen GW,Damasio AR ( 1988): Parahippocampal projections to posterior auditory association cortex (area Tpt) in Old‐World monkeys. Exp Brain Res 70: 406–416. [DOI] [PubMed] [Google Scholar]
- Turetsky BI,Moberg PJ,Roalf DR,Arnold SE,Gur RE ( 2003): Decrements in volume of anterior ventromedial temporal lobe and olfactory dysfunction in schizophrenia. Arch Gen Psychiatry 60: 1193–1200. [DOI] [PubMed] [Google Scholar]
- Van Hoesen GW ( 1982): The parahippocampal gyrus. New observations regarding its cortical connections in the monkey. Trends Neurosci 5: 345–350. [Google Scholar]
- Van Hoesen GW,Pandya DN ( 1975a): Some connections of the entorhinal (area 28) and perirhinal (area 35) cortices of the rhesus monkey. I. Temporal lobe afferents. Brain Res 95: 1–24. [DOI] [PubMed] [Google Scholar]
- Van Hoesen GW,Pandya DN ( 1975b): Some connections of the entorhinal (area 28) and perirhinal (area 35) cortices of the rhesus monkey. III. Efferent connections Brain Res 95: 39–59. [DOI] [PubMed] [Google Scholar]
- Van Hoesen GW,Pandya DN,Butters N ( 1972): Cortical afferents to the entorhinal cortex of the rhesus monkey. Science 175: 1471–1473. [DOI] [PubMed] [Google Scholar]
- Van Hoesen G,Pandya DN,Butters N ( 1975): Some connections of the entorhinal (area 28) and perirhinal (area 35) cortices of the rhesus monkey. II. Frontal lobe afferents. Brain Res 95: 25–38. [DOI] [PubMed] [Google Scholar]
- Van Horsen GW,Hyman BT,Damasio AR ( 1986): Cell‐specific pathology in neural systems of temporal lobe in Alzheimer's disease. Prog Brain Res 70: 321–335. [DOI] [PubMed] [Google Scholar]
- Von Economo C ( 1929): The Cytoarchitectonics of the Human Cerebral Cortex. London: Oxford University Press. [Google Scholar]
- Von Economo C,Koskinas GN ( 1925): Die Cytoarchitecktonik der Grosshirnrinde des Erwachsenen Menschen. Berlin: Springer. [Google Scholar]


