

Abstract
Auditory brainstem responses provide diagnostic value in pathologies involving the early parts of the auditory pathway. Despite that, the neural generators underlying the various components of these responses have remained unclear. Direct electrical recordings in humans are possible only in limited time periods during surgery and from small regions of the diseased brains. The evidence of the generator sites is therefore fragmented and indirect, based strongly on lesion studies and animal models. Source modeling of EEG has been limited to grand averages across multiple subjects. Here, we employed magnetoencephalography (MEG) to shed more light on the neural origins of the auditory brainstem responses (ABR) and to test whether such deep brain structures are accessible by MEG. We show that the magnetic counterparts of the electric ABRs can be measured in 30 min and that they allow localization of some of the underlying neural sources in individual subjects. Many of the electric ABR components were present in our MEG data; however, the morphologies of the magnetic and electric responses were different, indicating that the MEG signals carry information complementary to the EEG data. The locations of the neural sources corresponding to the magnetic ABR deflections ranged from the auditory nerve to the inferior colliculus. The earliest cortical responses were detectable at the latency of 13 ms. Hum Brain Mapp, 2009. © 2009 Wiley‐Liss, Inc.
Keywords: vestibulocochlear nerve, auditory pathways, cochlear nucleus, inferior colliculus, auditory brainstem, auditory cortex, auditory evoked fields, ABR generators, brain mapping, magnetoencephalography
INTRODUCTION
When a short click stimulus is presented to a healthy subject, the auditory brainstem pathway elicits a series of responses recordable on the scalp with EEG [Jewett et al., 1970]. Within the first 10 ms, five to seven vertex‐positive responses, denoted as I–VII, and a slow negative‐going deflection starting after wave V at about 6 ms are generated. Together these deflections constitute the auditory brainstem response (ABR). Waves II, IV, and VI may be undetectable in normal subjects [Levine et al., 1993].
The ABRs are routinely used in clinical practice to assess the integrity of the lower auditory pathways [e.g., Chiappa, 1990]. Detailed information of the generation sites of the responses would, however, further enhance the clinical applicability and relevance of ABRs. Waves I and II have been demonstrated to originate in the auditory nerve or at its entry into the brainstem and cochlear nucleus. The sources of the deflections occurring at 3 ms and later have remained disputable despite elaborate animal models [Melcher and Kiang, 1996], studies of patients with brainstem lesions [Starr and Achor, 1975], and direct recordings from the brainstem during neurosurgical operations [Møller and Jannetta, 1983]. While it is evident that multiple structures of the complex brainstem auditory pathway are active simultaneously already at latencies less than 10 ms, activity in or near the ipsilateral cochlear nucleus has mostly been associated with wave III although superior olivary complex has also been proposed as the main generator. Wave IV is suggested to be generated in the fiber tracts leaving the cochlear nucleus and/or in the nuclei of the superior olivary complex with a possible contribution from the inferior lateral lemniscus. The large‐amplitude wave V has been attributed to activity in lateral lemniscus; direct intracranial recordings near inferior colliculus have demonstrated a strong activity with a slightly longer latency than that of wave V, indicating a subcollicular origin of wave V. The slow vertex‐negative peak following wave V has been attributed to activity in the inferior colliculus [Møller and Jannetta, 1983].
The ascending auditory pathways contain both crossed and uncrossed routes to the auditory cortices. Some studies of patients with lesions have suggested that the ipsilateral auditory pathways might be the main generator of wave V [Markand et al., 1989], although a contralateral origin in the lateral lemniscus has also been suggested [e.g., Voordecker et al., 1988].
In healthy subjects, source modeling of the electric ABR [Grandori, 1982; Scherg and von Cramon, 1985] has contributed to our understanding of the ABR generators; however, the localization accuracy of EEG is limited.
In scalp EEG, the ABRs are followed by middle‐latency responses (MLRs) peaking up to 50 ms after the stimulus onset and generated in the auditory cortex [Cacace et al., 1990; Pelizzone et al., 1987]. Direct electric recordings indicate the earliest cortical response at 10 ms [Brugge et al., 2008; Celesia, 1976]. An early 11‐ms response has been detected by MEG [Kuriki et al., 1995], followed by a deflection at 19 ms [Hashimoto et al., 1995; Scherg et al., 1990]. More robust middle‐latency responses peak around 30–50 ms. Their generator sites are close to that of the strong, long‐latency N100m response [Mäkelä et al., 1994; Pelizzone et al., 1987; Yvert et al., 2001]; however, they differ in sensitivity to stimulus manipulations.
Neuromagnetic signals detectable extracranially originate mainly in the neocortex due to its proximity to the sensors and the faster decrease of the magnetic versus electric signal when the source approaches the center of a spherically symmetric conductor, where no external magnetic field is produced. Since the shape of the cranium is relatively close to a sphere, it has been disputable whether signals from deep structures are detectable by MEG. A set of virtual channels, sensing source currents without directional specificity, derived from a priori anatomical information about the assumed source location have successfully been used to recover the time course of a deep source [Tesche, 1996]. In addition, MEG measurements of the auditory brainstem responses have been demonstrated [Erné and Hoke, 1990; Erné et al., 1987; Iramina and Ueno, 1995; Lütkenhöner et al., 2000].
In this study, we used a large array of low‐noise magnetometers to record magnetic ABRs (mABR) and early cortical responses to a click stimulus. The attained signal‐to‐noise ratio allowed, for the first time, localizing the generators of some of the mABRs.
MATERIALS AND METHODS
Subjects
Seven healthy volunteers (26–46 years, average 32 years; five men, two women) with no history of hearing problems were studied. All subjects gave their informed consent to participate in the study, which was approved by the Ethics Committee of Helsinki‐Uusimaa.
Stimulus
Rarefaction clicks (0.6 ms in duration), generated with a piezoelectric crystal outside the magnetically shielded room, were delivered to subject's left ear via a 2‐m long hard plastic tube. Click intensity, duration, conduction time through the tube, and the absence of interfering reflections were verified by an artificial ear (Brüel&Kjaer model 4157, Naerum, Denmark) at the earpiece of the tube. The peak‐equivalent sound intensity was 107 dBSPL, and the click was delayed by 6.45 ms with respect to the electrical signal to the piezoelectric crystal. The delay was compensated for by shifting the time axis of the averaged signals accordingly.
In preliminary tests with 5‐, 10‐ and 40‐Hz presentation rates, stimulation at 10 Hz yielded the highest signal‐to‐noise ratio given a fixed measurement time, which is in accordance with the clinical EEG literature [Chiappa, 1990]. The actual employed rate was 9.09 Hz to avoid the accumulation of the 50‐Hz power line interference in the average.
Recordings
Measurements were carried out with the Elekta Neuromag® MEG system (Elekta Neuromag Oy, Helsinki, Finland), which comprises 204 planar gradiometers and 102 magnetometers (27 × 27 mm2 pick‐up coils) in a helmet‐shaped array. The built‐in EEG system was used to record between FPz and left mastoid simultaneously with the 306 MEG channels. Both MEG and EEG were low‐pass filtered at 1.2 kHz and subsequently sampled at 3 kHz. For low‐pass filtering, instead of the standard sixth‐order filter of the MEG system, a second‐order Butterworth filter was used for lower phase distortion at frequencies close to the filter cut‐off at the expense of minor aliasing of white noise to the measurement band.
Each subject was measured for 30 min, yielding about 16,000 epochs to average. A 20‐s period of raw data in the middle of the recording was collected for determining the optimal signal‐space operator for projecting out environmental interference.
The subjects were asked not to pay attention to the stimuli. During the recording, they were silently reading a book.
Postprocessing
The averaged signals were band‐pass filtered (180–1,000 Hz for the ABR and 30–300 Hz for the early cortical components) with a linear‐phase FFT filter and compensated for interference by signal‐space projection (SSP) [Parkkonen et al., 1999; Uusitalo and Ilmoniemi, 1997].
The SSP‐operator was constructed by a principal component analysis (PCA) of the raw data collected during the recording, bandpass‐filtered similarly to the averaged signals to optimize the SSP for the in‐band interference, which consisted mainly of the harmonics of the 50‐Hz mains. Two SSP components corresponding to the two highest eigenvalues of the PCA vectors were employed. These components did not reduce the amplitude of the brain signals significantly.
For enhanced visualization, the signals were upsampled to a rate of 12 kHz; three zero‐valued frequency bins were inserted between two consecutive original samples of the signal in the frequency domain, and the augmented signal was converted back to the time domain by an inverse Fourier transform.
A grand‐average ABR was computed to improve the detection of the lower‐amplitude waves preceding wave V. The SSP‐projected and filtered (180–1,000 Hz) responses were latency‐normalized using the individually‐detected wave V as the reference. In the normalization, the time axis was slightly dilated or shrunk to align wave V's to their mean latency while keeping the zero (click presentation) time intact; the responses shifted in proportion to the their latency. This normalized response was computed by resampling the upsampled signal to the desired time axis, linearly interpolating the sample values for time points between the original samples. The root‐mean‐squared (RMS) signal was then computed across all magnetometer channels and subjects.
Integration with Structural MRIs
The MEG and MRI device coordinate systems were linked through a head coordinate system, defined by three anatomical landmarks (the nasion and the left and right preauricular points) accurately identifiable both in MR‐images and on the head of the subject.
Four marker coils were attached to the subjects' scalp. The positions of these coils in the head coordinate system were measured by a 3D digitizer. Small sinusoidal currents at distinct frequencies were fed through the coils just prior to the MEG recording and the locations of the coils in the MEG device coordinate system were determined based on the generated magnetic fields.
The structural MR‐images were acquired by a General Electric (Milwaukee, WI) Signa 3‐tesla and Siemens (Erlangen, Germany) 1.5‐tesla MRI scanners. FreeSurfer (http://surfer.nmr.mgh.harvard.edu) was employed for automatic segmentation and tesselation of scalp, skull and brain volumes from individual MR‐images [Fischl et al., 2004]. The decimated meshes, each comprising 5,120 triangles, were then utilized in constructing a boundary element model (BEM) for each subject, except for Subject 6 whose MRIs were not available. Conductivities of 0.3, 0.006, and 0.3 S/m were assigned to the brain, skull, and scalp compartments, respectively. FreeSurfer was utilized also for obtaining an affine transformation between the each individual brain and the MNI305 (Montreal Neurological Institute) average brain for group‐level visualization [Collins et al., 1994].
Source Modeling
The MEG signal sources were modeled with equivalent current dipoles (ECDs), defined as the ideal current dipoles explaining the measured magnetic fields best at a given time point. The ECD locations and orientations were found with a non‐linear search which minimized the sum of squared errors at each measurement channel between the model and the measurements. For modeling the ABRs, this fitting was performed sequentially from 0.5 to 8 ms in steps of 0.1 ms and for the middle‐latency responses at time points when the averaged data exhibited a clear dipolar field pattern. Only dipole models accounting for more than 70% of the signal variance were accepted. In addition to these single‐dipole fits, multidipole modeling was attempted. The 102 magnetometer channels were used for estimating the field maps and fitting the mABR sources whereas all 306 channels were employed when modeling the middle‐latency responses. Two‐dipole models were constructed for bilateral sources by first selecting a group of at least 40 channels above the dominant auditory cortex, fitting a single dipole, projecting the field pattern of that dipole out, selecting a similar group of channels above the other auditory cortex and fitting another single dipole to the residual.
RESULTS
MEG Signals
Averaged and filtered (pass‐band 180–1,000 Hz) MEG signals revealed a sequence of responses peaking between 2 and 7 ms after the click. Figure 1 shows the grand average (root‐mean‐squared) across all magnetometer channels and all subjects; mABRs lack the sharp initial deflection, wave I, present in the electric recordings whereas they exhibit a peak at 2 ms, coinciding with the trough following the electric wave I, i.e., wave I‐, in most subjects. The later deflections are apparent in both electric and magnetic recordings but with different relative amplitudes and slightly different peak latencies.
Figure 1.
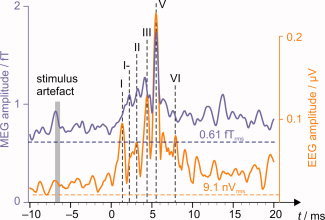
Grand average across all subjects and all 102 magnetometer channels. Filtered (180–1,000 Hz) MEG and EEG signals were latency‐normalized with respect to the individually‐determined Wave V prior to computing the root‐mean‐squared average. The click was delivered to the ear canal at zero time. The magnetic artefact originated in the stimulator 2 m from the ear. Dashed horizontal lines indicate intrinsic MEG and EEG system noise levels.
Filtering the MEG signals to 30–300 Hz allowed detecting the middle‐latency components starting at 13 ms in two subjects. In one subject, the rapid stimulation elicited steady‐state responses which were apparent despite the 30‐Hz high‐pass filtering and thus prevented reliable separation of the middle‐latency responses. Table I lists the observed responses in both frequency bands and in each subject.
Table I.
Magnetic auditory brainstem responses (mABR) and middle‐latency auditory evoked fields (ML‐AEF)
| Subject | mABR waves(180–1,000 Hz) | ML‐AEF (30–300 Hz) |
|---|---|---|
| S1 | I‐, II, III, IV, V | N17, P30, N40, P50 |
| S2 | I‐, V | N17, P30, N40 |
| S3 | V | N17, P30, N40 |
| S4 | I‐, III‐, V, VI | (in steady state) P30 |
| S5 | I‐, V | P30, N40 |
| S6 | II‐, V | N17, P30, N45 |
| S7 | I‐, II‐, III, IV, V | N17, P30, N40 |
Responses exceeding two standard deviations (P < 0.05) of the baseline noise at any magnetometer channel or twice the baseline amplitude of the global root‐mean‐square signal. Magnetic ABRs are labeled according to the simultaneously recorded electric responses. Roman numerals refer to the standard labeling with the minus sign denoting the trough following the peak; N and P denote vertex‐negative and ‐positive (respectively) EEG‐counterpart of the response, followed by an approximate latency in milliseconds.
The most prominent magnetic brainstem response coincided with wave V of the electric ABR; see Figure 2 for the average response in one subject. This response was identifiable in all subjects and its peak amplitude ranged from 3.3 to 6.6 fT (mean 4.7 fT). The mean latency was 5.6 ms, which is comparable to the electric wave V normal latency of 5.7 ms at the click rate of 10 Hz [Chiappa, 1990]. Table II lists the peak latencies and amplitudes of wave V for all subjects. S2 and S5 exhibited elevated noise up to 300 Hz; thus, high‐pass filtering at 400 Hz instead of 180 Hz further improved the signal‐to‐noise ratio. This higher band was employed for source modeling in these two subjects.
Figure 2.
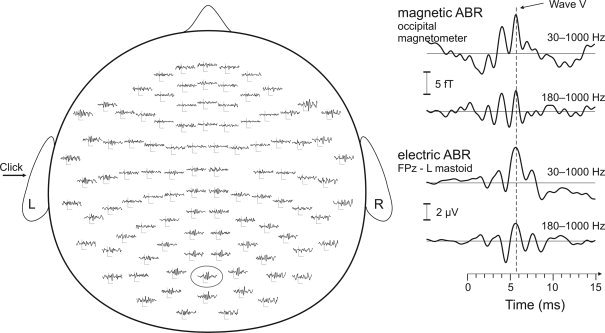
Magnetic and electric ABR from subject S1. Average magnetometer signals (left), and an enlarged occipital magnetometer channel with the simultaneously measured EEG, both shown filtered to two pass‐bands (right).
Table II.
Wave V latencies, amplitudes, and signal‐to‐noise ratios in MEG and EEG
| Subject | t/ms | B max/fT | E max/μV | B n/fTrms | E n/μVrms | SNRMEG | SNREEG |
|---|---|---|---|---|---|---|---|
| S1 | 5.8 | 6.6 | 0.21 | 1.1 | 0.02 | 6.29 | 11 |
| S2 | 5.1 | 4.4 | 0.23 | 0.97 | 0.05 | 4.54 | 4.6 |
| S3 | 5.5 | 3.3 | 0.19 | 0.73 | 0.02 | 4.52 | 9.5 |
| S4 | 5.3 | 5.9 | 0.08 | 0.52 | 0.03 | 11.4 | 2.7 |
| S5 | 5.7 | 3.9 | 0.22 | 0.54 | 0.01 | 7.22 | 22 |
| S6 | 5.7 | 3.4 | 0.19 | 0.75 | 0.02 | 4.53 | 9.5 |
| S7 | 5.8 | 5.4 | 0.46 | 0.82 | 0.02 | 6.59 | 23 |
| Average | 5.6 | 4.7 | 0.23 | 0.77 | 0.02 | 6.43 | 11.7 |
t, response peak latency; B max and E max, peak amplitude in MEG and EEG; B n and E n, noise level in MEG and EEG as root‐mean‐squared amplitude of the baseline period; SNR, signal‐to‐noise ratio.
The average signal‐to‐noise ratio (SNR) of wave V was 6.1 for the magnetometers whereas the SNR of the gradiometers was too low for a reliable detection of wave V. Taking into account the number of averages (N = 16,000) and the bandwidth (Δf = 820 Hz), the observed average baseline noise level (B = 0.77 fTrms) corresponds to a spectral density S = B n√(N/Δf) = 3.4 fT/√Hz, and that of the best subject to 2.3 fT/√Hz, which is about the instrumentation white noise level.
The magnetic counterparts of the ABR deflections preceding wave V exhibited lower amplitudes and higher variability across subjects as in electric recordings.
Sources
Magnetic field maps of the mABR deflections at different latencies are shown in Figure 3 (single subject). The maps indicate ipsilateral sources for the earliest responses (waves I–II) and a medial or contralateral generator for wave V. The cortical middle‐latency responses were bilateral but clearly stronger in the contralateral hemisphere. Single‐dipole modeling yielded goodness‐of‐fit values above 70% using all magnetometer channels and for all sources shown in Figure 3.
Figure 3.

Magnetic field maps and ECD locations of the auditory brainstem and early cortical responses; data from subject S1. The blue and red contours (left column) indicate magnetic fields entering and exiting the head, respectively. The dots denote the estimated ECD locations, and the arrows indicate the direction of current flow (right column).
The ECD locations of the earliest observed deflections (best fit at t = 2.4 ms on average) indicated a contribution from the auditory nerve. The current dipoles were approximately in the horizontal plane, pointing toward the neck of the subject. Their strength Q was 0.9 ± 0.1 nAm (mean ± SEM) on average. In one subject, a dipolar pattern was present also at 3.0 ms, corresponding to wave II of the ABR. The ECD (Q = 1.1 nAm) localized near the ipsilateral cochlear nucleus; see Figure 3.
The locations of the ECDs corresponding to wave V (t = 5.5 ms) were contralateral in all subjects, near but lateral and posterior to lateral lemniscus. The ECDs (Q = 1.4 ± 0.1 nAm) were oriented contralaterally, about 34 degrees above the horizontal plane and five degrees posterior from the coronal plane. In some subjects, the residual field pattern (not shown) after subtracting the strongest dipolar wave V component suggested for an additional, simultaneous source; however, the signal‐to‐noise ratio of the residual did not allow reliable modeling.
A magnetic counterpart of wave VI was seen in one subject but its signal‐to‐noise ratio was insufficient for source modeling.
A standard multidipole model of brainstem sources with uninformed source waveforms did not yield reliable results; the dipoles interacted, producing spurious activity estimates even if the positions and orientations of the dipoles were fixed.
The earliest detected cortical responses following the ABRs peaked at about 17 ms (N17m) in five of the seven subjects and at about 30 ms (P30m) in the other two. In two subjects the rising slope of the N17m response exceeded baseline noise already at 13 ms. The ECD models indicated the sources of the N17m deflections in the primary auditory cortices, deep in the Heschl's gyri. The sources of the P30m responses, detectable in all subjects, were lateral and anterior to the N17m sources; see Figure 3 for the N17m and P30m field maps and source locations in one subject.
Figure 4 shows the source locations, transformed to the MNI305 average brain, of all accepted ECD models for both the magnetic ABRs and middle‐latency responses in all subjects. In particular, sources at 5–6 ms (wave V latencies) are all contralateral.
Figure 4.
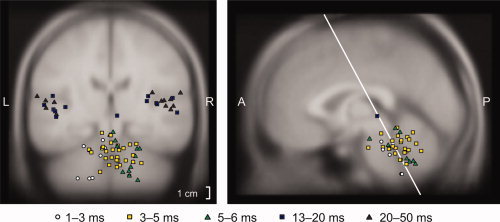
ECD locations of the mABRs and middle‐latency responses to left‐ear stimulation in all subjects. The locations of all dipoles with goodness‐of‐fit >70% were transformed to the MNI305 brain and color‐coded for latency. All sources within 20 mm from the displayed planes are plotted. The sources of wave V are shown as green triangles.
DISCUSSION
MEG and Deep Sources
Our study demonstrated that a reliable magnetic measurement of auditory brainstem responses is possible with low‐noise magnetometers, which suggests that also other activity in deep brain structures may be detected and visualized by MEG in a data‐driven manner. However, the contribution of the deep structures is best seen when the masking cortical activity can be suppressed by filtering. In the mABR frequency band employed here (180–1,000 Hz), the observed baseline noise level was only marginally higher than the intrinsic system noise level; thus, lower‐noise MEG sensors would facilitate studies of such high‐frequency phenomena. Background brain activity and particularly magnetic muscular artifacts are likely responsible for the slight increase of the noise level.
The mABRs could potentially be enhanced by using chirp stimuli instead of simple clicks. Chirps are complex wide‐band sounds crafted to stimulate a large extent of the basilar membrane simultaneously [Fobel and Dau, 2004] and therefore elicit stronger responses. Alternatively, the stimulation rate could be substantially increased by employing pseudo‐random click trains, and applying decorrelation methods to extract the response to a single click [Delgado and Ozdamar, 2004; Eysholdt and Schreiner, 1982].
MEG is considered useful in locating epileptic activity from lateral fissural cortices. However, mesial temporal epileptic activity is poorly visualized in recordings with MEG devices comprising only gradiometers [Mikuni et al., 1997]. The reliable measurement of mABRs in individual subjects encourages studies of activity in other deep brain structures, such as epileptic discharges in mesial temporal lobes [Enatsu et al., 2008], by MEG measured with magnetometers.
Source Modeling
We employed equivalent current dipoles (ECDs) in modeling the sources of mABRs. When modeling cortical activity, the ECD represents synchronized post‐synaptic currents in the dendrites of pyramidal cells in a small patch of cortex [Hämäläinen et al., 1993]. However, for nuclei and axons the ECD should be considered to reflect the dipolar net effect due to all neural currents, whether dendritic or axonal. In these cases the strength of the ECD is greatly affected by the geometry of the cellular primary currents as well as the distribution of volume currents in the surrounding conducting medium; straight axons in a bulk homogenous medium contribute only weakly to the extracranial field while symmetry breaks, such as curved axon segments or abrupt changes in the surrounding conductivity, give rise to a dipolar source [see e.g., Scherg and von Cramon, 1985; Zappia et al., 1996]. Accordingly, action potentials are assumed to give rise to far‐field components [Eggermont, 2007; Møller, 2007] at locations where (i) the nerve traverses from one surrounding tissue type to another (auditory nerve entering and exiting the petrous bone at the internal meatus; ABR wave I, possible contribution to wave II), (ii) the pathway branches (trifurcation of the auditory nerve to innervate the three divisions of cochlear nucleus; possible contribution to wave III), (iii) the tract bends (lateral lemniscus turning rostral; wave IV, possible contribution to wave V), or (iv) the nerve fibers end to a nucleus (auditory nerve entering brainstem; wave II, lateral lemniscus terminating to inferior colliculus; wave V) or due to a lesion (cut‐end potentials).
Dipole models of some of the mABR waves were linked with anatomically plausible locations. However, the field patterns indicated, as reported earlier [Lütkenhöner et al., 2000; Scherg and von Cramon, 1985], that a single equivalent current dipole may not be a satisfactory source for the later ABR/mABR waves as there probably are several simultaneously active generator sites in the neural structures. Furthermore, the different conductivities of the brain tissue (0.3 S/m employed here) and the cerebrospinal fluid [1.8 S/m; Baumann et al., 1997] in the fourth ventricle, close to the observed wave V source region, may contribute to the localization error. When interpreting the locations, the limitations of the models should be kept in mind.
An alternative modeling approach could be based on an anatomically and structurally informed generative model of the auditory pathway. The parameters of such a model would be obtained by fitting the model to the measured MEG data.
ABR Generators
MEG recordings allowed noninvasive source localization in individual subjects. The earliest responses were clearly lateralized to the stimulated side (left) whereas the field patterns from 4 ms onward indicated activity on both sides.
The magnetic recordings did not exhibit a distinct peak at the nominal latency of wave I while such a response was evident in the simultaneously acquired electric data; however, the grand‐average response across all magnetometer channels and subjects deviated significantly from the baseline already at this latency. Thus, the first peaks in the magnetic signal, temporally coinciding with the trough following electrical wave I, also denoted as wave I‐, apparently reflects a combination of the sources underlying waves I and II, oriented more favorably for MEG at this latency. The estimated sources at the peak at about 2.4 ms in four subjects suggest an origin in, or at least a contribution from, the auditory nerve ipsilateral to the stimulation at the conductivity boundaries of the poorly conducting skull bone, the highly conductive cerebrospinal fluid and the brainstem tissue, in line with previous observations [Hashimoto et al., 1981; Martin et al., 1995; Scherg and von Cramon, 1985; Zappia et al., 1996].
The source of the magnetic response corresponding to wave II of the ABR localized in the vicinity of the cochlear nucleus, suggesting a close connection between near‐field activity in the cochlear nucleus and far‐field ABR recordings at this latency [Møller and Jannetta, 1983].
Magnetic responses in the latency range of the ABR wave V were evident in all subjects. The field patterns showed a clear lateralization to the side contralateral to the stimulation. Modeling with ECDs indicated source locations posterior and lateral to lateral lemniscus and inferior colliculus (IC) on the contralateral side. These findings parallel (i) the disappearance of wave V to left ear stimulation after obliteration of right IC [Durrant et al., 1994], (ii) the changes due to unilateral lesions in lateral lemniscus [Voordecker et al., 1988] or in IC, brachium colliculi and medial geniculate body [Fischer et al., 1995], and (iii) the results from patients with plaques of multiple sclerosis rostral to superior olivary complex and trapezoid body [Levine et al., 1993]. The contralateral origin of wave V is also in line with subdural recordings from the basal temporal surface [Zappia et al., 1996] and with the dominant response of contralateral IC in fMRI [Langers et al., 2005]. Our results do not support conclusions of dominant ipsilateral IC activation as suggested by midbrain lesions [Markand et al., 1989], or positron emission tomography activation [Giraud et al., 2000]. Ipsilateral lesions may still have an effect on the shape of wave V; lesioned cochlear nucleus and cut‐end potentials in a lesioned lateral lemniscus have been suggested to explain why stimuli ipsilateral, but not contralateral, to the lesion produced an altered wave V in some studies [Møller and Jannetta, 1983].
The observed largely horizontal orientations, with a small upward component, of the wave V dipoles are compatible with the orientation estimates based on subdural recordings [Zappia et al., 1996] and differ only slightly from the orientation suggested by modeling scalp EEG [Scherg and von Cramon, 1985], which may result from the different sensitivities of MEG and EEG to radial source currents. Similar correspondence to the EEG‐based model [Scherg and von Cramon, 1985] was evident for the orientations of wave I‐ and II. Since the EEG sources were constrained to a plane and the locations were shown only schematically and as relative to other sources, we did not compare these locations to our MEG sources.
The latency differences between some of the magnetic and electric ABR peaks could be attributed to a turning and/or moving source which reaches the maximum coupling to our EEG and MEG sensors at different orientations and thus at different latencies. Similarly, an evolving cluster of sources could give rise to latency differences.
Latency and location of the mABR sources allow for coarse estimation of the conduction velocity along the auditory tract. In Subject 1, the Euclidean distance between the ECD sources of wave II and V was 39 mm, and the corresponding temporal difference 5.8–3.0 = 2.8 ms. Accounting for one synaptic delay [0.8 ms; Møller, 2007] in the cochlear nucleus, the lower bound for the conduction velocity becomes 19 m/s. The true velocity is likely somewhat higher as the tract does not follow a straight line and is thus longer than assumed here; in adults, the axons originating in the cochlear nucleus traverse at least 46 mm to reach the contralateral IC [Moore, 1987]. Our velocity estimate is comparable to the direct measurement of 22 m/s along the intracranial portion of the VIII nerve [Møller et al., 1994].
Clinical uses of ABRs include hearing screening, hearing threshold estimation, differentiation of conductive, sensorineural and retrocochlear disorders, particularly auditory neuropathies, and intraoperative monitoring during cerebellopontine angle surgery. The equipment to obtain electric ABRs is relatively inexpensive and thus accessible for screening purposes [Burkard and Secor, 2006], particularly in developing countries [Pitkäranta et al., 2007]. Uncertainty of the generator sites of the ABRs reduces their diagnostic value. Our source localizations based on MEG may help to interpret the electric ABRs and thus facilitate their clinical use.
Absence of Thalamic Responses
No responses indicating activation of medial geniculate body (MGB) were apparent in our source analysis. Wave VI, present only in one subject in our magnetic data, has been associated with activity in the MGB although in direct recordings the amplitude of the MGB signal contemporous to wave VI drops quickly when retracting the electrode [Hashimoto et al., 1981]. Other studies have shown that wave VI is more likely generated in the contralateral IC [Møller and Jannetta, 1982], implying that MGB activity occurs somewhat later. In direct recordings from the vicinity of the MGB and lateral geniculate body, electric activity elicited by short pure tones has been detected at 13 ms and onward. These responses were interleaved with cortical activity recorded from Heschl's gyri [Yvert et al., 2002]. MGBs are activated in auditory fMRI studies [e.g., Sigalovsky and Melcher, 2006]. A probable explanation for the lack of the MGB responses in our data is that the neuronal currents in the nucleus form roughly symmetric patterns (closed fields) and the associated magnetic and electric fields decay rapidly as a function of distance and are not detectable on the head surface. Alternatively, it is possible that some of this activity was merged with the magnetic signal at about 6 ms and contributed to the lateral shift of the estimated source of wave V; multiunit activity occurs already at 5.5–10 ms in the human MGB in response to a stimulus contralateral to the recording site whereas ipsilateral stimulation elicits activity 14–16 ms post‐stimulus [Velasco et al., 1982].
Early Cortical Responses
The first cortical activations were already observed at 13 ms in two subjects. The finding corroborates the previous estimates of the earliest cortical auditory evoked fields at 11 ms [Kuriki et al., 1995]. Our data showed a roughly dipolar field pattern starting at 13 ms after the stimulus onset and strengthening into the N17m response without an appreciable change in the source orientation. The corresponding sources were medial to the sources of the 30‐ms responses but still in the supratemporal auditory cortex. Deflections at 8–10 ms [Celesia, 1976], at 13 ms [Godey et al., 2001], or at 8–14 ms [Brugge et al., 2008] after stimulus onset have also been observed in direct cortical recordings from the medial tip of the Heschl's gyrus.
Even with the 30‐Hz high‐pass filtering employed here, the steady‐state response in one subject contaminated the pre‐stimulus baseline thus rendering it impossible to isolate the earliest cortical contribution. Such contamination is a likely confound at short interstimulus intervals unless removed by proper filtering.
The scalp‐negative, or slow brainstem response, SN10 follows wave V in ABR recordings, and may extend up to 15 ms at low stimulus intensities. Its amplitude depends strongly on the recording parameters but may be useful in estimating low‐frequency hearing thresholds [Tawfik and Musiek, 1991]. The response has been attributed to asynchronous activities in the brainstem nuclei [Suzuki et al., 1977], mainly in the inferior colliculus [Davis and Hirsh, 1979; Hashimoto, 1982; Møller and Jannetta, 1982]. The slowness, relative to the preceding deflections, of the response [50–150 Hz; Tawfik and Musiek, 1991] has been suggested to indicate imprecise synchronization and a composite of overlapping waves belonging to middle components of the ABRs [Klein, 1983]. No polarity reversals of this deflection have been reported in intraoperative recordings. Our data from two subjects indicate emerging cortical activity at a time range partly overlapping the typical SN10 latencies; it is possible that the cortical activity is reflected in the ABR recordings as well. During sleep, SN10 is reduced in amplitude and is more difficult to elicit than in the awake state [Klein, 1983] which parallels the behavior of cortical evoked responses.
CONCLUSIONS
Our data confirm that magnetic ABRs are recordable with modern MEG devices that contain magnetometers and that their sources can be localized in individual subjects. The estimated source locations of waves I‐, II, and V match with the generator sites expected based on near‐field recordings and simultaneous surface‐EEG recordings. In particular, the results indicate that wave V is generated contralateral to the stimulated ear in our healthy subjects and suggest a contribution of cortical electric activity to the SN10 response. Success in recording activity from the auditory brainstem suggests that also other deep‐seated high‐frequency electric brain activity can be recorded with magnetometers and analyzed in a data‐driven manner with minimal assumptions on the generator structures.
Acknowledgements
We thank Mika Seppä and Matti Hämäläinen for help in processing the MR‐images and Riitta Hari for comments on the manuscript. The anatomical MRIs were acquired in the Advanced Magnetic Imaging Centre of Helsinki University of Technology, and in the Department of Radiology, Helsinki University Central Hospital.
REFERENCES
- Baumann SB,Wozny DR,Kelly SK,Meno FM ( 1997): The electrical conductivity of human cerebrospinal fluid at body temperature. IEEE Trans Biomed Eng 44: 220–223. [DOI] [PubMed] [Google Scholar]
- Brugge JF,Volkov IO,Oya H,Kawasaki H,Reale RA,Fenoy A,Steinschneider M,Howard MA ( 2008): Functional localization of auditory cortical fields of human: Click‐train stimulation. Hear Res 238: 12–24. [DOI] [PMC free article] [PubMed] [Google Scholar]
- Burkard R,Secor C ( 2006): Overview of Auditory Evoked Potentials In: Katz J, editor. Handbook of Clinical Audiology. Baltimore: Lippincott Williams & Wilkins; pp. 233–248. [Google Scholar]
- Cacace AT,Satya‐Murti S,Wolpaw JR ( 1990): Human middle‐latency auditory evoked potentials: Vertex and temporal components. Electroencephalogr Clin Neurophysiol 77: 6–18. [DOI] [PubMed] [Google Scholar]
- Celesia GG ( 1976): Organization of auditory cortical areas in man. Brain 99: 403–414. [DOI] [PubMed] [Google Scholar]
- Chiappa K ( 1990): Evoked potentials in clinical medicine. New York: Raven Press. [Google Scholar]
- Collins DL,Neelin P,Peters TM,Evans AC ( 1994): Automatic 3D intersubject registration of MR volumetric data in standardized Talairach space. J Comput Assist Tomogr 18: 192–205. [PubMed] [Google Scholar]
- Davis H,Hirsh SK ( 1979): A slow brain stem response for low‐frequency audiometry. Audiology 18: 445–461. [DOI] [PubMed] [Google Scholar]
- Delgado RE,Ozdamar O ( 2004): Deconvolution of evoked responses obtained at high stimulus rates. J Acoust Soc Am 115: 1242–1251. [DOI] [PubMed] [Google Scholar]
- Durrant JD,Martin WH,Hirsch B,Schwegler J ( 1994): 3CLT ABR analyses in a human subject with unilateral extirpation of the inferior colliculus. Hear Res 72: 99–107. [DOI] [PubMed] [Google Scholar]
- Eggermont JJ ( 2007): Electric and Magnetic Fields of Synchronous Neural Activity: Peripheral and Central Origins of Auditory Evoked Potentials In: Burkard RF, Don M, Eggermont JJ, editors. Auditory Evoked Potentials: Basic Principles and Clinical Application. Baltimore: Lippincott Williams & Wilkins; pp. 2–21. [Google Scholar]
- Enatsu R,Mikuni N,Usui K,Matsubayashi J,Taki J,Begum T,Matsumoto R,Ikeda A,Nagamine T,Fukuyama H,Hashimoto N ( 2008): Usefulness of MEG magnetometer for spike detection in patients with mesial temporal epileptic focus. Neuroimage 41: 1206–1219. [DOI] [PubMed] [Google Scholar]
- Erné SN,Hoke M ( 1990): Short‐latency evoked magnetic fields from the human auditory brainstem. Adv Neurol 54: 167–176. [PubMed] [Google Scholar]
- Erné SN,Scheer HJ,Hoke M,Pantev C,Lütkenhöner B ( 1987): Brainstem auditory evoked magnetic fields in response to stimulation with brief tone pulses. Int J Neurosci 37: 115–125. [DOI] [PubMed] [Google Scholar]
- Eysholdt U,Schreiner C ( 1982): Maximum length sequences—a fast method for measuring brain‐stem‐evoked responses. Audiology 21: 242–250. [DOI] [PubMed] [Google Scholar]
- Fischer C,Bognar L,Turjman F,Lapras C ( 1995): Auditory evoked potentials in a patient with a unilateral lesion of the inferior colliculus and medial geniculate body. Electroencephalogr Clin Neurophysiol 96: 261–267. [DOI] [PubMed] [Google Scholar]
- Fischl B,Salat DH,van der Kouwe AJW,Makris N,Ségonne F,Quinn BT,Dale AM ( 2004): Sequence‐independent segmentation of magnetic resonance images. Neuroimage 23( Suppl 1): S69–S84. [DOI] [PubMed] [Google Scholar]
- Fobel O,Dau T ( 2004): Searching for the optimal stimulus eliciting auditory brainstem responses in humans. J Acoust Soc Am 116: 2213–2222. [DOI] [PubMed] [Google Scholar]
- Giraud AL,Truy E,Frackowiak RS,Grégoire MC,Pujol JF,Collet L ( 2000): Differential recruitment of the speech processing system in healthy subjects and rehabilitated cochlear implant patients. Brain 123(Pt 7): 1391–1402. [DOI] [PubMed] [Google Scholar]
- Godey B,Schwartz D,de Graaf JB,Chauvel P,Liégeois‐Chauvel C ( 2001): Neuromagnetic source localization of auditory evoked fields and intracerebral evoked potentials: A comparison of data in the same patients. Clin Neurophysiol 112: 1850–1859. [DOI] [PubMed] [Google Scholar]
- Grandori F ( 1982): Potential fields evoked by the peripheral auditory pathway: Inverse solutions. Int J Biomed Comput 13: 517–528. [DOI] [PubMed] [Google Scholar]
- Hämäläinen M,Hari R,Ilmoniemi RJ,Knuutila J,Lounasmaa OV ( 1993): Magnetoencephalography—theory, instrumentation, and applications to noninvasive studies of the working human brain. Rev Mod Phys 65: 413–497. [Google Scholar]
- Hashimoto I ( 1982): Auditory evoked potentials recorded directly from the human VIIIth nerve and brain stem: Origins of their fast and slow components. Electroencephalogr Clin Neurophysiol Suppl 36: 305–314. [PubMed] [Google Scholar]
- Hashimoto I,Ishiyama Y,Yoshimoto T,Nemoto S ( 1981): Brain‐stem auditory‐evoked potentials recorded directly from human brain‐stem and thalamus. Brain 104: 841–859. [DOI] [PubMed] [Google Scholar]
- Hashimoto I,Mashiko T,Yoshikawa K,Mizuta T,Imada T,Hayashi M ( 1995): Neuromagnetic measurements of the human primary auditory response. Electroencephalogr Clin Neurophysiol 96: 348–356. [DOI] [PubMed] [Google Scholar]
- Iramina K,Ueno S ( 1995): Measurement of brain‐stem auditory‐evoked magnetic fields using a highly sensitive SQUID magnetometer with a variable base‐line. IEEE Trans Magn 31: 4271–4273. [Google Scholar]
- Jewett DL,Romano MN,Williston JS ( 1970): Human auditory evoked potentials: Possible brain stem components detected on the scalp. Science 167: 1517–1518. [DOI] [PubMed] [Google Scholar]
- Klein AJ ( 1983): Properties of the brain‐stem response slow‐wave component. Arch Otolaryngol 109: 6–12. [DOI] [PubMed] [Google Scholar]
- Kuriki S,Nogai T,Hirata Y ( 1995): Cortical sources of middle latency responses of auditory evoked magnetic field. Hear Res 92: 47–51. [DOI] [PubMed] [Google Scholar]
- Langers DRM,van Dijk P,Backes WH ( 2005): Lateralization, connectivity and plasticity in the human central auditory system. Neuroimage 28: 490–499. [DOI] [PubMed] [Google Scholar]
- Levine RA,Gardner JC,Fullerton BC,Stufflebeam SM,Carlisle EW,Furst M,Rosen BR,Kiang NY ( 1993): Effects of multiple sclerosis brainstem lesions on sound lateralization and brainstem auditory evoked potentials. Hear Res 68: 73–88. [DOI] [PubMed] [Google Scholar]
- Lütkenhöner B,Lammertmann C,Ross B,Pantev C ( 2000): Brain stem auditory evoked fields in response to clicks. Neuroreport 11: 913–918. [DOI] [PubMed] [Google Scholar]
- Mäkelä JP,Hämäläinen M,Hari R,McEvoy L ( 1994): Whole‐head mapping of middle‐latency auditory evoked magnetic fields. Electroencephalogr Clin Neurophysiol 92: 414–421. [DOI] [PubMed] [Google Scholar]
- Markand ON,Farlow MR,Stevens JC,Edwards MK ( 1989): Brain‐stem auditory evoked potential abnormalities with unilateral brain‐stem lesions demonstrated by magnetic resonance imaging. Arch Neurol 46: 295–299. [DOI] [PubMed] [Google Scholar]
- Martin WH,Pratt H,Schwegler JW ( 1995): The origin of the human auditory brain‐stem response wave II. Electroencephalogr Clin Neurophysiol 96: 357–370. [DOI] [PubMed] [Google Scholar]
- Melcher JR,Kiang NY ( 1996): Generators of the brainstem auditory evoked potential in cat. III: Identified cell populations. Hear Res 93: 52–71. [DOI] [PubMed] [Google Scholar]
- Mikuni N,Nagamine T,Ikeda A,Terada K,Taki W,Kimura J,Kikuchi H,Shibasaki H ( 1997): Simultaneous recording of epileptiform discharges by MEG and subdural electrodes in temporal lobe epilepsy. Neuroimage 5: 298–306. [DOI] [PubMed] [Google Scholar]
- Møller A ( 2007): Neural Generators for Auditory Brainstem Evoked Potentials In: Burkard RF, Don M, Eggermont JJ, editors. Auditory Evoked Potentials: Basic Principles and Clinical Application. Baltimore: Lippincott Williams & Wilkins; pp. 336–354. [Google Scholar]
- Møller AR,Colletti V,Fiorino FG ( 1994): Neural conduction velocity of the human auditory nerve: Bipolar recordings from the exposed intracranial portion of the eighth nerve during vestibular nerve section. Electroencephalogr Clin Neurophysiol 92: 316–320. [DOI] [PubMed] [Google Scholar]
- Møller AR,Jannetta PJ ( 1983): Auditory evoked potentials recorded from the cochlear nucleus and its vicinity in man. J Neurosurg 59: 1013–1018. [DOI] [PubMed] [Google Scholar]
- Møller AR,Jannetta PJ ( 1982): Evoked potentials from the inferior colliculus in man. Electroencephalogr Clin Neurophysiol 53: 612–620. [DOI] [PubMed] [Google Scholar]
- Møller AR,Jannetta PJ ( 1983): Interpretation of brainstem auditory evoked potentials: Results from intracranial recordings in humans. Scand Audiol 12: 125–133. [DOI] [PubMed] [Google Scholar]
- Moore JK ( 1987): The human auditory brain stem as a generator of auditory evoked potentials. Hear Res 29: 33–43. [DOI] [PubMed] [Google Scholar]
- Parkkonen L,Simola JT,Tuoriniemi JT,Ahonen AI ( 1999): An interference suppression system for multichannel magnetic field detector arrays In: Yoshimoto T, Kotani M, Kuriki S, Karibe H, Nakasato N, editors. Recent Advances in Biomagnetism. Sendai, Japan: Tohoku University Press; pp. 13–16. [Google Scholar]
- Pelizzone M,Hari R,Mäkelä JP,Huttunen J,Ahlfors S,Hämäläinen M ( 1987): Cortical origin of middle‐latency auditory evoked responses in man. Neurosci Lett 82: 303–307. [DOI] [PubMed] [Google Scholar]
- Pitkäranta A,Pelkonen T,de Sousa E Silva MO,Bernardino L,Roine I,Peltola H ( 2007): Setting up hearing screening in meningitis children in Luanda, Angola. Int J Pediatr Otorhinolaryngol 71: 1929–1931. [DOI] [PubMed] [Google Scholar]
- Scherg M,von Cramon D ( 1985): A new interpretation of the generators of BAEP waves I–V: Results of a spatio‐temporal dipole model. Electroencephalogr Clin Neurophysiol 62: 290–299. [DOI] [PubMed] [Google Scholar]
- Scherg M,Hari R,Hämäläinen M ( 1990): Frequency‐specific sources of the auditory N19‐P30‐P50 response detected by a multiple source analysis of evoked magnetic fields and potentials In: Williamson SJ, Hoke M, Stroink G, Kotani M, editors. Advances in Biomagnetism. New York: Plenum Press; pp. 97–100. [Google Scholar]
- Sigalovsky IS,Melcher JR ( 2006): Effects of sound level on fMRI activation in human brainstem, thalamic and cortical centers. Hear Res 215: 67–76. [DOI] [PMC free article] [PubMed] [Google Scholar]
- Starr A,Achor J ( 1975): Auditory brain stem responses in neurological disease. Arch Neurol 32: 761–768. [DOI] [PubMed] [Google Scholar]
- Suzuki T,Hirai Y,Horiuchi K ( 1977): Auditory brain stem responses to pure tone stimuli. Scand Audiol 6: 51–56. [DOI] [PubMed] [Google Scholar]
- Tawfik S,Musiek FE ( 1991): SN10 auditory evoked potential revisited. Am J Otol 12: 179–183. [PubMed] [Google Scholar]
- Tesche CD ( 1996): Non‐invasive imaging of neuronal population dynamics in human thalamus. Brain Res 729: 253–258. [PubMed] [Google Scholar]
- Uusitalo M,Ilmoniemi R ( 1997): Signal‐space projection method for separating MEG or EEG into components. Med Biol Eng Comput 35: 135–140. [DOI] [PubMed] [Google Scholar]
- Velasco M,Velasco F,Almanza X,Coats AC ( 1982): Subcortical correlates of the auditory brain stem potentials in man: Bipolar EEG and multiple unit activity and electrical stimulation. Electroencephalogr Clin Neurophysiol 53: 133–142. [DOI] [PubMed] [Google Scholar]
- Voordecker P,Brunko E,de Beyl Z ( 1988): Selective unilateral absence or attenuation of wave V of brain‐stem auditory evoked potentials with intrinsic brain‐stem lesions. Arch Neurol 45: 1272–1276. [DOI] [PubMed] [Google Scholar]
- Yvert B,Crouzeix A,Bertrand O,Seither‐Preisler A,Pantev C ( 2001): Multiple supratemporal sources of magnetic and electric auditory evoked middle latency components in humans. Cereb Cortex 11: 411–423. [DOI] [PubMed] [Google Scholar]
- Yvert B,Fischer C,Guénot M,Krolak‐Salmon P,Isnard J,Pernier J ( 2002): Simultaneous intracerebral EEG recordings of early auditory thalamic and cortical activity in human. Eur J Neurosci 16: 1146–1150. [DOI] [PubMed] [Google Scholar]
- Zappia M,Cheek JC,Lüders H ( 1996): Brain‐stem auditory evoked potentials (BAEPs) from basal surface of temporal lobe recorded from chronic subdural electrodes. Electroencephalogr Clin Neurophysiol 100: 141–151. [DOI] [PubMed] [Google Scholar]