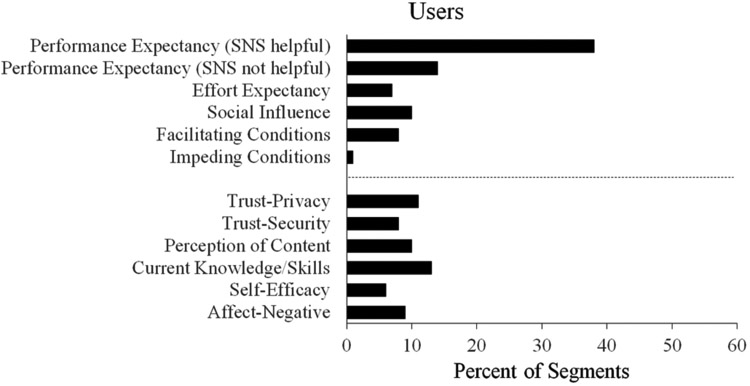
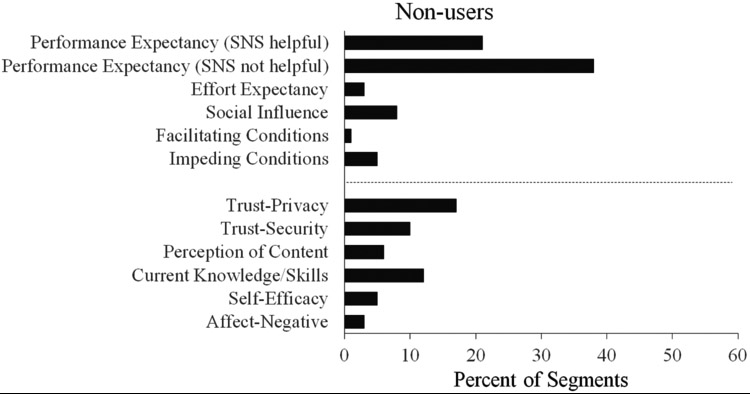
Figure 2.
The frequency that each category occurred in the segments relating to social networking sites for both users (Figure 2A) and non-users (Figure 2B). Categories were not mutually exclusive, so a segment could contain instances from multiple categories (i.e., each category could have a frequency ranging from 0% to 100%). Categories derived from the UTAUT model are presented above the dashed line; additional categories are presented below the dashed line. *SNS = social networking sites.


