

Abstract
This study investigated test–retest functional magnetic resonance imaging (fMRI) reproducibility in 10 healthy older adults and in 10 mild cognitive impairment (MCI) persons using a two‐condition (encoding and retrieval) verbal episodic memory task as well as a two‐condition (with and without a motor response) phonological processing task. Reproducibility measures included an overlap ratio with four different thresholds, statistical comparisons of the condition contrasts across sessions (test–retest contrasts), ANCOVAs, and intraclass correlation (ICC) on selected regions of interests (ROIs). In all four conditions and for all reproducibility measures, MCI individuals showed fMRI test–retest reproducibility indices that were comparable to those of healthy older adults. At the group level, the comparison of the test–retest condition contrasts yielded very few differences in the areas and level of activation and those differences tended to show a slight reduction of activation in the second session. In addition, the results from the ANCOVAs showed that the fMRI signal measured at the group level does not vary significantly from one session to another. Overlap ratios, however, showed that the fMRI signal failed to produce a reliable pattern of significantly activated voxels across sessions. ICC analyses on selected ROIs indicated that there is high within‐subject variability, suggesting reduced reliability at the individual level. Overall, these findings indicate that MCI individuals show fMRI test–retest reproducibility comparable to those of healthy controls and hence that MCI do not alter fMRI reproducibility. Furthermore, they indicate that monitoring treatment effects is reliable when comparing groups but reduced when comparing single individuals. These results have precise implications for the design of longitudinal studies relying on fMRI measures in older adults. Hum Brain Mapp, 2009. © 2009 Wiley‐Liss, Inc.
Keywords: neuroimaging, dementia, ageing, memory, cognition
INTRODUCTION
There is increasing interest in the use of functional magnetic resonance imaging (fMRI) as a diagnostic tool for age‐associated cognitive disorders. This technique also yields considerable interest as a potential marker for therapeutic treatment of age‐related neurodegenerative diseases, such as Alzheimer's disease (AD) or mild cognitive impairment (MCI).
People with MCI show greater cognitive decline than expected relative to people of the same age and education level. Indeed, MCI has been identified as a risk factor for the development of AD as it has been shown that a large proportion of persons who meet the clinical criteria for MCI will progress to dementia [Gauthier et al., 2006]. No cure has yet been found for AD, though a number of studies have investigated the possibility of pharmaceutical [e.g. Gron et al., 2006; Saykin et al., 2004] and nonpharmaceutical interventions [e.g. Ball et al., 2002; Belleville et al., 2006; Craik et al., 2007; Rapp et al., 2002] to enhance mnesic abilities in healthy older adults and in persons with MCI or to at least slow the initial rate of progression toward AD [Petersen and Morris, 2005]. With the advancement of neuroimaging technologies, it is now possible to quantify cognitive decline and the effects of a given intervention in terms of changes in cerebral activation, in addition to characterizing modifications in behavior [e.g. Goekoop et al., 2004, 2006; Gron et al., 2006; Saykin et al., 2004]. Neuroimaging techniques could become useful clinical tools for quantifying longitudinal cerebral activation changes associated with a disease or intervention effects. However, the use of fMRI in clinical and research studies that involve repeated measures requires firm evidence that measures of brain activation in those populations are reliable indicators and do not vary in test–retest measurements. More precisely, it is crucial to know whether or not the fMRI signal is reproducible, i.e. if two fMRI sessions produce comparable activations.
The vast majority of fMRI reliability studies have been performed on young healthy subjects performing a variety of cognitive and noncognitive tasks, including sensory tasks [Kiehl and Liddle, 2003; Miki et al., 2000; Rombouts et al., 1997, 1998; Specht et al., 2003; Stark et al., 2004; Waldvogel et al., 2000; Yetkin et al., 1996], motor tasks [Havel et al., 2006; Liu et al., 2004; Loubinoux et al., 2001; Raemaekers et al., 2007; Swallow et al., 2003; Waldvogel et al., 2000; Yetkin et al., 1996], memory tasks [Machielsen et al., 2000; Miller et al., 2002; Wagner et al., 2005], executive function tasks [Aron et al., 2006; Neumann et al., 2003; Wei et al., 2004], and language tasks [Maldjian et al., 2002; Rutten et al., 2002]. These studies generally report a reasonably good, though not perfect, reproducibility of fMRI cerebral activations.
Although there is no general consensus as to the appropriate method that should be used to assess fMRI reproducibility across sessions, many studies [Fernandez et al., 2003; Havel et al., 2006; Machielsen et al., 2000; Miki et al., 2000; Raemaekers et al., 2007; Rutten et al., 2002; Specht et al., 2003; Swallow et al., 2003; Wagner et al., 2005; Yetkin et al., 1996] have used the overlap ratio initially used by Rombouts et al. [1997] that measures reproducibility in the number and location of voxels by comparing voxels activated in both sessions to those activated in only one of them. Overall, the overlap ratio does not vary widely though there is some task‐related effect with higher overlap ratios found when using sensorimotor tasks [e.g. from 0.48; Miki et al., 2000, to 0.64; Rombouts et al., 1998] relative to higher level cognitive tasks [e.g. from 0.36; Machielsen et al., 2000; Wagner et al., 2005 to 0.42; Wagner et al., 2005, in the case of memory tasks). Another fMRI reproducibility method that has been used by many researchers is the intraclass correlation (ICC) [Aron et al., 2006; Fernandez et al., 2003; Kong et al., 2007; Manoach et al., 2001; Raemaekers et al., 2007; Specht et al., 2003; Wei et al., 2004]. ICC assesses fMRI activation reliability by comparing the between‐subject variance to total variance and it is therefore higher when within‐subject variance is low and between‐subject variance is high. In healthy subjects, the ICC seems to vary greatly from one study to another and from one region to another.
Reliance on repeated scans is likely to be particularly vital in clinical populations as researchers are attempting to elucidate the brain‐related effects of disease evolution and/or of treatment. Nevertheless, the reproducibility of fMRI signal in patients has not been extensively studied and thus remains largely unknown. We are aware of only four studies conducted on different clinical populations: patients with schizophrenia [Manoach et al., 2001], patients with stroke [Chen and Small, 2007], patients with focal epilepsy [Fernandez et al., 2003], and patients with chronic nonfluent aphasia [Kurland et al., 2004]. The results of these studies suggest that patients show less reliable activations across sessions than healthy participants, possibly due to unstable brain compensation, greater head movement than controls, and more variability in task performances. However, all of these patients suffered from chronic symptoms, hence it is difficult to transpose these results to a population with a slowly evolving disease; furthermore, very little is known about the impact of aging on fMRI reproducibility. Indeed, only one study assessed fMRI reproducibility in healthy older adults using an N‐Back working memory task and a finger‐tapping task [Marshall et al., 2004]. These studies concluded that across‐session fMRI reproducibility in older adults is similar to the one reported in young subjects. More studies are required to extend these findings to other cognitive functions in elderly people and to know whether these results also apply to MCI individuals.
The goal of this study was to assess the reproducibility of fMRI signal in healthy older adults and in MCI persons with a verbal memory task, a cognitive task typically used as a diagnostic marker of dementia, with both an encoding and a retrieval condition. A phonological processing task was also used. This is a task that is typically unimpaired in MCI and early AD and that can provide indications regarding reproducibility values in unimpaired conditions. Two conditions were also used in the phonological task: one that included a motor response and one that did not include a motor response because memory conditions also included either a motor response (in the retrieval condition) or no motor response (in the encoding condition). This allowed us to assess the relative contribution of the motor response component to the overlap ratio of the memory and phonological tasks. These paradigms were used because, as mentioned earlier, tasks with a motor response tend to produce higher overlap ratios than tasks with no motor component. It was therefore important to ensure that task differences in reproducibility were not related to the motor component. Reproducibility was assessed in each group using the overlap ratio measure, statistical comparisons of the condition contrasts across sessions, as well as ICC measure and statistical comparison of the beta values in selected regions‐of‐interest (ROI) that are known to be involved in verbal memory and/or phonological processing [Cabeza and Nyberg, 2000]: Broca's area (area 44), the left and right ventrolateral prefrontal cortex (BA 45, 47), the left and right dorsolateral prefrontal cortex (BA 9, 46), the precuneus bilaterally, the posterior cingulate cortex bilaterally, and the hippocampus bilaterally. As the overlap ratio method can be threshold sensitive, overlap ratio measures were done using four different threshold values. We first hypothesized that healthy older adults and MCI persons would both show relatively good fMRI reproducibility of a similar magnitude as those observed in the literature with younger adults; moreover, we also hypothesized that conditions that included a motor response would show a higher overlap ratio than conditions that did not include a motor response, because of the higher fMRI reproducibility of sensorimotor cortices. Lastly, we predicted that the statistical comparisons of the condition contrasts across sessions would highlight a reduction of activation in some areas from the first to the second session, in accordance with the literature [see Kelly and Garavan, 2005].
METHOD
Participants
A total of 20 participants, 10 MCI persons and 10 healthy older adults participated in this study. Persons with MCI (three males) had a mean age of 67.20 years (SD = 8.03, median = 68, range = 51–74) and had a mean of 13.70 (SD = 3.8, median = 12, range = 9–18) years of education. Healthy older adults (2 males) had a mean age of 71.20 years (SD = 7.25, median = 69, range = 58–80), with an average of 12.90 (SD = 2.5, median = 13, range = 8–20) years of education. French was the first language of all participants.
Participants with MCI were recruited from memory clinics and met the criteria proposed by Petersen et al. [1999] for amnestic single or multiple domain MCI: (1) they had a memory complaint; (2) they performed at least 1.5 SD below the average level of persons of similar age and education on standardized memory tests; (3) they showed no global cognitive impairment on the basis of the MMSE (using the age‐ and education‐adjusted cutoff for dementia); (4) nor any significant impact on daily functions as measured by the SMAF functional impairment scale and clinical interview; (5) they failed to meet criteria for dementia. MCI participants went through an extensive neuropsychological evaluation that covered episodic memory [a cued and free word recall task: RL/RI‐16; Buschke, 1984; Van der Linden et al., 2004, a text memory of the BEM; Signoret, 1991, and the recall of Rey's Complex Figure; Rey, 1959], executive functions [third set of Victoria Stroop; Regard, 1981, and copy of Rey's Complex Figure; Rey, 1959], visuospatial processing [Benton Judgment of line orientation; Benton et al., 1983], information processing speed [Coding of the WAIS‐III; Wechsler, 1997], language [Boston Naming Test; Kaplan et al., 1983], and global cognitive functions [Mattis Dementia Rating Scale, MDRS; Mattis, 1976, and Mini‐Mental State Examination, MMSE; Folstein et al., 1975]. In addition, depressive symptoms were assessed with the Geriatric Depression Scale [GDS; Yesavage, 1988] and vascular risk factors were assessed with the Hachinski questionnaire [Hachinski et al., 1975]. MCI persons also went through an extensive medical, neurological, and neuroradiological examination to exclude the presence of any significant systemic, neurological, or psychiatric condition that could explain their cognitive difficulties.
Elderly controls were recruited from the community. They also completed a clinical and a partial neuropsychological assessment (MDRS, MMSE, MOCA, GDS, RL/RI‐16) to ensure that they did not suffer from cognitive deficits. Exclusion criteria included past history of psychiatric or neurological disorders, including traumatic brain injury and depression. This study was approved by the Institut Universitaire de Gériatrie de Montréal Human Ethics Committee and was part of a larger intervention study as a control condition.
Stimuli
Six lists of eight concrete, one‐ to three‐syllable words were created for the learning phase of the memory task. The six lists were matched in terms of mean word frequency, semantic category and concreteness of the words in the list. Six lists of eight concrete, one‐ to three‐syllable words were created for the retrieval phase. Half of the words used in the retrieval lists were part of the encoding list and half were new words. The new words were matched to the old words in terms of the relevant linguistic dimensions (syllabic length, frequency, and concreteness).
Twelve lists of six pseudo words were created for the phonological processing task. Six were used in the motor response condition and six were used in the no‐response condition. The pseudo words were matched to the words used in the memory task in terms of the relevant linguistic dimensions (length, phonological complexity, and frequency of the words from which they were derived).
Two parallel versions of the memory lists were used in this study and were counterbalanced across subjects so that each list was presented to equivalent number of participants on each session.
Neuroimaging Procedure
The task was programmed on E‐prime and stimuli were visually presented and mirror‐projected. Subjects' vision was corrected with goggles appropriate for MRI scanning. During rest, subjects were instructed to close their eyes and to try not to think about anything. During phonological processing without a motor response, subjects were instructed to read covertly a series of pseudo words. During phonological processing with a motor response, subjects were instructed to read covertly a series of pseudo words and to press randomly using a two‐button response. Each phonological processing block or series contained six pseudo words (4 s presentation rate, 1 s interstimulus interval). There were six blocks for a total of 36 pseudo words. During memory encoding, subjects were asked to memorize series of visually presented words. Each encoding block or series contained eight words (4 s presentation rate, 1 s interstimulus interval). There were six encoding blocks for a total of 48 words. During memory retrieval, subjects were asked to perform an old‐new recognition judgment of visually presented words using a two‐button response. Each retrieval block or series contained eight words (4 s presentation rate, 1 s interstimulus interval), half of which were presented in the preceding encoding blocks, half of which were new. There were six retrieval blocks for a total of 48 words.
Subjects performed the task in a blocked design with one encoding run and one retrieval run. The encoding run was composed of six alternating block series of rest, phonological processing without a motor response, and intentional encoding (i.e. six series of: rest, 〈task1〉, 〈task2〉) with each session lasting 28 s, 30 s, and 40 s, respectively. In addition, a brief instruction (4 s) was presented to the subjects prior to each block. A retrieval run composed of six alternating block series of rest, phonological processing with a motor response, and retrieval followed by the encoding run. The rest, phonological processing with a motor response, and retrieval blocks lasted 28 s, 30 s, and 40 s, respectively, and were preceded by instructions. Two days prior to scanning and just before the scanning session, subjects were trained using an fMRI simulator. The whole procedure was repeated again 6‐weeks later.
Data Acquisition
Magnetic resonance imaging (MRI) was performed using a SIEMENS 3T Magnetom TRIO System (Erlangen, Germany) at the Unité de Neuroimagerie Fonctionnelle (UNF) of the Institut Universitaire de Gériatrie de Montréal. Functional MR images were acquired using Gradient‐Echo Echo‐Planar imaging sequences (GE‐EPI) sensitive to blood oxygen level‐dependent (BOLD) contrast (TR/TE = 2,000/30 ms, flip angle = 90°; 31 interleaved slices, voxel size = 3.75 mm × 3.75 mm × 5 mm with a gap of 1 mm, field of view = 240 mm, matrix = 64 × 64). A 3D structural image was taken at the end of the two runs using a sagittal T1‐weighted 3D‐MPRAGE sequence was obtained (TR/TE = 1950/3.93 ms, flip angle = 15°; 176 slices, voxel size = 1 mm × 1 mm × 1 mm, field of view = 256 mm, matrix = 256 × 256).
Image Processing and Data Analysis
Data were analyzed in MATLAB 7.0 (http://www.mathworks.com) using the statistical parametric mapping software SPM2 (http://www.fil.ion.ucl.ac.uk/spm/). The first three volumes were automatically discarded by the fMRI scanner to allow the magnetization to reach equilibrium. The remaining functional images were first converted into analyze format and unwarped. Functional volumes of each subject were then realigned to the first acquired volume in the session and a mean realigned volume was created for each subject. All the realigned volumes of each subject were spatially normalized into the Montreal Neurological Institute (MNI) stereotactic space and spatially smoothed with an 8‐mm Gaussian kernel. Low‐frequency noise was removed with a high‐pass filter of 256 s. Global changes in fMRI response from scan to scan were removed by proportionally scaling each volume to a common global mean voxel value. A single‐subject analysis was carried out to evaluate the individual contrasts (encoding vs. rest, retrieval vs. rest, phonological processing without a motor response vs. rest, and phonological processing with a motor response vs. rest) for each subject. The instruction blocks were modeled as a condition of no interest. A random effects (RFX) analysis was then performed by calculating, for each group (healthy older adults and MCI), a one way ANOVA with eight conditions (encoding session 1, encoding session 2, retrieval session 1, retrieval session 2, phonological processing without a motor response session 1, phonological processing without a motor response session 2, phonological processing with a motor response session 1, phonological processing with a motor response session 2), with nonsphericity correction, replications over subjects, and with correlated repeated measures. To visualize the area of overlapping volume for each group, an inclusive mask of the first and second measurement of encoding, retrieval, and phonological processing with and without a motor response was performed. This analysis has been used previously to assess the reliability of a verbal episodic memory task in young adults [Wagner et al., 2005]. An uncorrected threshold of P < 0.001 with 10 contiguous voxels was used for both the overlap ratio and the test–retest comparison. The overlap ratio method was also recalculated with uncorrected thresholds of P < 0.005, P < 0.0001, and P < 0.00001, all with 10 contiguous voxels.
Test–Retest Reliability Measures
Overlap ratio
The relative amount of overlapping volume R between two activation SPM maps was calculated according to a method introduced by Rombouts et al. [1997] based on Dice coefficient (D) [Dice, 1945]:
where V i is the number of suprathreshold voxels within SPM(t) maps in session i,V j is the number of suprathreshold voxels within SPM(t) maps in session j, and V overlap is the number of suprathreshold voxels in both maps. The overlap ratio can range from 0 to 1 and is based strictly on the location of significantly activated voxels and not on the actual t values of these voxels. Overlap ratios were also converted to Jaccard coefficients (J), which are the ratio of the size of the intersection divided by the size of the union of activated voxels:
where S 1 represents the activated voxels of the first fMRI session and S 2 represent the activated voxels of the second fMRI session. The Jaccard coefficient has been used in structural imaging for tissue classification [Shattuck et al., 2001] but has not, to our knowledge, been used yet as an index of reliability for functional neuroimaging. The conversion from the overlap ratio (or more precisely from the Dice coefficient) can be performed with the following formula:
Or:
In contrast to the overlap ratio, the Jaccard coefficient can be directly interpreted as the percentage of the voxels that are activated during both sessions (e.g. J = 0.21 = 21% of the voxels activated during both sessions).
Test–retest comparison
One limitation of the overlap ratio is that thresholding an image can exaggerate very small differences and hence lead to considerable differences in the size of the overlap ratio obtained. For instance, a voxel can show very similar signal strength during two sessions but with one signal being slightly below the threshold and the other one being slightly above. The calculation of the overlap ratio would consider this voxel as being inconsistent from one session to another, despite the fact that its signal strength was similar. For this reason, we also compared the SPM(t) encoding, retrieval, and phonological processing with and without motor response contrasts of both sessions.
Beta values comparisons and ICCs in ROIs
A ROI image of Broca's area (area 44), of the left and right ventrolateral prefrontal cortex (BA 45, 47), of the left and right dorsolateral prefrontal cortex (BA 9, 46), of the precuneus bilaterally (BA 7), of the posterior cingulate cortex bilaterally, and of the hippocampus bilaterally were created with WFU Pickatlas [Maldjian et al., 2003]. Then, the average beta values of the ROIs were extracted with marsbar [Brett et al., 2002] for each group and for each condition during both sessions. Three‐way mixed ANCOVAs with group (controls, MCI) as a between‐subject factor, session (1, 2) and condition (encoding, retrieval, phonological processing without a motor response, and phonological processing with a motor response) as within‐subject factors, and age and education as covariates were performed in SPSS 13.0 (http://www.spss.com) to assess possible group differences as well as reliability of the beta values from session 1 to session 2. Shrout‐Fleiss two‐way single measure absolute agreement random ICC model (2,1) were also performed on the average beta values of each ROIs for each subject and for each session. The unit of observation was the subject. F‐tests reference test‐value was set to 0 with a confidence interval of 95%. The ICC analyses were also performed in SPSS 13.0.
RESULTS
Sociodemographic Data
To assess whether the groups differed on age and education, two t‐tests were performed on these two variables. No significant age, t(18) = 1.38, N.S., or education effect, t(18) = −0.88, N.S., were found. This indicates that the control group was age‐ and education‐matched to the MCI group.
Neuropsychological Evaluation
Independent t‐tests were also performed on the neuropsychological evaluation scores obtained by the two groups. MCI participants obtained significantly lower scores than healthy controls on the MDRS, t(18) = 2.48, P < 0.05, MMSE, t(18) = 2.63, P < 0.05, third free recall of the RL/RI‐16, t(18) = 2.71, P < 0.05, and on the delayed recall of the RL/RI‐16, t(18) = 3.41, P < 0.01 (Table I).
Table I.
Scores on the neuropsychological tasks for the two groups
| Controls (n = 10) | MCI (n = 10) | |
|---|---|---|
| MDRS (/144) | 140.40 (3.10) | 133.30 (8.51) * |
| MMSE (/30) | 29.10 (0.74) | 27.60 (1.65) * |
| MOCA (/30) | 26.75 (1.75) | |
| GDS (/15) | 1.38 (2.45) | 3.29 (2.98) |
| Hachinski (/18) | 2.20 (2.57) | |
| Boston naming test (/15) | 12.40 (2.68) | |
| BEM immediate recall (/12) | 6.62 (1.19) | |
| BEM delayed recall (/12) | 5.69 (1.36) | |
| RL/RI‐16 3rd free recall (/16) | 12.20 (1.87) | 7.80 (4.78)* |
| RL/RI‐16 delayed free recall (/16) | 13.50 (1.18) | 8.50 (4.48)** |
| Copy of Rey's Figure: time | 241.30 (123.54) | |
| Copy of Rey's Figure: score (/36) | 28.30 (4.18) | |
| Stroop 3rd plate time | 37.11 (19.02) | |
| Stroop 3rd plate errors | 2.60 (3.06) | |
| Benton judgment of line orientation (/30) | 20.70 (4.67) | |
| Coding (WAIS‐III, scaled score) | 9.30 (2.21) |
SD is in parenthesis.
Impairment relative to the controls at *P < 0.05 and **P < 0.01.
Behavioral Data
The mean percentage of correctly recognized words was 72.07% (SD = 10.95) in the first session and 76.88% (SD = 10.24) in the second session for the control group and 67.20% (SD = 11.92) in the first session and 71.63% (SD = 12.04) in the second session for the MCI group.1 A two‐way mixed ANOVA with group (controls, MCI) as a between‐subject factor and session (1, 2) as a within‐subject factor was performed to assess whether task performances were equivalent across groups and sessions. No significant group effect, F(1,16) = 1.11, N.S., session effect, F(1,16) = 4.09, N.S., or group by session interaction, F(1,16) = 0.01, N.S, were found. Therefore, the two groups performed at a similar level during the two sessions and there was no behaviorally evident training effect.
Neuroimaging Data and Test–Retest Comparisons
Memory encoding
The activations for the memory encoding condition for sessions 1 and 2 of the healthy controls group (a and b respectively) and of the MCI group (c and d respectively) are shown in Figure 1. Overall, healthy controls showed activations in a frontotemporoparietal network commonly observed in episodic memory task (medial temporal lobe, anterior and posterior cingulate gyrus, precuneus, supramarginal and angular gyri, medial prefrontal cortex, and premotor areas) as well as in the occipital lobe, in subcortical structures (basal ganglia and thalamus), and in the right cerebellum. The MCI group activated the same frontotemporoparietal network during both sessions, but also showed additional activations in the prefrontal cortex (inferior prefrontal gyrus, dorsolateral prefrontal cortex, and orbitofrontal regions). Statistical comparison of the two sessions for each group yielded few results as is illustrated in Table II: healthy controls showed more activation in the putamen and in the left inferior and middle temporal gyri (Brodmann's area 21) in the first session than in the second session and MCI persons showed more activation during the first session than during the second session in the left middle frontal gyrus (Brodmann's area 11). The results of the first session are described in more details elsewhere (Clement et al., submitted for publication).
Figure 1.
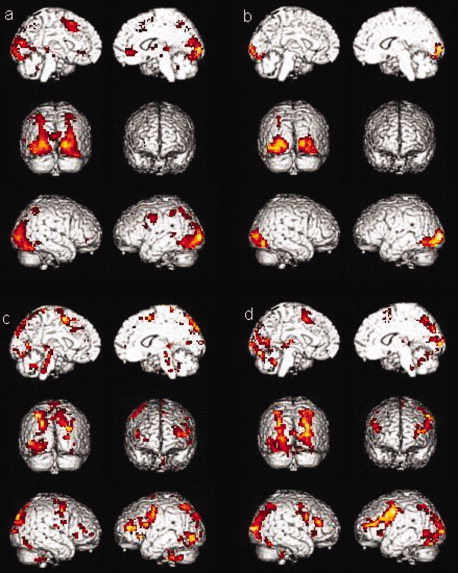
Activations for the encoding condition (a) for session one in healthy controls group, (b) in session two in healthy controls group, (c) for session one in MCI group, (d) for session two in MCI group.
Table II.
Activated clusters (>10 voxels) for the comparison of sessions 1 and 2 of memory encoding with cluster size, peak voxel MNI coordinates, and corresponding t‐values
| Activated areas (Brodmann area) (P < 0.001) | Cluster size | x | y | z | t value |
|---|---|---|---|---|---|
| Healthy controls: encoding session 1 > session 2 | |||||
| Right putamen | 18 | 18 | 0 | 6 | 4.06 |
| Left putamen | 25 | −24 | 0 | 21 | 4.04 |
| Left inferior/middle temporal gyrus (21) | 12 | −57 | ‐9 | −18 | 3.90 |
| MCI: encoding session 1 > session 2 | |||||
| Left middle frontal gyrus (11) | 15 | −36 | 51 | −9 | 4.27 |
Memory retrieval
The activations for the retrieval condition for sessions 1 and 2 of the healthy controls group (a and b, respectively) and of the MCI group (c and d, respectively) are shown in Figure 2. Both groups activated a similar frontotemporoparietal network as in encoding. The test–retest comparison showed no significance session effect on retrieval activations.
Figure 2.
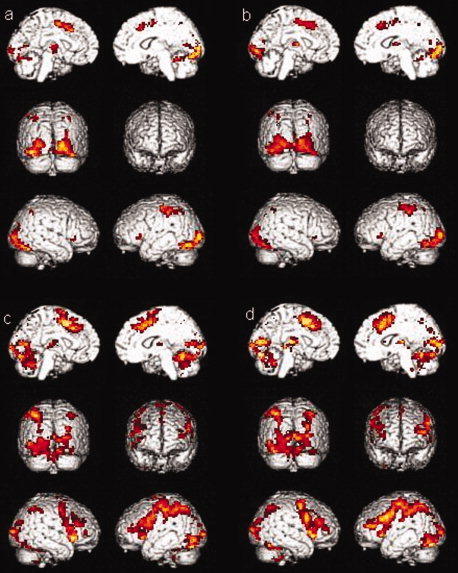
Activations for the retrieval condition (a) for session one in healthy controls group, (b) in session two in healthy controls group, (c) for session one in MCI group, (d) for session two in MCI group.
Phonological processing without a motor response
The activations for the phonological processing without a motor response condition for sessions 1 and 2 of the healthy controls group (a and b, respectively) and of the MCI group (c and d, respectively) are shown in Figure 3. During the first session, the healthy controls group showed activations in the left parahippocampal gyrus, in the posterior cingulate gyrus, in the occipital lobe, in the parietal lobe (precuneus and supramarginal gyrus), in the premotor area, in the thalamus, and in the cerebellum. Healthy controls showed less activation in the left putamen during the second session than during the first session. Again, the MCI group showed the same activations as controls in both sessions but with additional activations in the prefrontal cortex (in the inferior prefrontal gyrus, in the dorsolateral prefrontal cortex, and in the premotor region). The test–retest comparison for both groups indicated that healthy controls showed more activation in the left putamen during the first session than during the second session (Table III).
Figure 3.
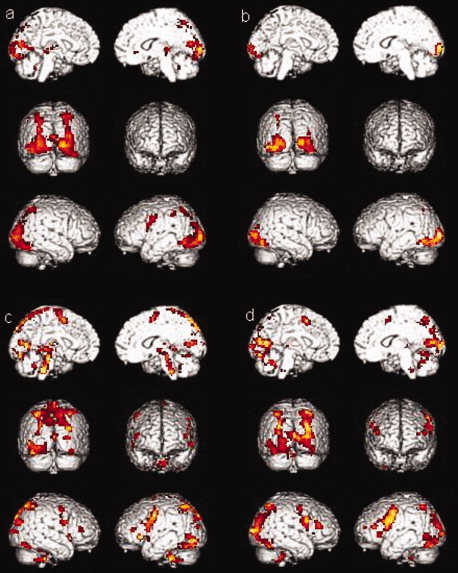
Activations for the phonological processing without a motor response condition (a) for session one in healthy controls group, (b) in session two in healthy controls group, (c) for session one in MCI group, (d) for session two in MCI group.
Table III.
Activated clusters (>10 voxels) for the comparison of sessions 1 and 2 of phonological processing without motor responses with cluster size, peak voxel MNI coordinates, and corresponding t‐values
| Activated areas (Brodmann area) (P < 0.001) | Cluster size | x | y | z | t value |
|---|---|---|---|---|---|
| Healthy controls: phonological processing without motor responses session 1 > session 2 | |||||
| Left putamen | 19 | −24 | 0 | 21 | 3.67 |
Phonological processing with a motor response
The activations for the phonological processing with a motor response condition for sessions 1 and 2 of the healthy controls group (a and b, respectively) and of the MCI group (c and d, respectively) are shown in Figure 4. During the first session, the healthy controls group showed activations in the anterior and posterior cingulate gyrus, in the occipital lobe, in the parietal lobe (precuneus, postcentral gyrus, inferior and superior parietal lobules), in the premotor area, and in the cerebellum. Healthy controls showed the same activations during the second session, with the exception of the premotor area that does not activate. Again, the MCI group showed the same activations as controls in both sessions but with additional activations in the prefrontal cortex (in the inferior prefrontal gyrus, in the dorsolateral prefrontal cortex, and in the premotor region). A comparison between both sessions in MCI persons also indicates that they show more activation in the left cerebellum during the first session than during the second session (Table IV).
Figure 4.
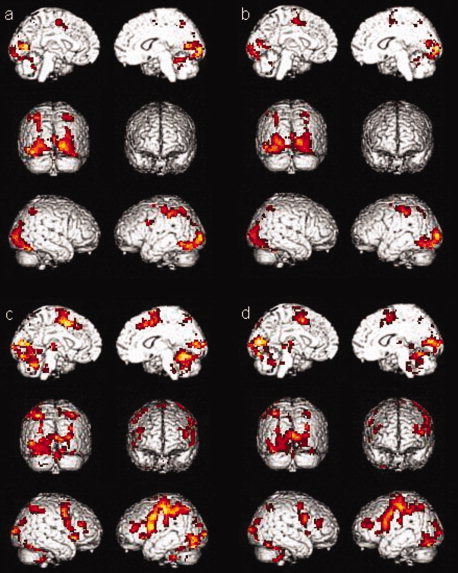
Activations for the phonological processing with a motor response condition (a) for session one in healthy controls group, (b) in session two in healthy controls group, (c) for session one in MCI group, (d) for session two in MCI group.
Table IV.
Activated clusters (>10 voxels) for the comparison of sessions 1 and 2 phonological processing with motor responses with cluster size, peak voxel MNI coordinates, and corresponding t‐values
| Activated areas (Brodmann area) (P < 0.001) | Cluster size | x | y | z | t value |
|---|---|---|---|---|---|
| MCI: phonological processing with motor responses session 1 > session 2 | |||||
| Left cerebellum | 26 | −21 | −69 | −39 | 4.08 |
Test–Retest Overlap of Activations
The overlap ratio was first calculated using an uncorrected threshold of P < 0.001. In the memory encoding condition, the overlap ratio (R overlap) in healthy controls and MCI were 0.41 (J = 0.26) and 0.40 (J = 0.25), respectively. In the memory retrieval condition, healthy controls and MCI obtained overall ratios of 0.69 (J = 0.53) and 0.70 (J = 0.54), respectively. In the phonological processing condition without a motor response, healthy controls and MCI obtained overall ratios of 0.46 (J = 0.30) and 0.42 (J = 0.27), respectively. In the phonological processing condition with a motor response, healthy controls and MCI obtained an overlap ratio of 0.68 (J = 0.52) and 0.66 (J = 0.49), respectively. Therefore, the overlap ratio was almost identical across groups and was higher in the two conditions in which a motor response was included.
The overlap ratio was recalculated using a more liberal uncorrected threshold of P < 0.005. In the memory encoding condition, the overlap ratio (R overlap) in healthy controls and MCI were 0.39 (J = 0.24) and 0.47 (J = 0.31), respectively, thus quite similar to the values found with a threshold of P < 0.001. In the memory retrieval condition, healthy controls and MCI obtained overall ratios of 0.71 (J = 0.56) and 0.75 (J = 0.59) respectively, again very similar to the values mentioned earlier. In the phonological processing condition without a motor response, healthy controls and MCI obtained overall ratios of 0.45 (J = 0.29) and 0.49 (J = 0.33), respectively. In the phonological processing condition with a motor response, healthy controls and MCI obtained an overlap ratio of 0.71 (J = 0.55) and 0.70 (J = 0.54), respectively. Therefore, the use of a more liberal threshold had only a slight effect on the overlap ratios in both groups.
The overlap ratio was also recalculated using two more conservative uncorrected threshold of P < 0.0001 and P < 0.00001. For the threshold of P < 0.0001, in the memory encoding condition, the overlap ratio (R overlap) in healthy controls and MCI were 0.46 (J = 0.30) and 0.25 (J = 0.14), respectively. In the memory retrieval condition, healthy controls and MCI obtained overall ratios of 0.60 (J = 0.43) and 0.64 (J = 0.47) respectively. In the phonological processing condition without a motor response, healthy controls and MCI obtained overall ratios of 0.53 (J = 0.36) and 0.32 (J = 0.19), respectively. In the phonological processing condition with a motor response, healthy controls and MCI obtained an overlap ratio of 0.59 (J = 0.42) and 0.56 (J = 0.39), respectively. For the threshold of P < 0.00001, in the memory encoding condition, the overlap ratio (R overlap) in healthy controls and MCI were 0.42 (J = 0.27) and 0.10 (J = 0.05), respectively. In the memory retrieval condition, healthy controls and MCI obtained overall ratios of 0.43 (J = 0.28) and 0.52 (J = 0.35), respectively. In the phonological processing condition without a motor response, healthy controls and MCI obtained overall ratios of 0.46 (J = 0.30) and 0.19 (J = 0.11) respectively. In the phonological processing condition with a motor response, healthy controls and MCI obtained an overlap ratio of 0.44 (J = 0.28) and 0.45 (J = 0.29), respectively. For all four conditions, the use of more conservative thresholds therefore reduced considerably the overlap ratios of the two groups.
Beta Values Comparisons in ROIs
Beta value changes from session 1 to session 2 were assessed for Broca's area (BA 44), for the left and right ventrolateral prefrontal cortex (BA 45, 47), for the left and right dorsolateral prefrontal cortex (BA 9, 46), for the precuneus bilaterally (BA 7), for the posterior cingulate cortex bilaterally, and for the hippocampus bilaterally for both groups and for the 4 conditions. Three‐way mixed ANCOVA with group (controls, MCI) as a between‐subject factor, session (1, 2) and condition (encoding, retrieval, phonological processing without a motor response, and phonological processing with a motor response) as within‐subject factors, and age and education as covariates were performed to assess possible group differences and reliability of the beta values from session 1 to session 2. For Broca's area (BA 44), a significant group effect was found, F(1,16) = 15.57, P < 0.001, but no session effect, F(1,16) = 2.25, N.S., or condition effect, F(3,48) = 1.64, N.S., were found and no significant interaction was observed (see Fig. 5). For the left ventrolateral prefrontal cortex (BA 45, 47), no significant group effect, F(1,16) = 1.12, N.S., session effect, F(1,16) = 0.54, N.S., or condition effect, F(3,48) = 1.82, N.S. were found and no significant interaction was observed. For the right ventrolateral prefrontal cortex (BA 45, 47), no significant group effect, F(1,16) = 0.43, N.S., session effect, F(1,16) = 0.76, N.S., or condition effect, F(3,48) = 1.44, N.S. were found and no significant interaction was observed. For the left dorsolateral prefrontal cortex (BA 9, 46), no significant group effect, F(1,16) = 0.05, N.S., session effect, F(1,16) = 0.09, N.S., or condition effect, F(3,48) = 1.19, N.S. were found but a group × condition interactions was observed, F(3,48) = 3.04, P < 0.05. Post‐hoc analysis showed that MCI showed significantly more activation in this ROI during the phonological processing without a motor response condition, P < 0.05. For the right dorsolateral prefrontal cortex (BA 9, 46), a significant group effect was found, F(1,16) = 7.60, P = 0.01 but no session effect, F(1,16) = 2.79, N.S., or condition effect, F(3,48) = 0.88, N.S. were found and no significant interaction was observed. For the precuneus bilaterally (BA 7), no significant group effect, F(1,16) = 0.26, N.S., session effect, F(1,16) = 1.28, N.S., or condition effect, F(3,48) = 1.36, N.S. were found and no significant interaction was observed, F(3,48) = 3.04, P < 0.05. For the posterior cingulate bilaterally, no significant group effect, F(1,16) = 0.34, N.S., session effect, F(1,16) = 0.17, N.S., or condition effect, F(3,48) = 0.39, N.S. were found and no significant interaction was observed. For the hippocampus bilaterally, no significant group effect, F(1,16) = 1.33, N.S., session effect, F(1,16) = 0.41, N.S., or condition effect, F(3,48) = 0.33, N.S. were found. A significant condition × session interaction was observed, F(3,48) = 3.81, P < 0.05. Post‐hoc analysis showed a significant reduction from session 1 to session 2 was observed during the phonological processing with a motor response condition, P < 0.05.
Figure 5.
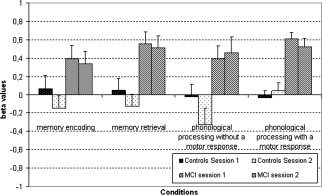
Beta values in Broca's area (BA 44) for the two groups during the four conditions and during the two sessions.
In summary, MCI showed significantly more activation than healthy controls in the Broca's area and in the right dorsolateral prefrontal cortex during all four conditions and more activation than healthy controls in the left dorsolateral prefrontal cortex during the phonological processing without a motor response condition only. The only significant change of activation from one session to another was observed in the hippocampus bilaterally with a reduction from session 1 to session 2 during the phonological processing with a motor response condition. No ROI showed more change in activation from one session to another in the MCI group than in the healthy controls group.
ICC in ROIs
Single measure ICC of sessions 1 and 2 were assessed for Broca's area (BA 44), for the left and right ventrolateral prefrontal cortex (BA 45, 47), for the left and right dorsolateral prefrontal cortex (BA 9, 46), for the precuneus bilaterally (BA 7), for the posterior cingulate cortex bilaterally, and for the hippocampus bilaterally for both groups and for the four conditions (Table V). Healthy controls showed significant ICC in the precuneus bilaterally during the retrieval and phonological processing without a motor response conditions, in the left dorsolateral prefrontal cortex (BA 9, 46) during the encoding, retrieval, and phonological processing with motor response conditions, in the left ventrolateral prefrontal cortex (BA 45, 47) during the retrieval condition, in the right ventrolateral prefrontal cortex (BA 45, 47) during the retrieval and phonological processing with motor response conditions, and in the posterior cingulate cortex during the retrieval and phonological processing with motor response conditions. MCI participants showed significant ICC in Broca's area (BA 44) during the retrieval condition, in the precuneus bilaterally during all four conditions, in the hippocampus bilaterally during the retrieval and phonological processing with a motor response conditions, in the right dorsolateral prefrontal cortex (BA 9, 46) during the retrieval, phonological processing without a motor response, and phonological processing with a motor response conditions, and in the posterior cingulate cortex during the retrieval, phonological processing without a motor response, and phonological processing with a motor response conditions. The mean ICC of healthy controls was 0.31 and the one of MCIs was 0.36. A t‐test between the ICCs of the two groups did not reveal a significant difference, t(62) = −0.68, N.S.
Table V.
Single measures intraclass correlation of ROIs for both groups and for the four conditions
| Condition | Controls | MCI | ||||||
|---|---|---|---|---|---|---|---|---|
| 1 | 2 | 3 | 4 | 1 | 2 | 3 | 4 | |
| Broca's area (BA 44) | 0.30 | 0.38 | −0.18 | 0.39 | 0.31 | 0.60* | 0.13 | −0.13 |
| Precuneus bilaterally (BA 7) | −0.1 | 0.56* | −0.21 | 0.62* | 0.48* | 0.63* | 0.64* | 0.79*** |
| Hippocampus bilaterally | 0.02 | −0.05 | −0.25 | 0.29 | −0.08 | 0.48* | 0.19 | 0.50* |
| Left dorsolateral PFC (BA 9, 46) | 0.50* | 0.57* | 0.38 | 0.59* | 0.13 | 0.29 | 0.11 | 0.40 |
| Right dorsolateral PFC (BA 9, 46) | 0.22 | 0.24 | 0.09 | 0.36 | 0.36 | 0.61* | 0.60* | 0.70** |
| Left ventrolateral PFC (BA 45, 47) | 0.16 | 0.59* | 0.05 | 0.42 | −0.17 | 0.40 | −0.23 | 0.32 |
| Right ventrolateral PFC (BA 45, 47) | 0.36 | 0.79*** | 0.24 | 0.90*** | 0.43 | 0.33 | 0.27 | 0.17 |
| Posterior cingulate cortex | 0.10 | 0.76** | 0.05 | 0.72** | 0.22 | 0.61* | 0.60* | 0.74** |
F‐test (with a reference test‐value of 0) significant at *P < 0.05, **P < 0.01, and ***P < 0.001.
DISCUSSION
The goal of this study was to assess the reliability of fMRI signal in healthy older adults and in MCI persons. This was done with a verbal memory task and a phonological processing task, both with and without a motor response. Although MCI persons and healthy older adults showed differences in the localization of their activations between the two sessions, a statistical comparison of session 1 and 2 revealed few significant differences even with the use of a relatively liberal threshold value (P < 0.001). Small clusters in the putamen and in the left inferior and middle temporal lobe of the healthy older adults and in the left middle frontal gyrus of the MCI group showed less activation at session 2 relative to session 1. Reduction of activation during the second session is consistent with what is usually observed in studies of practice effects (see Kelly and Garavan, 2005] and the changes observed in the current study likely reflect the same phenomenon. Importantly, we did not find significant behavioral performance differences between the two groups or between the two sessions. This is important for fMRI data as differences in performance could otherwise be attributed to motivational or attentional factors that might have had an impact on brain activation thus limiting the interpretation of activation differences as they relate to reproducibility.
fMRI reproducibility was also assessed by comparing the average beta values of selected ROIs in areas that that are known to be involved in verbal memory and/or phonological processing [Cabeza and Nyberg, 2000]. While some group differences were observed (i.e. more activation in MCI than in healthy controls in the Broca's area and in the right dorsolateral prefrontal cortex during all four conditions and in the left dorsolateral prefrontal cortex during the phonological processing without a motor response condition only), these group differences appear to be stable in time as no group × session interaction was found. Furthermore, only the hippocampus ROI showed change in activation from one session to another and this was only during one among four conditions. The comparison of beta values in the ROIs therefore suggests that the two groups show reliable session‐to‐session fMRI signal, at least in the regions investigated in this study. Overall, these results, combined with the statistical comparisons of sessions 1 and 2, suggest that in older adults with or without cognitive decline, the fMRI signal elicited by the execution of the four conditions used here do not vary significantly when measured in two sessions that are 6 weeks apart.
The test–retest reliability was also assessed with the overlap ratio, a commonly used reliability method that measures reproducibility by comparing number and location of voxels activated in both sessions compared to those activated in only one of them. The group overlap ratios (R overlap) of healthy controls and of MCI were almost identical in the four conditions with an uncorrected threshold of P < 0.001 and were very similar when using an uncorrected threshold of P < 0.005. This was the case whether tested with a relatively simple phonological task or with a more demanding memory task irrespective of the motor response. For these two thresholds, the encoding overlap ratio of both groups is very close to the one previously reported in healthy young adults (0.41 in healthy older adults and 0.40 in MCI, respectively, vs. 0.36 in healthy young adults; Machielsen et al., 2000; Wagner et al., 2005] and the overlap ratio associated with retrieval is higher in both groups than that previously reported in healthy young adults (0.69 in healthy older adults and 0.70 in MCI, vs. 0.42 in healthy young adults; Wagner et al., 2005]. Thus, the present data indicate that MCI persons show overlap ratios that are comparable to those found in healthy older adults and healthy young adults and that this overlap ratio is not reduced by the disease. However, it is of note that while the overlap ratios (Dice coefficient) of the conditions comprising a motor response were often above 0.60 for the liberal thresholds, and hence can be considered as representing good agreement [Landis and Koch, 1977], the overlap ratios found for the conditions with no motor response were between 0.40 and 0.60 which represents a moderate between‐session agreement. For the two more conservative thresholds, most overlap ratios were either between 0.40 and 0.60 (moderate agreement) or below 0.40 (fair to low agreement). Overall our results indicate that to have a reliable index of disease progression or to evaluate the neural effect of treatments, researchers should rely more on statistical comparisons of the condition contrasts across sessions and on comparisons of the average beta values of selected ROIs, rather than on voxel activation comparisons as the latter provide fair to moderate reliability when the task does not include a motor response.
In addition to the two aforementioned thresholds, two other more conservative threshold values were used to calculate the overlap ratio to assess the impact of thresholding on this reproducibility measure because, as mentioned earlier, the overlap ratio is limited by the fact that thresholding an image can exaggerate very small differences and hence lead to considerable differences in the size of the overlap ratio obtained. In the current study the two liberal thresholds (P < 0.001 and P < 0.005) led to similar relatively high overlap ratios in the two groups, while the use of two more conservative threshold values (P < 0.0001 and P < 0.00001) led to lower overlap ratios in both groups. This could be due to the fact that some voxels showed few signal differences between the two sessions but with one being just below the threshold and the other being just above the threshold. Alternatively, the current neuroimaging technology, preprocessing treatment (such as smoothing and realignment), and statistical analyses may not be advanced enough and/or optimal to measure session‐to‐session signal changes on a single voxel basis. Be this as it may, it indicates that threshold values are likely to have an impact on reliability and that more conservative thresholds tend to be associated with lower reliability than less conservative ones. This has obvious implication when using fMRI to assess change in older populations.
We also found some interesting task‐related effect on overlap ratios. Notably, memory tasks and phonological tasks yielded comparable overall ratios. The relevant condition appeared to be the presence of a motor response in the task. In both memory and phonological tasks, the inclusion of a motor response resulted in a much higher overlap ratio than when no motor response was included in the task. This is coherent with the literature indicating that sensorimotor tasks produce more reliable brain activation across sessions.
Finally, we assessed fMRI reproducibility with ICC measures in these same ROIs. It is noteworthy that the ICC was calculated here on an individual basis rather than on a group basis (i.e. individual/single measure ICCs rather than average measure ICCs). Results indicated that overall both MCI and healthy controls showed significant ICC on a large number of regions and that the mean ICC values of MCI and healthy older adults were very close and not statistically different. While significant, ICC values were however of a relatively low magnitude (mean ICC of 0.31 and of 0.36 for healthy controls and MCI, respectively) in comparison to those that have been reported in young healthy individuals [Aron et al., 2006; Specht et al., 2003; Wei et al., 2004]. The fact that the ICCs were calculated on the average beta values of the ROI, instead of on the beta value of specific voxels, may however have increased the session‐to‐session variability. Another finding was that, as observed in studies with young healthy participants, the ICCs values were found to vary greatly as a function of the region analyzed. However, the regional effect on ICCs appears to differ from one group to another, with some regions showing significant ICCs in the MCI group but not in the healthy control group and others showing significant ICC in the healthy control group but not in the MCI group. For healthy controls, ICCs were much lower in Broca's area, hippocampus, and right dorsolateral prefrontal cortex than in the precuneus, left dorsolateral and ventrolateral prefrontal cortex, right ventrolateral prefrontal cortex, and posterior cingulate cortex. For MCI persons, the opposite pattern was found. Yet, those findings suggest that although the fMRI signal is reliable at the group level for both healthy older adults and MCI individuals, it is much less so when examining data on an individual basis. Again, this may arise from the fact that the current neuroimaging technology, preprocessing treatment, and statistical analyses may not be advanced enough and/or optimal enough to reduce within‐subject variability and thus to measure session‐to‐session signal change in a single individual. It could also be due to the sensitivity of the signal to personal factors that vary in time such as fatigue, stress, or other biologically determined factors. It is however noteworthy that most participants were scanned at the same time of the day for the two sessions.
We are aware of the limitations of this study. First, our sample was relatively small and we may have lacked statistical power for some of the analyses, although our N was quite consistent with most fMRI studies in clinical populations. Alternatively, it could be argued that a P < 0.001 threshold is too conservative and may have overshadowed some session‐to‐session differences. While there is no gold standard for the choice of statistical threshold in fMRI analyses, we believe that the fact that we used multiple reproducibility measures overcomes this limitation. Note also that reliability appears to decrease, not increase, with more conservative threshold. Another limitation could be the use of proportional scaling, a procedure that is used to remove both intersession and intrasession variance in the global signal but that can decrease sensitivity values, and hence may decrease the activation levels, when the global signal is correlated to the experimental paradigm [Gavrilescu et al., 2002; Junghofer et al., 2005]. The findings of this study should therefore be replicated with other global normalization methods such as grand mean scaling, masking methods or orthogonalization methods. Lastly, the lack of significant task performance differences between the two sessions was judged as a strength because differences in performances might then have an impact on brain activation and may have subsequently limited the interpretation of activation differences. However, it could be also seen as a limitation as the evolution of a disease and/or a pharmalogical or nonpharmalogical intervention are likely to produce a decrease or an increase of the behavioral performance of the participants on the fMRI task. Therefore, these findings will need to be replicated with fMRI tasks that elicit either group differences, or session‐to‐session differences, in performances.
The findings from this study indicate that MCI individuals exhibit fMRI test–retest reproducibility that are quite comparable to those of healthy older adults, suggesting that the fMRI reproducibility is not modified in an important way by MCI. The results also show that the fMRI signal does not vary significantly at a group level when comparing brain activity in two sessions that are separated by a 6‐week period, suggesting that this technique could be used as a neural surrogate of pharmalogical or nonpharmalogical approaches to MCI or early AD (for examples see Goekoop et al., 2004, 2006; Gron et al., 2006; Saykin et al., 2004] as long as the outcome is measured in terms of fMRI signal rather than solely in terms of activation of voxels and as long as it is evaluated at the group level. Indeed, test–retest failed to produce a reliable pattern of significantly activated voxels as there seems to be within‐subject variability in the fMRI signal from session to session. This lack of reproducibility at an individual level suggests that precautions should be taken when using fMRI as a diagnostic tool or as a tool to monitor the evolution of the disease. One should first be aware of thresholding effects and rely on multiple thresholds. One should also be aware that task characteristics will affect reliability and that tasks with motor responses should yield higher reproducibility than tasks without motor responses. Lastly, the use of more optimized realignment tools and of higher sizes of full width at half maximum (FWHM) during smoothing may increase reliability by decreasing test–retest differences in voxel localization. Importantly though, the present findings indicate that obtaining reliable test–retest findings with fMRI is not more difficult in a population of older adults with cognitive impairments than in a population of healthy older adults.
Acknowledgements
SB receives an FRSQ Chercheur‐National. FC was supported by a scholarship from CIHR. We thank Samira Mellah for assistance in task construction and data collection, Étienne Vachon‐Presseau for his suggestions and comments, and Luke Henry for editorial assistance. The authors have reported no conflicts of interest.
Footnotes
Note that performances of two MCI persons were not recorded due to equipment difficulties.
REFERENCES
- Aron AR, Gluck MA, Poldrack RA ( 2006): Long‐term test–retest reliability of functional MRI in a classification learning task. Neuroimage 29: 1000–1006. [DOI] [PMC free article] [PubMed] [Google Scholar]
- Ball K, Berch DB, Helmers KF, Jobe JB, Leveck MD, Marsiske M, Morris JN, Rebok GW, Smith DM, Tennstedt SL, Unverzagt FW, Willis SL ( 2002): Effects of cognitive training interventions with older adults: A randomized controlled trial. JAMA 288: 2271–2281. [DOI] [PMC free article] [PubMed] [Google Scholar]
- Belleville S, Gilbert B, Fontaine F, Gagnon L, Menard E, Gauthier S ( 2006): Improvement of episodic memory in persons with mild cognitive impairment and healthy older adults: Evidence from a cognitive intervention program. Dement Geriatr Cogn Disord 22: 486–499. [DOI] [PubMed] [Google Scholar]
- Benton AL, Hamsher K, Varney NR, Spreen O ( 1983): Contributions to Neuropsychological Assessment. New York: Oxford University Press. [Google Scholar]
- Brett M, Anton J‐L, Valabregue R, Poline J‐P ( 2002): Region of interest analysis using an SPM toolbox, Sendai, Japan. Available on CD‐ROM in NeuroImage, Vol. 16, No. 2.
- Buschke H ( 1984): Cued recall in amnesia. J Clin Neuropsychol 6: 433–440. [DOI] [PubMed] [Google Scholar]
- Cabeza R, Nyberg L ( 2000): Imaging cognition II: An empirical review of 275 PET and fMRI studies. J Cogn Neurosci 12: 1–47. [DOI] [PubMed] [Google Scholar]
- Chen EE, Small SL ( 2007): Test–retest reliability in fMRI of language: Group and task effects. Brain Lang 102: 176–185. [DOI] [PMC free article] [PubMed] [Google Scholar]
- Craik FI, Winocur G, Palmer H, Binns MA, Edwards M, Bridges K, Glazer P, Chavannes R, Stuss DT ( 2007): Cognitive rehabilitation in the elderly: Effects on memory. J Int Neuropsychol Soc 13: 132–142. [DOI] [PubMed] [Google Scholar]
- Dice L ( 1945): Measures of the amount of ecologic association between species. Ecology 26: 297–302. [Google Scholar]
- Fernandez G, Specht K, Weis S, Tendolkar I, Reuber M, Fell J, Klaver P, Ruhlmann J, Reul J, Elger CE ( 2003): Intrasubject reproducibility of presurgical language lateralization and mapping using fMRI. Neurology 60: 969–975. [DOI] [PubMed] [Google Scholar]
- Folstein MF, Folstein SE, McHugh PR ( 1975): Mini‐mental state: A practical method for grading the cognitive state of patients for the clinician. J Psychiatr Res 12: 189–198. [DOI] [PubMed] [Google Scholar]
- Gauthier S, Reisberg B, Zaudig M, Petersen RC, Ritchie K, Broich K, Belleville S, Brodaty H, Bennett D, Chertkow H, Cummings JL, de Leon M, Feldman H, Ganguli M, Hampel H, Scheltens P, Tierney MC, Whitehouse P, Winblad B ( 2006): Mild cognitive impairment. Lancet 367: 1262–1270. [DOI] [PubMed] [Google Scholar]
- Goekoop R, Rombouts SA, Jonker C, Hibbel A, Knol DL, Truyen L, Barkhof F, Scheltens P ( 2004): Challenging the cholinergic system in mild cognitive impairment: A pharmacological fMRI study. Neuroimage 23: 1450–1459. [DOI] [PubMed] [Google Scholar]
- Goekoop R, Scheltens P, Barkhof F, Rombouts SA ( 2006): Cholinergic challenge in Alzheimer patients and mild cognitive impairment differentially affects hippocampal activation––A pharmacological fMRI study. Brain 129 ( Part 1): 141–157. [DOI] [PubMed] [Google Scholar]
- Gavrilescu M, Shaw ME, Stuart GW, Eckersley P, Svalbe ID, Egan GF ( 2002): Simulation of the effects of global normalization procedures in functional MRI. Neuroimage 17: 532–542. [PubMed] [Google Scholar]
- Gron G, Brandenburg I, Wunderlich AP, Riepe MW ( 2006): Inhibition of hippocampal function in mild cognitive impairment: Targeting the cholinergic hypothesis. Neurobiol Aging 27: 78–87. [DOI] [PubMed] [Google Scholar]
- Hachinski VC, Iliff LD, Zilka E, et al. ( 1975): Cerebral blood flow in dementia. Arch Neurol 32: 317–320. [DOI] [PubMed] [Google Scholar]
- Havel P, Braun B, Rau S, Tonn JC, Fesl G, Bruckmann H, Ilmberger J ( 2006): Reproducibility of activation in four motor paradigms––An fMRI study. J Neurol 253: 471–476. [DOI] [PubMed] [Google Scholar]
- Junghofer M, Schupp HT, Stark R, Vaitl D ( 2005): Neuroimaging of emotion: Empirical effects of proportional global signal scaling in fMRI data analysis. Neuroimage 25: 520–526. [DOI] [PubMed] [Google Scholar]
- Kaplan EF, Goodglass H, Weintraub S ( 1983): The Boston Naming Test, 2nd ed Philadelphia, PA: Lea & Febiger. [Google Scholar]
- Kelly AM, Garavan H ( 2005): Human functional neuroimaging of brain changes associated with practice. Cereb Cortex 15: 1089–1102. [DOI] [PubMed] [Google Scholar]
- Kiehl KA, Liddle PF ( 2003): Reproducibility of the hemodynamic response to auditory oddball stimuli: A six‐week test–retest study. Hum Brain Mapp 18: 42–52. [DOI] [PMC free article] [PubMed] [Google Scholar]
- Kong J, Gollub RL, Webb JM, Kong JT, Vangel MG, Kwong K ( 2007): Test–retest study of fMRI signal change evoked by electroacupuncture stimulation. Neuroimage 34: 1171–1181. [DOI] [PMC free article] [PubMed] [Google Scholar]
- Kurland J, Naeser MA, Baker EH, Doron K, Martin PI, Seekins HE, Bogdan A, Renshaw P, Yurgelun‐Todd D ( 2004): Test–retest reliability of fMRI during nonverbal semantic decisions in moderate‐severe nonfluent aphasia patients. Behav Neurol 15: 87–97. [DOI] [PMC free article] [PubMed] [Google Scholar]
- Landis JR, Koch GG ( 1977): The measurement of observer agreement for categorical data. Biometrics 33: 159–174. [PubMed] [Google Scholar]
- Liu JZ, Zhang L, Brown RW, Yue GH ( 2004): Reproducibility of fMRI at 1.5 T in a strictly controlled motor task. Magn Reson Med 52: 751–760. [DOI] [PubMed] [Google Scholar]
- Loubinoux I, Carel C, Alary F, Boulanouar K, Viallard G, Manelfe C, Rascol O, Celsis P, Chollet F ( 2001): Within‐session and between‐session reproducibility of cerebral sensorimotor activation: A test–retest effect evidenced with functional magnetic resonance imaging. J Cereb Blood Flow Metab 21: 592–607. [DOI] [PubMed] [Google Scholar]
- Machielsen WC, Rombouts SA, Barkhof F, Scheltens P, Witter MP ( 2000): FMRI of visual encoding: Reproducibility of activation. Hum Brain Mapp 9: 156–164. [DOI] [PMC free article] [PubMed] [Google Scholar]
- Maldjian JA, Laurienti PJ, Driskill L, Burdette JH ( 2002): Multiple reproducibility indices for evaluation of cognitive functional MR imaging paradigms. Am J Neuroradiol 23: 1030–1037. [PMC free article] [PubMed] [Google Scholar]
- Maldjian JA, Laurienti PJ, Kraft RA, Burdette JH ( 2003): An automated method for neuroanatomic and cytoarchitectonic atlas‐based interrogation of fMRI data sets. Neuroimage 19: 1233–1239. [DOI] [PubMed] [Google Scholar]
- Manoach DS, Halpern EF, Kramer TS, Chang Y, Goff DC, Rauch SL, Kennedy DN, Gollub RL ( 2001): Test–retest reliability of a functional MRI working memory paradigm in normal and schizophrenic subjects. Am J Psychiatry 158: 955–958. [DOI] [PubMed] [Google Scholar]
- Marshall I, Simonotto E, Deary IJ, Maclullich A, Ebmeier KP, Rose EJ, Wardlaw JM, Goddard N, Chappell FM ( 2004): Repeatability of motor and working‐memory tasks in healthy older volunteers: Assessment at functional MR imaging. Radiology 233: 868–877. [DOI] [PubMed] [Google Scholar]
- Mattis S ( 1976): Mental status examination for organic mental syndrome in the elderly patient In: Bellak L, Karasu TB, editors. Geriatric Psychiatry. New York: Grune & Stratton, p. 77–121. [Google Scholar]
- Miki A, Raz J, van Erp TG, Liu CS, Haselgrove JC, Liu GT ( 2000): Reproducibility of visual activation in functional MR imaging and effects of postprocessing. Am J Neuroradiol 21: 910–915. [PMC free article] [PubMed] [Google Scholar]
- Miller MB, Van Horn JD, Wolford GL, Handy TC, Valsangkar‐Smyth M, Inati S, Grafton S, Gazzaniga MS ( 2002): Extensive individual differences in brain activations associated with episodic retrieval are reliable over time. J Cogn Neurosci 14: 1200–1214. [DOI] [PubMed] [Google Scholar]
- Neumann J, Lohmann G, Zysset S, von Cramon DY ( 2003): Within‐subject variability of BOLD response dynamics. Neuroimage 19: 784–796. [DOI] [PubMed] [Google Scholar]
- Petersen RC, Morris JC ( 2005): Mild cognitive impairment as a clinical entity and treatment target. Arch Neurol 62: 1160–1163; discussion 1167. [DOI] [PubMed] [Google Scholar]
- Raemaekers M, Vink M, Zandbelt B, van Wezel RJ, Kahn RS, Ramsey NF ( 2007): Test–retest reliability of fMRI activation during prosaccades and antisaccades. Neuroimage 36: 532–542. [DOI] [PubMed] [Google Scholar]
- Rapp S, Brenes G, Marsh AP ( 2002): Memory enhancement training for older adults with mild cognitive impairment: A preliminary study. Aging Ment Health 6: 5–11. [DOI] [PubMed] [Google Scholar]
- Regard M ( 1981): Cognitive Rigidity and Flexibility: A Neuropsychological Study. Canada: University of Victoria. [Google Scholar]
- Rey A ( 1959): Test de copie d'une figure complexe: Manuel. Paris: Les éditions du centre de psychologie appliquée. [Google Scholar]
- Rombouts SA, Barkhof F, Hoogenraad FG, Sprenger M, Valk J, Scheltens P ( 1997): Test–retest analysis with functional MR of the activated area in the human visual cortex. Am J Neuroradiol 18: 1317–1322. [PMC free article] [PubMed] [Google Scholar]
- Rombouts SA, Barkhof F, Hoogenraad FG, Sprenger M, Scheltens P ( 1998): Within‐subject reproducibility of visual activation patterns with functional magnetic resonance imaging using multislice echo planar imaging. Magn Reson Imaging 16: 105–113. [DOI] [PubMed] [Google Scholar]
- Rutten GJ, Ramsey NF, van Rijen PC, van Veelen CW ( 2002): Reproducibility of fMRI‐determined language lateralization in individual subjects. Brain Lang 80: 421–437. [DOI] [PubMed] [Google Scholar]
- Saykin AJ, Wishart HA, Rabin LA, Flashman LA, McHugh TL, Mamourian AC, Santulli RB ( 2004): Cholinergic enhancement of frontal lobe activity in mild cognitive impairment. Brain 127( Part 7): 1574–1583. [DOI] [PubMed] [Google Scholar]
- Shattuck DW, Sandor‐Leahy SR, Schaper KA, Rottenberg DA, Leahy RM ( 2001): Magnetic resonance image tissue classification using a partial volume model. Neuroimage 13: 856–876. [DOI] [PubMed] [Google Scholar]
- Signoret JL ( 1991): Batterie d'efficience mnésique BEM 144. Paris: Elsevier. [Google Scholar]
- Specht K, Willmes K, Shah NJ, Jancke L ( 2003): Assessment of reliability in functional imaging studies. J Magn Reson Imaging 17: 463–471. [DOI] [PubMed] [Google Scholar]
- Stark R, Schienle A, Walter B, Kirsch P, Blecker C, Ott U, Schafer A, Sammer G, Zimmermann M, Vaitl D ( 2004): Hemodynamic effects of negative emotional pictures––A test–retest analysis. Neuropsychobiology 50: 108–118. [DOI] [PubMed] [Google Scholar]
- Swallow KM, Braver TS, Snyder AZ, Speer NK, Zacks JM ( 2003): Reliability of functional localization using fMRI. Neuroimage 20: 1561–1577. [DOI] [PubMed] [Google Scholar]
- Van der Linden M, Adam S, Agniel A, Baisset‐Mouly C, Bardet F, Coyette F, Desgranges B, Deweer B, Ergis AM, Gély‐Nargeot MC, Grimomprez L, Juillerat AC, Kalafat M, Poitrenaud J, Sellal F, Thomas‐Antérion C ( 2004): L'évaluation de troubles de la mémoire: Présentation de quatre tests de mémoire épisodique (avec étalonnage). Marseille: Solal. [Google Scholar]
- Wagner K, Frings L, Quiske A, Unterrainer J, Schwarzwald R, Spreer J, Halsband U, Schulze‐Bonhage A ( 2005): The reliability of fMRI activations in the medial temporal lobes in a verbal episodic memory task. Neuroimage 28: 122–131. [DOI] [PubMed] [Google Scholar]
- Waldvogel D, van Gelderen P, Immisch I, Pfeiffer C, Hallett M ( 2000): The variability of serial fMRI data: Correlation between a visual and a motor task. Neuroreport 11: 3843–3847. [DOI] [PubMed] [Google Scholar]
- Wechsler D ( 1997): Wechsler Adult Intelligence Scale‐III. New York: Psychological Corporation. [Google Scholar]
- Wei X, Yoo SS, Dickey CC, Zou KH, Guttmann CR, Panych LP ( 2004): Functional MRI of auditory verbal working memory: Long‐term reproducibility analysis. Neuroimage 21: 1000–1008. [DOI] [PubMed] [Google Scholar]
- Yesavage JA ( 1988): Geriatric depression scale. Psychopharmacol Bull 24: 709–711. [PubMed] [Google Scholar]
- Yetkin FZ, McAuliffe TL, Cox R, Haughton VM ( 1996): Test–retest precision of functional MR in sensory and motor task activation. Am J Neuroradiol 17: 95–98. [PMC free article] [PubMed] [Google Scholar]