

Abstract
Recent studies have suggested that attention facilitates the formation of synchronous neural assemblies in the γ range (>40 Hz) to amplify behaviorally relevant signals. Whether this mechanism is general or confined to sensory cortices is still a matter of debate, since there is little evidence of a direct link between attention and increased γ synchronization in high‐level brain regions. We recorded the intracerebral EEG of 10 epileptic patients while manipulating their attention during reading, and compared the neural responses to attended and unattended words. Visual presentation of attended words induced γ band responses in the major brain regions associated with reading and those responses were attenuated for unattended words. The attenuation was not uniform within the reading network but followed a gradient from the posterior visual to the frontal areas. Altogether, these results support the view that the γ band response can be used as a quantitative marker of attention. Hum Brain Mapp 2008. © 2007 Wiley‐Liss, Inc.
Keywords: reading, intracerebral EEG, γ band, attention, epilepsy
INTRODUCTION
When reading a book in a tired or distracted mode, it is not uncommon to read entire paragraphs without really accessing their meaning. How this kind of “pseudo‐reading” differs from attentive reading in terms of neural processes is still not fully understood. Attention can potentially affect the neural activities involved in each of the distinct cognitive subprocesses underlying reading. This includes both low‐level visual processes and higher‐level processes such as grapho‐phonological conversion or semantic analysis [Joubert et al.,2004]. To date, the effects of attention on neural activity have been directly studied mostly in the early visual areas. Most animal studies on attention have demonstrated that attention can increase (and respectively decrease) the discharge rate of neurons coding for attended (and respectively unattended) stimuli or features [Desimone and Duncan,1995; Treue,2001]. In humans, a similar enhancement of neural responses has been repeatedly observed at the scale of larger neural populations: for instance, attention is known to increase the amplitude of some visually event‐related potentials (ERP), such as the P100 [Heinze et al.,1994]. Furthermore, the same mechanism of attentional enhancement seems to operate during the later stages of attentive reading: the N400 for instance, an ERP elicited by words and indexing semantic processes, is reduced in the absence of attention [Bentin et al.,1995; McCarthy and Nobre,1993]. Also, Nobre et al. [1998] demonstrated a modulation by attention after 400 ms on the potentials generated in the posterior half of the fusiform gyrus and surrounding sulci. Altogether, these observations strongly support the view that the attentional modulations experienced by a reader correspond to variations in neural discharge rate or to phase‐locked responses modulations (reflected by ERPs) within the large‐scale cerebral network underlying reading.
Recent studies, however, suggest that this may not be the complete story: there is now growing evidence that attention might influence not only the overall discharge rate of individual neurons but also the temporal structure of their activity. Specifically, several studies both in animals with microrecordings [Bichot et al.,2005; Fries et al.,2001; Lakatos et al.,2004; Steinmetz et al.,2000] and in humans with scalp or intracerebral EEG [Brovelli et al.,2005; Gruber et al.,1999; Muller et al.,2000; Tallon‐Baudry et al.,2005] have reported that attention increases the degree of synchronization among neurons and favors the occurrence of coherent neural oscillations in the γ frequency range, both phase‐locked and nonphase‐locked to stimulations. Such synchronization effects have been repeatedly associated with perceptual processes over the last 15 years [Singer,1999; Tallon‐Baudry and Bertrand,1999], and according to some authors, they may increase the visibility of the synchronous neural population by postsynaptic neurons and therefore naturally mediate attentional selection in possible addition to rate modulation effects [Fries et al.,2001; Niebur et al.,2002].
While the link between γ synchronization and attention is starting to be clearly established in sensory areas, it is not clear yet whether it remains valid in higher‐level cognitive regions, and namely in the brain regions carrying phonological and semantic processing during reading. However, γ oscillations have been recently recorded in high‐level areas during complex cognitive tasks, such as memory [Howard et al.,2003; Mainy et al.,2006] or language processing [Crone et al.,2001; Sinai et al.,2005; Tanji et al.,2005]. Therefore, we formulated the hypothesis that attention modulations during reading is accompanied with variations of activity in the γ range in the entire network subserving reading, and not just in its visual subcomponents.
To test this hypothesis, we analyzed the intracerebral EEG of 10 epileptic patients recorded while performing a task that manipulated their attention during reading. This reading task was originally designed by Nobre et al. [1998] to study the effect of attention on the low frequency evoked potentials in the inferior temporal lobe. It consisted in showing two intermixed stories, word by word, and asking the patients to read only one of them. We compared the energy of the EEG in response to attended and unattended words, as a function of time, frequency, and anatomy throughout a large sampling of the network subserving reading.
MATERIALS AND METHODS
Subjects
The 10 patients (Pt1 to Pt10) suffered from drug‐resistant partial epilepsy and were candidates for surgery. None of the patients was colorblind. There were 9 females and 1 male, aged from 17 to 40 years (mean: 28 years). Magnetic resonance imaging (MRI) of the brain showed different types of lesions in 7 cases [hippocampal sclerosis (HcS) in 3 (Pt1, Pt4, Pt6), HcS with ipsilateral temporo‐polar arachnoidian cyst in 1 (Pt2), HcS with posterior parietal atrophy in 1 (Pt3), HcS with temporal lobe atrophy in 1 (Pt9), and temporo‐basal dysplastic lesion in 1 (Pt5)], and was normal in the remaining 3 patients (Pt7, Pt8, Pt10). Because the location of the epileptic focus could not be identified using noninvasive methods, the patients underwent intracerebral EEG recordings by means of stereotactically implanted multilead depth electrodes (SEEG) (for explanation of this methodology, see Kahane et al. [2004]), on the basis of which the epileptogenic zone proved to be left temporal in 7 cases (Pt1‐Pt4, Pt6, Pt7, Pt9), left temporal extending to the lateral temporo‐occipital junction in 1 case (Pt5), left multifocal temporo‐parieto‐occipital (Pt8), and left premotor frontal in 1 (Pt10).
Selection of sites to implant were made entirely for clinical purposes with no reference to the present experimental protocol; however, patients who entered this protocol were selected because their implantation sampled regions classically associated with language and word recognition. The patients performed the task 4 days after the implantation of the electrodes, and all had previously given their informed consent to participate in the experiment.
Electrodes Implantation
Eleven to fourteen Semi‐rigid electrodes were implanted per patient, in cortical areas, which varied depending on the suspected origin of seizures (Fig. 1a,b). A total number of 630 sites were recorded in the 10 patients, all in the left hemisphere. Each electrode had a diameter of 0.8 mm and comprised 10 or 15 leads of 2 mm length, 1.5 mm apart (Dixi, Besançon, France), depending on the target region. Therefore, various mesial and lateral cortical areas were evaluated, including sulcal cortex. The electrode contacts were identified on each individual stereotactic scheme, and then anatomically localized using the proportional atlas of Talairach and Tournoux [1988]. In addition, the computer‐assisted matching of postimplantation CT‐scan with a preimplantation 3D MRI provided a direct visualization of the electrode contacts with respect to the brain anatomy of each patient (Activis, Lyon, France).
Figure 1.
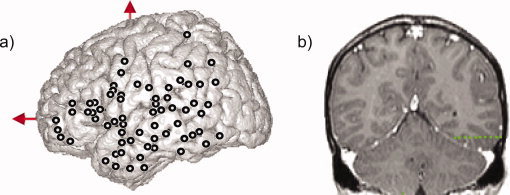
(a) Lateral view summarizing the locations of the electrodes of the 10 patients on the MNI single subject MRI. Thick circles indicate the analyzed recording sites. Ten to fifteen electrodes were implanted per patient. Electrodes were implanted orthogonally to the anterior‐commissure/posterior commissure sagittal plane. Each electrode had 10–15 contacts, each of 2 mm length, separated by 1.5 mm. All electrodes were implanted in the left hemisphere of the patients. (b) Example of electrophysiological recording in 1 patient (Pt10): Location of one electrode with 10 contacts (green circles) superimposed on coronal MRI. [Color figure can be viewed in the online issue, which is available at www.interscience.wiley.com.]
Paradigm
The experimental paradigm was the one described by Nobre et al. [1998] except for the interstimuli intervals, which we extended to adjust to the late latencies of the attentional modulations reported in that previous study. In each block of the experiment, the subjects were presented with two intermixed stories, shown word by word at a rapid rate. One of the stories was written in green (on a black screen) and the other in red. The subjects were instructed to read either the red or the green story (color was indicated before‐hand), to report it at the end of the block. Each block would present 400 words, with 200 green words and 200 red words for the two stories. The distribution of colors within the 400‐words series was randomized, so that subjects could not predict whether the subsequent word was to be attended or not; however, the randomization was constrained to forbid series of more than three consecutive words with the same color. Words of a same color formed a meaningful and simple short story in French. There were six blocks in total, and the target color was varied between blocks.
After each block, subjects were asked questions about the relevant text, which could not have been answered from general knowledge. They were also asked to tell the story just read as well as they could.
The experimental procedure took place in patient's hospital room. Stimuli were presented to the participants on a 17" computer screen at a 200 cm viewing distance and the average word subtended 2° of visual angle. Words appeared singly for 100 ms every 800 ms on average (700–900 ms stimulus onset asynchrony).
Recording and Data Analysis
Intracerebral recordings were conducted using an audio‐video‐EEG monitoring system (Micromed, Treviso, Italy), which allowed the simultaneous recording of 63 depth‐EEG channels sampled at 512 Hz [0.1–200 Hz bandwidth] during the experimental paradigm. One of the contact sites in the white matter was chosen as reference. This reference has the same impedance as the other contact sites, and was located in a region with no or little source of electrical field, in addition, it was not contaminated by eye‐movements artifacts or electromyographic activity from subtle muscle contractions. However, all signals were re‐referenced to their nearest neighbour on the same electrode, 3.5 mm away before analysis (bipolar montage). Across the 10 patients, the total number of contiguous recording bipolar derivations was 354, sampling various regions of the left hemisphere. Recording sites showing clear epileptiform activities were excluded from the analysis, and among the remaining sites, monopolar and bipolar data were systematically inspected, both raw and high‐pass filtered (above 15 Hz), and any trial showing epileptic spikes in any of those traces was discarded.
Prior to signal analysis, all trials were sorted into two categories: words to be attended and words not to be attended, irrespective of their colors. In the final dataset after artefact rejection, we adjusted the size of the trial sets so that each trial category (attended and unattended) would contain an equal number of red and green words.
Time‐frequency analysis
Intraindividual analyses of the data.
For each single trial, bipolar derivations computed between adjacent electrode contacts were analyzed in the time‐frequency (TF) domain by convolution with complex Gaussian Morlet's wavelet [Tallon‐Baudry et al.,1997] thus providing a TF power map P(t,f) = |w(t,f) × s(t)|2, where w(t,f) was for each time t and frequency f; a complex Morlet's wavelet w(t,f) = Aexp(−t
2/2σ)exp(2iπft), with
 and σt = 1/(2πσf) and σf a function of the frequency f: σf = f/7.
For visualization purposes only, those average TF maps were normalized frequency by frequency relative to a prestimulus baseline according to the following procedure (z‐transform): (a) we computed for each frequency f the mean m(f) and the standard deviation s(f) of the average TF map over a [−200 ms:0 ms] prestimulus baseline, and (b) for each average TF map, each energy value at frequency f and time t, P(t,f) was replaced by [P(t,f) − m(f)]/s(f). For each patient, these time–frequency maps were computed for each contact. This normalization procedure is used to display relative energy change with respect to baseline for each frequency and highlights low amplitude high‐frequency components. The peak latency of γ band responses in the attended condition was determined on those maps.
Significant spectral modulations caused by the attended stimuli were detected using a Wilcoxon nonparametric test that compared across trials, the total (non‐normalized) energy in a given time–frequency tile, with that of a tile of similar frequency extent, but covering a prestimulus baseline period from [−200 ms:0 ms]. A set of 160 time–frequency tiles [100 ms × 10 Hz] covering a [0 ms:800 ms] × [1 Hz:200 Hz] domain was used. For each patient, Bonferroni correction was applied to all Wilcoxon tests according to the number of recorded bipoles and of the number of time–frequency tiles over the tested domain after stimulus presentation. Significance threshold was thus set at an uncorrected P‐value of between 1.25 × 10⁻⁵ (25 dipoles × 160 TF tiles) and 7.4 × 10⁻⁶ (42 dipoles × 160 TF tiles) depending on the total number of bipoles per patient (correspondent corrected level P‐value of 0.05) for all those statistical comparisons.
For the recording sites showing significant energy increases in the γ band previously determined, we compared the γ band energy for attended and for nonattended words. Those comparisons between attended words and unattended words were done via a Kruskal–Wallis nonparametric analysis applied on the raw time–frequency values of energy, on a set of 40 time–frequency tiles [100 ms × 10 Hz] covering a [200 ms:600 ms] × [50 Hz:150 Hz] domain (one test per tile comparing the values obtained for all the trials in the two conditions, those latency and frequency intervals were determined by the results of the Wilcoxon tests, see results). Bonferroni correction was applied to all Kruskal–Wallis tests according to the number of recorded bipoles and of the number of time–frequency tiles (40). Significance threshold was thus set at an uncorrected P‐value between 0.00125 (1 dipole × 40 TF tiles) and 0.00025 (5 dipoles × 40 TF tiles) depending on the total number of bipoles per patient (correspondent corrected level P‐value of 0.05) for all those statistical comparisons.
Finally, we introduced a simple index, termed A, which quantified the effect of attention on task‐induced spectral energy modulations (see supplementary figure for a graphical explanation). For each recording site where visual stimuli induced significant γ modulations (revealed by the Wilcoxon comparison detailed above), A was computed in four steps : (a) from the average TF map, extract the mean energy in the [40–150 Hz] band as a function of time, (b) normalize this energy relative to the [40–150 Hz] baseline, that is, substract in each time step the mean energy value of the baseline period and divide by the standard deviation observed during that baseline [let's call this function Z(t)], (c) find, in the attend condition, the peak value of Z(t)attend and, if that peak value is larger than 3 (which occurred in all cases) define the maximal interval surrounding that peak, which contains only values above 3, and (d) finally, compute the mean value of Z(t)attend in that interval, the mean value of Z(t)unattend in that interval, divide the latter by the former and multiply by 100 to get a percentage.
Interindividual analyses of the data.
Across patients, the anatomical sites showing responses induced by word reading were pooled into clusters corresponding to those already defined and associated with subcomponents of the reading process by a recent meta‐analysis of 35 fMRI/PET reading studies [Jobard et al.,2003]. The so defined clusters included: Broca's area pars triangularis, Broca's area pars opercularis, the precentral gyrus, the superior temporal gyrus (anterior and posterior part), the middle temporal gyrus, the inferior temporal gyrus, and the fusiform gyrus. Each site was located less than 1.5 cm away on each Talairach axis from the center of each of those anatomical region implicated in word processing, according to that meta‐analysis.
For each of those clusters, we measured the mean peak latency of γ band responses in the attended condition and the attentional modulation effect index by the A index previously defined.
To compare the peak latency of γ band responses and the attentional effect across anatomical clusters, we used the nonparametric Mann–Whitney U‐test testing for P value of less than 0.05.
ERP analysis
Event‐related potentials were compared between the two conditions via a Kruskal–Wallis nonparametric analysis applied on the raw values of potential between [0 ms:1000 ms] following stimulation with a sliding window of 50 ms (one test per tile comparing the values obtained for all the trials in the two conditions).
EEG signals were evaluated with the software package for electrophysiological analysis (ELAN‐Pack) developed in the INSERM U821 laboratory.
RESULTS
In the 10 patients, the debriefing sessions following each block clearly indicated that they had read the target story, captured its global meaning, and were able to tell the correct sequence of events. The patients' comprehension of the nontarget story was not evaluated, as in Nobre et al. study [1998]. Although this could be seen as a potential limitation of the present protocol, we argue with Nobre et al. that this is not so, since (a) systematic questions about nonattended stories would have necessarily brought the patients' attention to nontargets words; (b) any failure from one patient to not pay attention to nontarget stories would have simply caused an absence of difference between the electrophysiological responses to target and nontarget stories. In any case, reports from the patients, collected after the complete paradigm, indicated that they had read only occasional words from nontarget stories.
Across the 10 patients, 41 (out of 354) recording bipolar derivations sites showed γ band responses to attended words (defined as energy increases in the [40–150 Hz] range relative to baseline [−200 ms:0 ms] (Wilcoxon, P corrected < 0.05)). Sites showing such γ band responses were concentrated within subportions of the following regions (see also Table I): in the frontal lobe, (a) in the inferior frontal gyrus (three sites on six recorded (3/6) sites in Broca's area pars triangularis and 7/8 sites in Broca's area pars opercularis) and (b) in the precentral gyrus (2/2 sites); in the temporal lobe, (a) in the superior temporal gyrus (4/10 sites in the anterior part, 3/9 sites in the posterior part), (b) in the middle temporal gyrus (4/10 sites), (c) in the inferior temporal gyrus (5/10 sites), (d) in the fusiform gyrus (7/10 sites), (e) in the parahippocampal gyrus (1/1 site), (f) in the lingual gyrus (1/6 site). In addition, 2/2 sites were found in the posterior cingulate gyrus and 1/7 site in the supramarginal gyrus.
Table I.
Talairach coordinates for all the recording sites across the 10 patients exhibiting (40–150 Hz) oscillations in response to attended words
| Patient | Bipole | X (in mm) | Y (in mm) | Z (in mm) |
|---|---|---|---|---|
| Broca's area pars triangularis (n = 6 patients) | ||||
| Pt3* | q′6‐q′5 | −50 | 23 | 11 |
| Pt4 | g′12‐g′11 | −46 | 38 | 12 |
| Pt7* | q′3‐q′2 | −49 | 17 | 4 |
| Broca's area pars opercularis (n = 8 patients) | ||||
| Pt1* | r′8‐r′7 | −62 | 0 | 19 |
| Pt2 | r′5‐r′4 | −44 | 5 | 23 |
| Pt3* | r′7‐r′6 | −57 | 0 | 17 |
| Pt4* | q′8‐q′7 | −54 | 12 | 9 |
| Pt5* | r′6‐r′5 | −55 | 5 | 15 |
| Pt6* | r′7‐r′6 | −61 | −1 | 16 |
| Pt7* | r′6‐r′5 | −64 | 5 | 19 |
| Precentral gyrus (n = 2 patients) | ||||
| Pt7* | r′3‐r′2 | −52 | 5 | 19 |
| Pt10* | r′15‐r′14 | −63 | −4 | 39 |
| Superior temporal gyrus (anterior part) (n = 10 patients) | ||||
| Pt2* | t′7‐t′6 | −60 | −8 | −1 |
| Pt4* | t′7‐t′6 | −58 | 0 | −3 |
| Pt6* | t′6‐t′5 | −60 | −3 | −3 |
| Pt10* | t′6‐t′5 | −59 | −7 | 5 |
| Superior temporal gyrus (posterior part) (n = 9 patients) | ||||
| Pt2* | s′2‐s′1 | −35 | −26 | 19 |
| Pt3* | u′6‐u′5 | −57 | −31 | 5 |
| Pt9* | u′7‐u′6 | −56 | −26 | 11 |
| Middle temporal gyrus (n = 10 patients) | ||||
| Pt4* | f′11‐f′10 | −53 | −49 | −7 |
| Pt4 | b′9‐b′8 | −52 | −31 | −7 |
| Pt10* | b′8‐b′7 | −55 | −15 | −7 |
| Pt10* | d′5‐d′4 | −37 | −58 | 5 |
| Inferior temporal gyrus (n = 10 patients) | ||||
| Pt1 | d′10‐d′9 | −67 | −52 | −8 |
| Pt5* | f′7‐f′6 | −57 | −61 | −15 |
| Pt8* | f′7‐f′6 | −53 | −56 | −5 |
| Pt8* | l′7‐l′6 | −52 | −44 | −13 |
| Pt10* | f′8‐f′7 | −59 | −57 | −8 |
| Fusiform gyrus (n = 7 patients) | ||||
| Pt4* | e′3‐e′2 | −34 | −30 | −20 |
| Pt5 | f′2‐f′1 | −37 | −61 | −15 |
| Pt5 | l′2‐l′1 | −30 | −42 | −21 |
| Pt7 | e′2‐e′1 | −29 | −41 | −15 |
| Pt8* | f′3‐f′2 | −36 | −56 | −5 |
| Pt9* | f′5‐f′4 | −27 | −40 | −2 |
| Pt10 | e′7‐e′6 | −52 | −13 | −25 |
| Posterior cingulate gyrus (n = 2 patients) | ||||
| Pt5* | v′2‐v′1 | −8 | −42 | 26 |
| Pt10* | v′2‐v′1 | −10 | −48 | 24 |
| Supramarginal gyrus (n = 7 patients) | ||||
| Pt6 | s′7‐s‐6 | −60 | −20 | 22 |
| Parahippocampal gyrus (n = 1 patient) | ||||
| Pt4* | b′2‐b′1 | −26 | −31 | −7 |
| Lingual gyrus (n = 6 patients) | ||||
| Pt3 | c′4‐c′3 | −35 | −42 | −2 |
Each site was located less than 1.5 cm away on each Talairach axis from the center of one anatomical region implicated in word processing, according to the meta‐analysis of Jobard et al. (2003).
The dissociation between the ERPs and γ band modulations was particularly evident in several patients in which sites showed clear γ band modulations by attention but no ERP modulation; those are indicated by an asterisk symbol in the table.
To facilitate the interpretation of those activations in terms of reading subprocesses, Figures 3, 4, 5, 6 shows their anatomical distribution in relation with anatomical clusters associated with reading by a recent meta‐analysis of 35 fMRI/PET reading studies [Jobard et al.,2003], which includes Broca's area pars triangularis, Broca's area pars opercularis, the precentral gyrus, the superior temporal gyrus (anterior and posterior part), the middle temporal gyrus, the inferior temporal gyrus, and the fusiform gyrus. γ band response sites were associated with a given cluster if located less than 1.5 cm away on each Talairach axis from the center of that cluster, according to the coordinates provided by Jobard et al. [2003].
Figure 3.
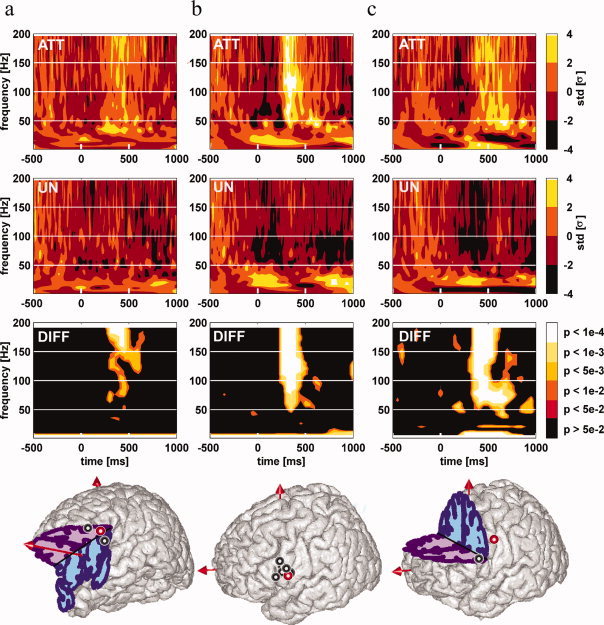
Attentional modulations of induced γ band responses in the frontal cortex. Left Panel (a): γ band oscillations in Broca's area pars triangularis; Middle Panel (b): γ band oscillations in Broca's area pars opercularis; Right Panel (c): γ band oscillations in the precentral gyrus. Each standard brain MNI drawings displays the sites with a significant enhancement of γ [40–150 Hz] oscillations energy in response to attended words compared to unattended words. Each thick circle indicates an individual patient recording site with such a γ enhancement. Red circles display the locations of typical examples shown in the upper part of each panel. For each of these typical examples, time–frequency maps to attended words (top map “att”), to unattended words (mid map “un”), and the statistical comparison between TF map to attended words and TF map to unattended words (bottom map “diff”) are shown. Words are presented every 800 ms on average. TF maps display the mean energy of EEG signal across trials for each frequency in a [−500:1,000 ms] interval (word presentation onset is at 0 ms). The TF modulation map displays the augmentation in energy relative to the [−200:0 ms] baseline (in standard deviations) for each condition. The statistical comparison map displays the P‐value map resulting from the comparison between the attended words map and the unattended words map (Kruskall–Wallis nonparametric test). Note the timing of γ power enhancement in response to attended words compared to unattended words in those three anatomical locations (maximal effect size near 450 ms poststimulus in the Broca's area pars triangularis, 450 ms poststimulus in the Broca's area pars opercularis, and 500 ms poststimulus in the precentral gyrus). [Color figure can be viewed in the online issue, which is available at www.interscience.wiley.com.]
Figure 4.
Attentional modulations of induced γ band responses in the superior temporal gyrus. Left Panel (a): γ band oscillations in the anterior part of superior temporal gyrus; Middle Panel (b): γ band oscillations in the posterior part of superior temporal gyrus Broca's area pars opercularis. Each standard brain MNI drawings displays the sites with a significant enhancement of γ [40–150 Hz] oscillations energy in response to attended words compared to unattended words. Each thick circle indicates an individual patient recording site with such a γ enhancement. Red circles display the locations of typical examples shown in the upper part of each panel. For each of these typical examples, time–frequency maps to attended words (top map “att”), to unattended words (mid map “un”), and the statistical comparison between TF map to attended words and TF map to unattended words (bottom map “diff”) are shown. Words are presented every 800 ms on average. TF maps display the mean energy of EEG signal across trials for each frequency in a [−500:1,000 ms] interval (word presentation onset is at 0 ms). The TF modulation map displays the augmentation in energy relative to the [−200:0 ms] baseline (in standard deviations) for each condition. The statistical comparison map displays the P‐value map resulting from the comparison between the attended words map and the unattended words map (Kruskall–Wallis nonparametric test). [Color figure can be viewed in the online issue, which is available at www.interscience.wiley.com.]
Figure 5.
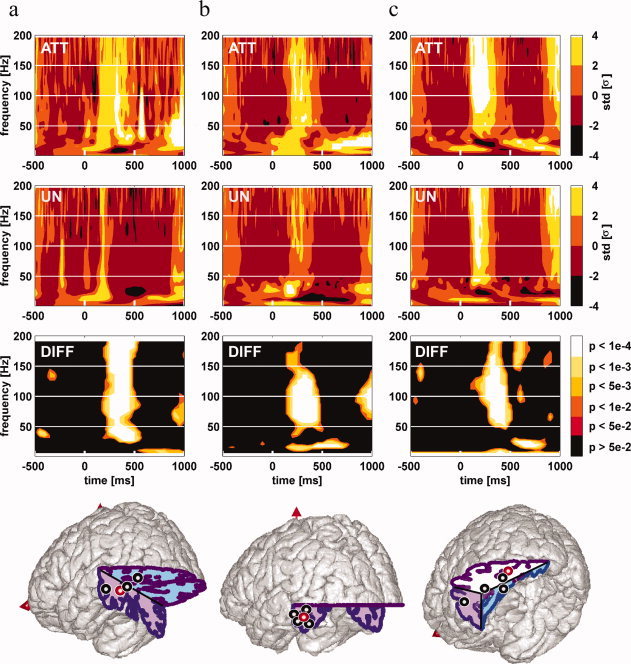
Attentional modulations of induced γ band responses in the middle temporal gyrus and infero temporal cortex. Left Panel (a): γ band oscillations in the middle temporal gyrus; Middle Panel (b): γ band oscillations in the inferior temporal gyrus; Right Panel (c): γ band oscillations in the fusiform gyrus. Each standard brain MNI drawings displays the sites with a significant enhancement of γ [40–150 Hz] oscillations energy in response to attended words compared to unattended words. Each thick circle indicates an individual patient recording site with such a γ enhancement. Red circles display the locations of typical examples shown in the upper part of each panel. For each of these typical examples, time–frequency maps to attended words (top map “att”), to unattended words (mid map “un”), and the statistical comparison between TF map to attended words and TF map to unattended words (bottom map “diff”) are shown. Words are presented every 800 ms on average. TF maps display the mean energy of EEG signal across trials for each frequency in a [−500 ms:1,000 ms] interval (word presentation onset is at 0 ms). The TF modulation map displays the augmentation in energy relative to the [−200 ms:0 ms] baseline (in standard deviations) for each condition. The statistical comparison map displays the P‐value map resulting from the comparison between the attended words map and the unattended words map (Kruskall–Wallis nonparametric test). [Color figure can be viewed in the online issue, which is available at www.interscience.wiley.com.]
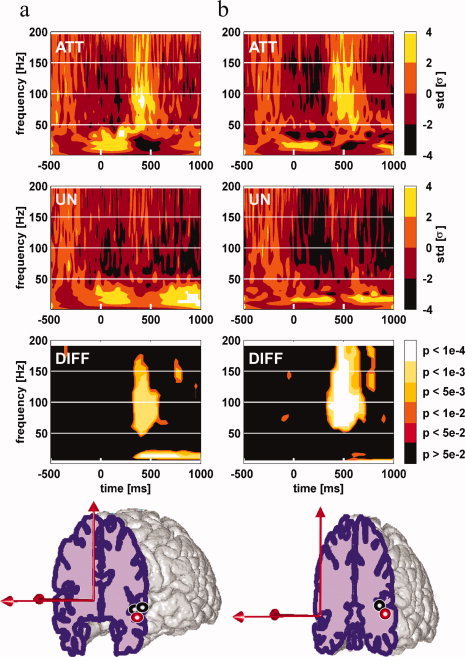
Figure 6.
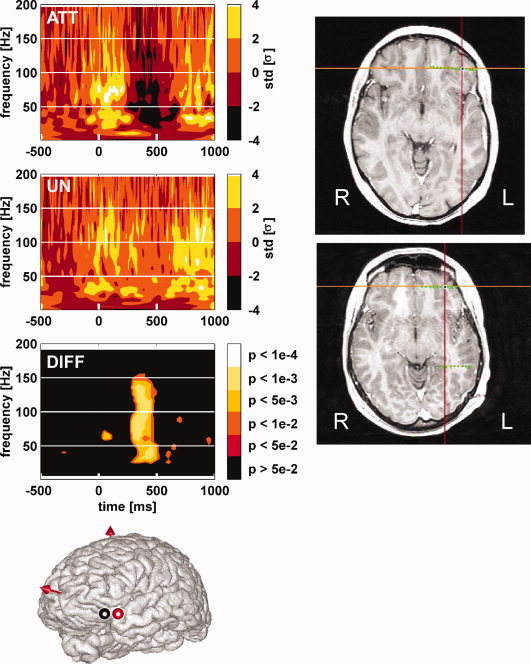
Transient neural deactivations in the Ventral Lateral Prefrontal Cortex in 2 patients induced by attended words. The standard brain MNI drawing displays the recording sites of 2 patients with a significant decrease of γ [40–150 Hz] oscillations energy in response to attended words compared to unattended words. Thick circle indicate an individual patient recording site with such a γ decrease. Red circle displays the recording site of 1 patient shown as an example in the upper part of the left panel. For this patient, time–frequency maps to attended words (top map “att”), to unattended words (mid map “un”), and the statistical comparison between TF map to attended words and TF map to unattended words (bottom map “diff”) are shown on the upper part of the left panel. Words are presented every 800 ms on average. TF maps display the mean energy of EEG signal across trials for each frequency in a [−500 ms:1,000 ms] interval (word presentation onset is at 0 ms). The TF modulation map displays the decrease in energy relative to the [−200 ms:0 ms] baseline (in standard deviations) for each condition. The statistical comparison map displays the P‐value map resulting from the comparison between the attended words map and the unattended words map (Kruskall–Wallis nonparametric test). Right panel displays on individual brain MRI of the two patients the two contacts (in black) showing this γ band deactivation. [Color figure can be viewed in the online issue, which is available at www.interscience.wiley.com.]
Phase‐locking factor analysis [Tallon‐Baudry et al.,1997] revealed that in all sites, the γ oscillations generated by the stimuli were not phase‐locked to it (no significant increase of the phase‐locking factor relative to the prestimulus period). This analysis should not be confused with (PCA) factor analysis.
The time course of those γ activations was consistent within clusters: Table II shows the peak latency of the γ response in the attended condition in each anatomical cluster. Clusters in the inferior temporal lobe were characterized by an early and abrupt energy increase reaching its peak before 300 ms (for sites in the fusiform gyrus, the inferior temporal gyrus, and the lingual gyrus), followed by a gradual return to baseline level before 500 ms. In contrast, the energy increase was more gradual in the other clusters, and always reached its peak later, after 300 ms. Statistical comparisons showed that the peak latency of γ band responses was shorter in the inferior temporal gyrus than in Broca's area pars triangularis, Broca's area pars opercularis, precentral gyrus, anterior and posterior part of the superior temporal gyrus (Broca's area pars triangularis P = 0.024; Broca's area pars opercularis P = 0.004; precentral gyrus P = 0.025; anterior part of the superior temporal gyrus P = 0.014; posterior part of the superior temporal gyrus P = 0.025; Mann–Whitney U‐test).
Table II.
Neural dynamics of attentive reading
| Mean peak latency (ms; mean ± SE) | Z ratio (Z unatt/Z attend; mean ± SE) | |
|---|---|---|
| Broca's area pars triangularis (n = 3 recording sites) | 387 (2.6) | −11.7 (13.7) |
| Broca's area pars opercularis (n = 7 recording sites) | 391 (34.3) | −16.8 (17.5) |
| Precentral gyrus (n = 2 recording sites) | 452 (101.5) | −26.2 (40.1) |
| Anterior part of the superior temporal gyrus (n = 4 recording sites) | 350 (31.4) | 31.1 (22.1) |
| Posterior part of the superior temporal gyrus (n = 3 recording sites) | 382 (69.7) | 36.2 (35.6) |
| Middle temporal gyrus (n = 4 recording sites) | 408 (122.9) | 41.9 (14.5) |
| Inferior temporal gyrus (n = 5 recording sites) | 207 (11.3) | 45.5 (9.7) |
| Fusiform gyrus (n = 7 recording sites) | 294 (65.8) | 77.4 (21.2) |
| Lingual gyrus (n = 1 recording site) | 296 | 106 |
| Supramarginal gyrus (n = 1 recording site) | 382 | 1.29 |
| Posterior cingulate gyrus (n = 2 recording sites) | 331 (19.5) | 37.6 (38.4) |
The peak latency of γ oscillations induced by word reading in the attended condition was computed and averaged for each anatomical cluster (first column).
The size of the attentional effect was assessed by the indice defined in the methods [mean Z ratio (Mean Z‐score in the attended condition/unattended condition)] and was averaged for each anatomical cluster (second column).
Although the intersubject variability of those responses did not allow to reach general conclusions regarding the relative latencies of those γ responses, it should be noted that in several patients, we observed clear latency differences between regions. For instance, 3 patients (Pt 3, 4, and 7) were recorded both in the pars triangularis and opercularis of Broca's area, and all showed an earlier peak of activation in the pars triangularis. It would thus be wrong to assume that those responses occurred simultaneously.
Interestingly, the dynamics of γ activations within the perisylvian structures was particularly easy to assess in one patient (Pt4), in which the electrodes sampled several γ responses anterior and posterior to the sylvian fissure. In that particular patient, we observed a clear spread of activity from the fusiform gyrus (peak latency = 164 ms), to the middle temporal gyrus (179 ms), to the superior temporal gyrus (257 ms), Broca's area pars triangularis (390 ms), and Broca's area pars opercularis (593 ms) (see Fig. 2). However, it was not possible to test the generality of this pattern in other patients.
Figure 2.
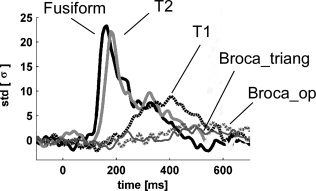
Time course of γ band responses induced by attended words in 1 patient (Pt4) in five different anatomical regions. The graph displays the normalized energy (relative to the 200 ms prestimulus baseline) of the [40–150 Hz] oscillatory responses following attended word presentation. Fusiform = fusiform gyrus; T2 = middle temporal gyrus; Broca_triang = Broca's area pars triangularis; T1 = superior temporal gyrus; Broca_op = Broca's area pars opercularis.
Attentional Modulations of γ Oscillations Induced by Words
The comparison of the γ response induced by attended versus unattended words revealed a stronger response amplitude for attended words as compared to unattended words for all but five of the sites discussed above (Kruskal–Wallis nonparametric test, P corrected <0.05). The sites showing no attentional modulations were all in the fusiform gyrus (Pt5 l′2‐l′1/Pt7 e′2‐e′1), lingual gyrus (Pt3 c′3‐c′2) or superior temporal gyrus (Pt2 s′2‐s′1/Pt10 t′6‐t′5).
Figures 3, 4, 5 show representative examples of the attentional modulations found in the remaining sites, for the different clusters. As evident in those figures, the precise effect of attentional modulation on the γ responses was dependent upon the anatomical structure considered. In the fusiform gyrus and in the inferior temporal gyrus (Fig. 5), attention increased the duration of the γ response, with a faster return to baseline level for unattended words; while the initial part of the response was unaltered. In the other anatomical clusters (Figs. 3 and 4), the effect of selective attention was more global, with a larger peak energy in response to attended words, but the same overall time profile in both attention condition.
To compare the effect of attention across different brain regions, we introduced a simple measure of this effect (called A), obtained by dividing the energy increase generated in the [40–150 Hz] band by unattended words by the energy increase generated by attended words (see Material and Methods section). The A values obtained for the different clusters are shown in Table II. A value of 0% indicates that unattended words generated no γ response, while attended words did. A value of 100% indicates that attended and unattended words generated similar responses. Negative values can occur and indicate that unattended words generated a decrease in γ band energy relative to the baseline. As apparent in Table II, this ratio varied across brain regions. The higher A ratios, above 40% (i.e., smaller attentional effects) were found in the inferior temporal lobe (inferior temporal gyrus, fusiform gyrus, lingual gyrus) and middle temporal gyrus, while the lowest (and negative) ratios were observed in three frontal clusters (Broca's area pars triangularis, Broca's area pars opercularis, and the precentral gyrus). Despite the small number of sites in each cluster, we carried a tentative statistical comparison between those values, which revealed that the ratios were significantly smaller in those last three clusters than in the other ones (Orthogonal comparisons between pairs of means, Mann–Whitney U‐test, P < 0.05).
γ Deactivations Induced by Selective Attention to Words
In 2 patients (Pt3 and Pt6), we observed in the Ventral Lateral Prefrontal Cortex (VLPFC) that the poststimulus γ energy was weaker for attended words than for unattended words (see Fig. 6). However, this effect was due to a “negative γ response” specific of the attention condition: attended words induced a significant decrease in γ band energy peaking 500 ms post stimulation, while unattended words did not.
Attentional Modulations of ERPs Induced by Words
A detailed analysis of the ERPs is beyond the scope of this focused article, and has already been the object of a previous study using the same protocol in patients [Nobre et al.,1998]. Still, we found that late ERPs components (350 ms latency) were enhanced by attention in certain anatomical locations, in agreement with Nobre et al. [1998] study. Those modulations were observed in the following sites: Broca's area pars triangularis (1 patient, Pt4 g′12‐g′11), Broca's area pars opercularis (1 patient, Pt2 r′5‐r′4), the superior temporal gyrus (3 patients, Pt2 t′7‐t′6; Pt6 u′8‐u′7; Pt8 s′9‐s′8), the middle temporal gyrus (1 patient, Pt4 b′9‐b′8), the inferior temporal gyrus (1 patient, Pt1 d′9‐d′8), the fusiform gyrus (2 patients, Pt9 e′6‐e′5; Pt10 e′7‐e′6). We found no effect of attention on the ERPs recorded in the precentral gyrus nor in the lingual gyrus, the cingulate gyrus, and the supramarginal gyrus. This dissociation between the ERPs and γ band modulations was particularly evident in several patients in which sites showed clear γ modulations by attention but no ERP modulation; those are indicated by a star symbol in Table I, only nine sites out of the 36 with γ band attention modulations displayed ERP modulations. Also, we found no equivalent in the ERP of the negative γ responses observed in the VLPFC, which is explained by the fact that the polarity of ERPS does not specify whether the underlying neuronal process is inhibitory or excitatory relative to the baseline period [Allison et al.,1986]. Altogether, those results supported the view that γ band responses and ERPs mark different functional aspects and that the former are more sensitive to attentional variations.
Finally, we also observed attentional modulations of the EEG spectral energy in frequency bands lower than 40 Hz, which corresponded in most cases to negative responses (i.e., stimulus induced energy decreases) amplified by attention. However, those were less focal and less reliable across patients than the γ band modulations. Future studies will investigate specifically those lower frequency effects.
DISCUSSION
The results of the present study confirmed to a broad extent our initial hypothesis: word presentation triggered variations in γ band activity in several brain regions classically associated with reading and those variations were reduced or annihilated in the absence of attention.
One possible limitation of our study is the pathological context in which recordings were made. The 10 patients had all an epileptic focus in the left hemisphere, and recordings were also all made also in various left hemisphere sites. While pathological condition might have induced language reorganization limiting investigation of normal reading processes, behavioral indices showed that the patient read carefully the to‐be attended stories and data analysis excluded all trials exhibiting epileptic events. Lastly, there is no reason to believe that task‐induced high‐frequency oscillations were related to epileptic processes, since none of the patients presented seizures induced by word reading [Ferlazzo et al.,2005]. Therefore, we consider brain activations in those patients to be a model of normal reading processes.
The novelty of our observations is the finding that γ band activity modulations by attention does not occur solely in early sensory areas but also in higher‐level brain regions. The effect of attention on γ oscillations had already been well‐documented in animals in sensory cortices [Bichot et al.,2005; Fries et al.,2001; Lakatos et al.,2004; Steinmetz et al.,2000] and several EEG experiments had confirmed its existence in humans [Brovelli et al.,2005; Gruber et al.,1999; Muller et al.,2000; Tallon‐Baudry et al.,2005]. However, the existence of such effect in high‐level brain areas and during complex tasks could only be demonstrated using invasive electrophysiological recordings as used in our study: noninvasive recordings are not precise enough to localize the anatomical origin of observed γ modulations. We believe that our results constitute definite evidence that the strong influence of attention on γ activity is not restricted to sensory areas but is rather a general phenomenon.
The brain structures, where attention was found to modulate γ band responses, have been often related to reading in fMRI and PET studies: some of those structures have been most often associated with visual aspects of reading (the lingual gyrus and the fusiform gyrus [Jobard et al.,2003]), in particular we observed effects near the so‐called visual word form area, [Cohen et al.,2000]), others with phonological aspects (Broca's area pars opercularis and the precentral gyrus [Fiez,1997; Paulesu et al.,1993; Zatorre et al.,1996], the superior temporal gyrus [Buchsbaum et al.,2005; Cohen et al.,2004], and the supramarginal gyrus [Demonet et al.,2005; Jobard et al.,2003]), and others in semantic processes (Broca's area pars triangularis [Demb et al.,1995; Devlin et al.,2003; Petersen et al.,1988; Roskies et al.,2001]).
Interestingly, the magnitude of the attentional effect on γ activity was not uniform across the reading network, an effect already reported in extrastriate regions [Tallon‐Baudry et al.,2005]. The response to the visual words was only moderately reduced by inattention in the ventral visual pathway, consistent with the fact that the unattended words are nevertheless “seen.” In contrast, the response was almost suppressed by inattention in regions mediating semantic and phonological processes in the Broca's area and the precentral gyrus, in agreement with recent fMRI studies showing that the activation generated by unattended stimuli is suppressed in task‐relevant brain regions during high attentional load tasks [Rees et al.,1999; Ruz et al.,2005; Yi et al.,2004].
Two scenarios may lead to this suppression of activity in Broca's area and the precentral gyrus. In one “passive” scenario, the information regarding the unattended words would simply not reach those frontal regions, as if they had not been presented. In this case, the absence of response in those sites would simply be the consequence of an early filtering process [Kastner and Pinsk,2004; Moran and Desimone,1985]. In a second “active” scenario, the information would indeed reach Broca's area and the precentral gyrus, but an active inhibitory mechanism would prevent those regions to activate in the inattention condition, or alternatively, an active excitatory mechanism would trigger their activation only in the attention condition. In both cases, attention acts as filter, but the question is whether this filtering process is early or late, a long‐time debated issue [Desimone and Duncan,1995; Driver,2001; Naatanen,1975]. A mechanism of early selection should lead to all‐or‐none effects: words that pass through the early filter would then be processed fully, phonologically, and semantically. This would predict that the diminution of activity for unattended stimuli should be comparable, and in fact complete, in all the regions mediating phonological and semantic processing. In this regards, it is interesting to note that the reduction of the γ response in the inattention condition was not so drastic in the superior and middle temporal gyrus sites, which are supposedly involved in phonological processing [Buchsbaum et al.,2005; Cohen et al.,2004; Jobard et al.,2003], as it was in the frontal sites. This seems to support the view that the attentional selection is not early, but late, and that the suppression of activity in the frontal regions results from an active mechanism acting directly on those regions. We have to acknowledge that this late suppression active mechanism may be imposed by the nature of the task, using two interleaved stories. Under normal reading conditions, attentional effects might have a different timing, depending on the processes needed to filter out nonattended words.
The fact that the attention effects occurred at late latencies (after 400 ms) is also consistent with this view. Those are late latencies, compared with earlier observations that attention can modulate event‐related potentials as early as 80 ms after stimulus presentation [Heinze et al.,1994]. However, those latencies are consistent with those reported for ERP modulations in the same protocol [Nobre et al.,1998]. A possible explanation is that early attentional modulations occur only when the attention of the subject is cued before the stimulus presentation, which was not the case in this protocol, since the stimulus and the cue (the color of the word) were presented simultaneously. Still, our results suggest that patients do not have the possibility to filter out unselectively and before‐hand all the stimuli of a certain color (as instructed by the task), as they could filter out all the stimuli presented in a certain spatial location: the decision by the system to process or not the stimuli takes place only after the identification of the color, and not before 400 ms.
This “attentional (or inattentional) reaction time” is sufficiently short to virtually eliminate the responses in the frontal brain regions to nontarget words, as they would otherwise develop only after 400 ms. However, this reaction time is too long to prevent an activation in the ventral visual pathway. This observation caught our attention: the reduction of γ activity in the ventral visual pathway in the inattention condition occurred after 300 ms, that is, after the word had disappeared from the screen. What is therefore the effect of this late deactivation? Most of the γ responses we observed in those regions were biphasic, with an early component unaffected by attention, and a second broader component modified by attention. If the early component already corresponds to the identification of the visual stimulus, then the effect of attention may come too late to prevent that processing, which may explain why the information concerning the words must be filtered at later stages. Alternatively, the second component may be a crucial part of the visual analysis, in which case the attentional modulation we observed would correspond to some degree to an early filtering process.
One final point of discussion concerns the observation that the γ activations in this study were broadband (typically between 50 and 150 Hz), in agreement with previous intracranial studies [Crone et al.,1998; Lachaux et al.,2005,2006; Mainy, in press; Mainy et al.,2006; Tallon‐Baudry et al.,2005; Tanji et al.,2005]. Such broadband activations do not match with the “classical” notion of oscillatory γ band synchronization, which occurs within precise frequency ranges [Singer and Gray,1995]. We note however that synchronization does not necessarily involve precise oscillations, but simply simultaneous firing. In fact, this last property of temporal coordination is sufficient to constitute a mechanism for attentional selection, since it should increase the efficacy of neural firing on target neural populations mediating subsequent processing stages [Fries et al.,2001]. Broadband γ activations may correspond to pseudo‐rythmic synchronous discharges that are as efficient postsynaptically as rythmic discharges. An alternative possibility is that γ band activations indeed correspond to oscillatory phenomena well‐defined in frequency, but that the precise frequency of the oscillations vary from trial to trial, yielding a broadband average response. Indeed, the single‐trial time–frequency maps of intracerebral EEG recordings are characterized by bursts of γ activity variable in frequency across trials [Lachaux et al.,2000]. The reason for this intertrial frequency variability is not known, but a recent study of those γ bursts in the auditory of cats has suggested that it may be due to fluctuations in the arousal of the animals [Lakatos et al.,2004]. Interestingly, shifts of attention were found to modulate the amplitude of the γ bursts, but not their frequency. Future studies that carefully control the arousal of the patients may yield narrower frequency activations.
In conclusion, the present study further supports the view that spectral energy increases and decreases of the γ band EEG constitute insightful markers of the large‐scale networks underlying human cognition (as already suggested by a long list of studies). Furthermore, the present study suggests that these markers may be used as quantitative measures of the attention devoted by an individual to complex tasks such as reading. This lays the foundation for reeducation techniques using biofeedback principles to educate or reeducate attention via online measurements of EEG γ band energy.
Supporting information
Additional Supporting Information may be found in the online version of this article.
Supporting Information Figure 1
Acknowledgements
We are grateful to Dr. Monica Baciu, Bridget, and Thomas Jung for their comments on these data.
REFERENCES
- Allison T, Wood CC, McCarthy G ( 1986): The central nervous system In: Coles M, Donchin E, Porges S, editors. New York: Guilford Press; pp 5–25. [Google Scholar]
- Bentin S, Kutas M, Hillyard SA ( 1995): Semantic processing and memory for attended and unattended words in dichotic listening: Behavioral and electrophysiological evidence. J Exp Psychol Hum Percept Perform 21: 54–67. [DOI] [PubMed] [Google Scholar]
- Bichot NP, Rossi AF, Desimone R ( 2005): Parallel and serial neural mechanisms for visual search in macaque area V4. Science 308: 529–34. [DOI] [PubMed] [Google Scholar]
- Brovelli A, Lachaux JP, Kahane P, Boussaoud D ( 2005): High γ frequency oscillatory activity dissociates attention from intention in the human premotor cortex. Neuroimage 28: 154–64. [DOI] [PubMed] [Google Scholar]
- Buchsbaum BR, Olsen RK, Koch PF, Kohn P, Kippenhan JS, Berman KF ( 2005): Reading, hearing, and the planum temporale. Neuroimage 24: 444–454. [DOI] [PubMed] [Google Scholar]
- Cohen L, Dehaene S, Naccache L, Lehericy S, Dehaene‐Lambertz G, Henaff MA, Michel F ( 2000): The visual word form area: Spatial and temporal characterization of an initial stage of reading in normal subjects and posterior split‐brain patients. Brain 123 (Part 2): 291–307. [DOI] [PubMed] [Google Scholar]
- Cohen L, Jobert A, Le Bihan D, Dehaene S ( 2004): Distinct unimodal and multimodal regions for word processing in the left temporal cortex. Neuroimage 23: 1256–1270. [DOI] [PubMed] [Google Scholar]
- Crone NE, Miglioretti DL, Gordon B, Lesser RP ( 1998): Functional mapping of human sensorimotor cortex with electrocorticographic spectral analysis. II. Event‐related synchronization in the γ band. Brain 121 (Part 12): 2301–2315. [DOI] [PubMed] [Google Scholar]
- Crone NE, Hao L, Hart J Jr, Boatman D, Lesser RP, Irizarry R, Gordon B ( 2001): Electrocorticographic γ activity during word production in spoken and sign language. Neurology 57: 2045–2053. [DOI] [PubMed] [Google Scholar]
- Demb JB, Desmond JE, Wagner AD, Vaidya CJ, Glover GH, Gabrieli JD ( 1995): Semantic encoding and retrieval in the left inferior prefrontal cortex: A functional MRI study of task difficulty and process specificity. J Neurosci 15: 5870–5878. [DOI] [PMC free article] [PubMed] [Google Scholar]
- Demonet JF, Thierry G, Cardebat D ( 2005): Renewal of the neurophysiology of language: Functional neuroimaging. Physiol Rev 85: 49–95. [DOI] [PubMed] [Google Scholar]
- Desimone R, Duncan J ( 1995): Neural mechanisms of selective visual attention. Annu Rev Neurosci 18: 193–222. [DOI] [PubMed] [Google Scholar]
- Devlin JT, Matthews PM, Rushworth MF ( 2003): Semantic processing in the left inferior prefrontal cortex: A combined functional magnetic resonance imaging and transcranial magnetic stimulation study. J Cogn Neurosci 15: 71–84. [DOI] [PubMed] [Google Scholar]
- Driver J ( 2001): A selective review of selective attention research from the past century. Br J Psychol 92 (Part 1): 53–78. [PubMed] [Google Scholar]
- Ferlazzo E, Zifkin BG, Andermann E, Andermann F ( 2005): Cortical triggers in generalized reflex seizures and epilepsies. Brain 128 (Part 4): 700–710. [DOI] [PubMed] [Google Scholar]
- Fiez JA ( 1997): Phonology, semantics, and the role of the left inferior prefrontal cortex. Hum Brain Mapp 5: 79–83. [PubMed] [Google Scholar]
- Fries P, Reynolds JH, Rorie AE, Desimone R ( 2001): Modulation of oscillatory neuronal synchronization by selective visual attention. Science 291: 1560–1563. [DOI] [PubMed] [Google Scholar]
- Gruber T, Muller MM, Keil A, Elbert T ( 1999): Selective visual‐spatial attention alters induced γ band responses in the human EEG. Clin Neurophysiol 110: 2074–2085. [DOI] [PubMed] [Google Scholar]
- Heinze HJ, Mangun GR, Burchert W, Hinrichs H, Scholz M, Munte TF, Gos A, Scherg M, Johannes S, Hundeshagen H, Gazzaniga MS, Hillyard SA ( 1994): Combined spatial and temporal imaging of brain activity during visual selective attention in humans. Nature 372: 543–546. [DOI] [PubMed] [Google Scholar]
- Howard MW, Rizzuto DS, Caplan JB, Madsen JR, Lisman J, Aschenbrenner‐Scheibe R, Schulze‐Bonhage A, Kahana MJ ( 2003): γ oscillations correlate with working memory load in humans. Cereb Cortex 13: 1369–1374. [DOI] [PubMed] [Google Scholar]
- Jobard G, Crivello F, Tzourio‐Mazoyer N ( 2003): Evaluation of the dual route theory of reading: A metanalysis of 35 neuroimaging studies. Neuroimage 20: 693–712. [DOI] [PubMed] [Google Scholar]
- Joubert S, Beauregard M, Walter N, Bourgouin P, Beaudoin G, Leroux JM, Karama S, Lecours AR ( 2004): Neural correlates of lexical and sublexical processes in reading. Brain Lang 89: 9–20. [DOI] [PubMed] [Google Scholar]
- Kahane P, Minotti L, Hoffmann D, Lachaux JP, Ryvlin P ( 2004): Invasive EEG in the definition of the seizure onset zone: Depth electrodes In: Handbook of clinical neurophysiology. Pre‐surgical assessment of the epilepsies with clinical neurophysiology and functional neuroimaging. Rosenow F, Lüders HO, editors: Paris: Elsevier; 109–135 [Google Scholar]
- Kastner S, Pinsk MA ( 2004): Visual attention as a multilevel selection process. Cogn Affect Behav Neurosci 4: 483–500. [DOI] [PubMed] [Google Scholar]
- Lachaux JP, Rodriguez E, Martinerie J, Adam C, Hasboun D, Varela FJ ( 2000): A quantitative study of γ‐band activity in human intracranial recordings triggered by visual stimuli. Eur J Neurosci 12: 2608–2622. [DOI] [PubMed] [Google Scholar]
- Lachaux JP, George N, Tallon‐Baudry C, Martinerie J, Hugueville L, Minotti L, Kahane P, Renault B ( 2005): The many faces of the γ band response to complex visual stimuli. Neuroimage 25: 491–501. [DOI] [PubMed] [Google Scholar]
- Lachaux JP, Hoffmann D, Minotti L, Berthoz A, Kahane P ( 2006): Intracerebral dynamics of saccade generation in the human frontal eye field and supplementary eye field. Neuroimage 30: 1302–1312. [DOI] [PubMed] [Google Scholar]
- Lakatos P, Szilagyi N, Pincze Z, Rajkai C, Ulbert I, Karmos G ( 2004): Attention and arousal related modulation of spontaneous γ‐activity in the auditory cortex of the cat. Brain Res Cogn Brain Res 19: 1–9. [DOI] [PubMed] [Google Scholar]
- Mainy N, Jung J, Commiterri G, Berthoz A, Baciu M, Minotti L, Hoffman D, Kahane P, Bertrand O, Lachaux JP( 2005): The timing of neural processes in humans: beyond the evoked potentials. Chaos Complexity LettVolume 2, issue 2/3. [Google Scholar]
- Mainy N, Kahane P, Minotti L, Hoffmann D, Bertrand O, Lachaux JP ( 2007): Neural correlates of consolidation in working memory. Hum Brain Mapp 28: 183–193. [DOI] [PMC free article] [PubMed] [Google Scholar]
- McCarthy G, Nobre AC ( 1993): Modulation of semantic processing by spatial selective attention. Electroencephalogr Clin Neurophysiol 88: 210–219. [DOI] [PubMed] [Google Scholar]
- Moran J, Desimone R ( 1985): Selective attention gates visual processing in the extrastriate cortex. Science 229: 782–784. [DOI] [PubMed] [Google Scholar]
- Muller MM, Gruber T, Keil A ( 2000): Modulation of induced γ band activity in the human EEG by attention and visual information processing. Int J Psychophysiol 38: 283–299. [DOI] [PubMed] [Google Scholar]
- Naatanen R ( 1975): Selective attention and evoked potentials in humans—A critical review. Biol Psychol 2: 237–307. [DOI] [PubMed] [Google Scholar]
- Niebur E, Hsiao SS, Johnson KO ( 2002): Synchrony: A neuronal mechanism for attentional selection? Curr Opin Neurobiol 12: 190–194. [DOI] [PubMed] [Google Scholar]
- Nobre AC, Allison T, McCarthy G ( 1998): Modulation of human extrastriate visual processing by selective attention to colours and words. Brain 121 (Part 7): 1357–1368. [DOI] [PubMed] [Google Scholar]
- Paulesu E, Frith CD, Frackowiak RS ( 1993): The neural correlates of the verbal component of working memory. Nature 362: 342–345. [DOI] [PubMed] [Google Scholar]
- Petersen SE, Fox PT, Posner MI, Mintun M, Raichle ME ( 1988): Positron emission tomographic studies of the cortical anatomy of single‐word processing. Nature 331: 585–589. [DOI] [PubMed] [Google Scholar]
- Rees G, Russell C, Frith CD, Driver J ( 1999): Inattentional blindness versus inattentional amnesia for fixated but ignored words. Science 286: 2504–2507. [DOI] [PubMed] [Google Scholar]
- Roskies AL, Fiez JA, Balota DA, Raichle ME, Petersen SE ( 2001): Task‐dependent modulation of regions in the left inferior frontal cortex during semantic processing. J Cogn Neurosci 13: 829–843. [DOI] [PubMed] [Google Scholar]
- Ruz M, Wolmetz ME, Tudela P, McCandliss BD ( 2005): Two brain pathways for attended and ignored words. Neuroimage 27: 852–861. [DOI] [PubMed] [Google Scholar]
- Sinai A, Bowers CW, Crainiceanu CM, Boatman D, Gordon B, Lesser RP, Lenz FA, Crone NE ( 2005): Electrocorticographic high γ activity versus electrical cortical stimulation mapping of naming. Brain 128 (Part 7): 1556–1570. [DOI] [PubMed] [Google Scholar]
- Singer W ( 1999): Neuronal synchrony: A versatile code for the definition of relations? Neuron 24: 49–65,111–125. [DOI] [PubMed] [Google Scholar]
- Singer W, Gray CM ( 1995): Visual feature integration and the temporal correlation hypothesis. Annu Rev Neurosci 18: 555–586. [DOI] [PubMed] [Google Scholar]
- Steinmetz PN, Roy A, Fitzgerald PJ, Hsiao SS, Johnson KO, Niebur E ( 2000): Attention modulates synchronized neuronal firing in primate somatosensory cortex. Nature 404: 187–190. [DOI] [PubMed] [Google Scholar]
- Talairach J, Tournoux P ( 1988): Co‐Planar Stereotaxic Atlas of the Human Brain. 3‐Dimensional Proportional System: An Approach to Cerebral Imaging. Stuttgart: Thieme. [Google Scholar]
- Tallon‐Baudry C, Bertrand O ( 1999): Oscillatory γ activity in humans and its role in object representation. Trends Cogn Sci 3: 151–162. [DOI] [PubMed] [Google Scholar]
- Tallon‐Baudry C, Bertrand O, Delpuech C, Permier J ( 1997): Oscillatory γ‐band (30–70 Hz) activity induced by a visual search task in humans. J Neurosci 17: 722–734. [DOI] [PMC free article] [PubMed] [Google Scholar]
- Tallon‐Baudry C, Bertrand O, Henaff MA, Isnard J, Fischer C ( 2005): Attention modulates γ‐band oscillations differently in the human lateral occipital cortex and fusiform gyrus. Cereb Cortex 15: 654–662. [DOI] [PubMed] [Google Scholar]
- Tanji K, Suzuki K, Delorme A, Shamoto H, Nakasato N ( 2005): High‐frequency γ‐band activity in the basal temporal cortex during picture‐naming and lexical‐decision tasks. J Neurosci 25: 3287–3293. [DOI] [PMC free article] [PubMed] [Google Scholar]
- Treue S ( 2001): Neural correlates of attention in primate visual cortex. Trends Neurosci 24: 295–300. [DOI] [PubMed] [Google Scholar]
- Yi DJ, Woodman GF, Widders D, Marois R, Chun MM ( 2004): Neural fate of ignored stimuli: Dissociable effects of perceptual and working memory load. Nat Neurosci 7: 992–996. [DOI] [PubMed] [Google Scholar]
- Zatorre RJ, Meyer E, Gjedde A, Evans AC ( 1996): PET studies of phonetic processing of speech: Review, replication, and reanalysis. Cereb Cortex 6: 21–30. [DOI] [PubMed] [Google Scholar]
Associated Data
This section collects any data citations, data availability statements, or supplementary materials included in this article.
Supplementary Materials
Additional Supporting Information may be found in the online version of this article.
Supporting Information Figure 1