

Abstract
Working memory (WM) dysfunction is a hallmark feature of schizophrenia. Functional imaging studies using WM tasks have documented both prefrontal hypo‐ and hyperactivation in schizophrenia. Schizophrenia is highly heritable, and it is unclear which susceptibility genes modulate WM and its neural correlates. A strong linkage between genetic variants in the dysbindin 1 gene and schizophrenia has been demonstrated. The aim of this study was to investigate the influence of the DTNBP1 schizophrenia susceptibility gene on WM and its neural correlates in healthy individuals. Fifty‐seven right‐handed, healthy male volunteers genotyped for DTNBP1 SNP rs1018381 status were divided in heterozygous risk‐allele carriers (T/C) and homozygous noncarriers (C/C). WM was assessed by a 2‐back vs. 0‐back version of the Continuous Performance Test (CPT), while brain activation was measured with fMRI. DTNBP1 SNP rs1018381 carrier status was determined and correlated with WM performance and brain activation. Despite any differences in behavioral performance, risk‐allele carriers exhibited significantly increased activation of the bilateral middle frontal gyrus (BA 9), a part of the dorsolateral prefrontal cortex (DLPFC), compared to noncarriers. This difference did not correlate with WM performance. The fMRI data provide evidence for an influence of genetic variation in DTNBP1 gene region tagged by SNP rs1018381 on bilateral middle frontal gyrus activation during a WM task. The increased activation in these brain areas may be a consequence of “inefficient” or compensatory DLPFC cognitive control functions. Hum Brain Mapp, 2010. © 2009 Wiley‐Liss, Inc.
Keywords: DTNBP1, rs1018381, fMRI, N‐back task, BA 9
INTRODUCTION
Schizophrenia is a disorder with complex etiology characterized by deficits of cognitive functions such as episodic memory, executive functioning, working memory, and verbal fluency [for review, see Dickinson et al., 2007; Heinrichs and Zakzanis, 1998]. Working memory (WM) is often defined as a limited‐capacity storage system used for the temporary maintenance and manipulation of information [Repovs and Baddeley, 2006], and this cognitive function exhibits considerable deficits in patients with schizophrenia [for review, see Lee and Park, 2005]. One of the main tasks used to study WM functions is the N‐back version of the Continuous Performance Task (CPT) [Cohen et al., 1993]. Thereby subjects are required to monitor the identity or location of a series of verbal or nonverbal stimuli and indicate when the currently presented stimulus is identical to the one presented n trials before. Reaction time, hit rate, omission, and commission errors serve as measurements for WM performance. These characteristics are significantly impaired in patients with schizophrenia and their relatives when compared to healthy subjects [Bedwell et al., 2006; Wang et al., 2007].
The N‐back task has also been one of the most popular experimental paradigms for functional magnetic resonance imaging (fMRI) studies of WM in schizophrenia. Two meta‐analyses reported widespread brain activation during N‐back task in bilateral frontal, prefrontal, and parietal cerebral regions in patients as well as in healthy subjects [Glahn et al., 2005; Owen et al., 2005]. In particular, the dorsolateral prefrontal cortex (DLPFC, Brodmann areas 9/46) plays a regulatory role in the processing of manipulative functions and is of major relevance in the WM functional network [D'esposito et al., 1999; Manoach et al., 2003]. Earlier studies demonstrated decreased DLPFC activation in schizophrenia [e.g. Callicott et al., 1998; Yurgelun‐Todd et al., 1996], while others found evidence for increased activation in this area during performance of WM tasks [Callicott et al., 2000; Manoach et al., 1999]. Recent studies reported mixed results with regard to PFC activation, with hypo‐ [Hill et al., 2004; Perlstein et al., 2003; Salgado‐Pineda et al., 2004] and hyperfrontality [Thermenos et al., 2005] or both [Callicott et al., 2003; Johnson et al., 2006; Schneider et al., 2007; Tan et al., 2006]. An inverted U‐shaped [Callicott et al., 2003; Manoach, 2003] or flatter [Johnson et al., 2006] function between WM load and PFC activation can be deduced as a potential explanation for these controversial patterns indicating reduced load sensitivity in patients. Increasing task demands are first associated with increasing activation, which then falls off after the subject's WM capacity is exceeded, pointing to ineffective processes and/or compensatory mechanisms in schizophrenia while performing WM tasks [Schneider et al., 2007; Tan et al., 2006].
Changes in activation patterns are not only found in patients with schizophrenia but also in their relatives [Keshavan et al., 2002; Thermenos et al., 2004], indicating a possible genetic influence on brain activation related to WM processes. On the behavioral level, the genetic component is further supported by studies in relatives of patients [Barrantes‐Vidal et al., 2007; Dickinson et al., 2007; Ma et al., 2007], subjects at high risk [Brewer et al., 2006; Myles‐Worsley et al., 2007] and prodromal state of schizophrenia [Simon et al., 2007], where all three groups showed WM deficits when compared with controls.
Recently, several susceptibility genes for schizophrenia have been identified, for instance catechol‐O‐methyltransferase (COMT), dystrobrevin binding protein 1 (DTNBP1), neuregulin 1 (NRG1), regulator of G‐protein signaling 4 (RGS4), G72, proline dehydrogenase (PRODH), disrupted‐in‐schizophrenia 1 (DISC1), and d‐amino acid oxidase (DAAO) [Harrison and Weinberger, 2005; Owen et al., 2004b; O'Tuathaigh et al., 2007]. Some of the genes such as COMT [for a review see Tunbridge et al., 2006], DTNBP1 [Burdick et al., 2006, 2007; Donohoe et al., 2007; Luciano et al., 2009; Zinkstok et al., 2007], NRG1 [Hall et al. 2006], DISC1 [Burdick et al., 2005], and G72 [Goldberg et al., 2006] showed an influence on cognition in patients with schizophrenia as well as healthy subjects. Furthermore, numerous recent genetic imaging studies provide evidence that genetic variants of some of these genes, such as (NRG1) [Kircher et al., 2008; Krug et al., 2008], (RGS4) [Buckholtz et al., 2007], (COMT) [Gothelf et al., 2007; Straub et al., 2007; Tan et al., 2007], (DISC1) [Callicott et al., 2005], influence brain activation during WM performance in healthy individuals.
Straub et al. [ 2002] were the first who postulated an association of DTNBP1 (or dysbindin 1) gene with schizophrenia. This gene is located in chromosome 6p22.3 and encodes dysbindin 1 protein, which plays a significant role in modulating glutamatergic neurotransmission in schizophrenia‐related brain regions [for review see Owen et al., 2004a; Williams et al., 2005]. Several SNPs from this gene, mostly intronic, were established in the last years of investigation in worldwide populations [Funke et al., 2004; Kirov et al., 2004; Numakawa et al., 2004; Schwab et al., 2003; Tang et al., 2003; Van Den Bogaert et al., 2003; van den Oord et al., 2003]. Although there are studies reporting negative [Datta et al., 2007; Li and He, 2007] and inconsistent [Mutsuddi et al., 2006], two meta‐analyses supported the positive correlations between DTNBP1 variations and schizophrenia [Owen et al., 2004b; Williams et al., 2005].
The SNP 1018381 is one of the reported SNPs by Straub et al. [ 2002] that has shown strong association with schizophrenia in a series of follow‐up studies [Funke et al., 2004; Schwab et al., 2003; Tang et al., 2003; Van Den Bogaert et al., 2003]. Although the C allele of this SNP was linked to schizophrenia in two studies [Straub et al., 2002; Tang et al., 2003], the opposite T allele of the same SNP showed association in two other studies [Funke et al., 2004; Van Den Bogaert et al., 2003]. Although the allele frequencies of SNP rs1018381 differ between HapMap populations (http://www.ncbi.nlm.nih.gov/SNP/snp_ref.cgi?rs = 1018381), associations with the minor T allele of this SNP were found in a study by Funke et al. [ 2004] in three independent samples of different ethnic origin (white, Hispanic, and African American). In their study, the SNP rs1018381 was conceived as a tagging SNP for the risk six‐locus haplotype (CTCTAC) and its minor T allele showed the most significant association in the white and Hispanic subsets of patients when compared with controls [Funke et al., 2004]. It was the only SNP of this risk‐haplotype that showed a significant effect of genotype on cognitive abilities in Caucasian patients with schizophrenia and Caucasian healthy volunteers [Burdick et al., 2006]. In their study, the minor T allele of SNP rs1018381 was again associated with cognitive deficits in patients and controls. Finally, a recent study on healthy individuals by Luciano et al. [ 2009] provided evidence for a relationship between the rs1018381 minor T allele and cognitive deficits in Australian and Scottish cohorts as well as a trend for an association with the English cohort.
On the basis of the abovementioned background, we hypothesized an influence of genetic variation in DTNBP1 gene region tagged by SNP rs1018381 on brain activation during a WM task in healthy individuals. We expected differences in brain activation in key regions underlying WM processes, such as the prefrontal and parietal cortex.
MATERIALS AND METHODS
Subjects
A sample of 521 subjects (268 men, 253 women) was recruited from students of the RWTH Aachen University. Advertisements were made by word of mouth, posted flyers in institutes and canteens, and an e‐mail was sent to all students of the University. All subjects gave written informed consent, and the study was approved by the local Ethics Committee according to the declaration of Helsinki. After genotyping of the 521 subjects for SNP rs1018381 carrier status, they were divided in 94 heterozygous (T/C) risk‐allele carriers (48 male) and 424 homozygous (C/C) noncarriers (220 male). Because of an extremely low frequency, the group of the homozygous (T/T) risk‐allele carriers (3 female) was excluded from further investigation. The frequency of the SNP rs1018381 genotypes in the whole sample (n = 521) did not deviate from HWE (see also genetic analysis section). For fMRI measurement, 24 subjects were randomly selected from the sample of male risk‐allele carriers and 36 subjects from the sample of male noncarriers. The two groups were matched on IQ, age, years of education, and handedness. Participants had average IQ, ranged from 20 to 35 years, were native German speakers and right‐handed [according to Edinburgh Handedness Scale, Oldfield, 1971], free of neurological and psychiatric disorders according to ICD‐10, and had Western or Middle European ancestry. Health status was assessed by a short semi‐structured interview performed by a psychologist. Two subjects of the carrier and one of the noncarrier samples were excluded from further statistical analyses for not following the instruction of the N‐back task, thus reducing the carrier sample (T/C) to 22 and the noncarrier sample (C/C) to 35 subjects.
The mean age of the carriers (T/C) was 22.4 years (SD = 2.1), their mean education was 15.0 years (SD = 1.5), and their mean IQ‐score was 111.1 (SD = 11.3). The mean age of the noncarriers (C/C) was 23.6 years (SD = 2.8), their mean education was 15.5 years (SD = 2.4), and their mean IQ‐score was 108.2 (SD = 12.5). Both groups did not differ according to age (t df=55 = 1.87, F = 3.11, P = 0.07), education (t df=55 = 1.13, F = 1.05, P = 0.26), or IQ‐scores (t df=55 = 0.86, F = 0.74, P = 0.39).
Genetic Analysis
DNA from peripheral lymphocytes was isolated by a simple salting out procedure. The SNP rs1018381 [P1578 by Straub et al., 2002] was genotyped using Applied Biosystems 7900HT Fast Real‐Time PCR System and TaqMan‐probes designed by Applied Biosystems (Foster City, CA). Primers and VIC/FAM‐probe sequences for rs1018381 detection were as follows: Forward‐5′‐GAGTTACAAGTAAATGAAACGTCATGCA‐3′; Reverse‐5′‐GCTGAGATCTGCCGGTGATTC‐3′; 5′‐VIC‐ACAGCGTGCGGAAC‐3′; 5′‐FAM‐AACAGCATGCGGAAC. For following the true designation of the allelic nomenclature of the SNP rs 1018381 as suggested by Mutsuddi et al. [ 2006] occurrences of G allele were replaced with its complementary C allele and occurrences of the risk A allele were replaced with its complementary risk T allele.
For differences between actual and expected frequencies of the SNP rs1018381, we employed Hardy–Weinberg equilibrium (HWE) equation as implemented in the DeFinetti program [Available online at http://ihg2.helmholtz‐muenchen.de/cgi‐bin/hw/hwa1.pl). For SNP rs1018381, the sample did not significantly deviate from HWE (P = 0.43). The T allele frequency in our sample was 0.093 for the 521 genotyped subjects and this deviates by only ∼1.8% of that observed in the HapMap CEU sample. We replicated more than 15% of genotypes with 100% identical results. The call rate for genotyping was 96.74%. To narrow down the chromosomal region, in which SNPs are tagged by rs1018381 (r 2 > 0.8), we used SNAP Proxy Search [http://www.broad.mit.edu/mpg/snap/; Johnson et al. 2008] on phased HapMap data. Markers pairwise tagged by rs1018381 (r 2 ≥ 0.8) are distributed in a region of ∼160kb (coordinate_HG18:15633432‐15793222) on chromosome 6. As results could be shown that a lot of SNPs in this DTNBP1 gene region (e.g. rs11755055, rs9296984, rs2619535, rs2743550, rs9476860, etc.) are in perfect LD (r 2 = 1.0) with the tagging SNP rs1018381. This suggests that our effects may be due not only to SNP rs1018381 but also to one of these other tagged SNPs.
fMRI Task and Stimuli
The working memory task during fMRI data acquisition consisted of an N‐back paradigm with an alternating sequence of 0‐back and 2‐back conditions arranged in a block design. As stimuli acted red single letters (A–Z) presented on a black background in a pseudorandomized order. After single letter presentation for 500 ms, a blank screen followed for 400 ms. In the blank screen time, sequence subjects had to react by pressing the response button (LUMItouch™ Lightwave Technologies, Richmond, BC, Canada) for the target letter with their right index finger. In the 0‐back condition (selective attention), subjects were instructed to respond every time when the letter “X” occurred and in the 2‐back condition (working memory) every time when the target letter was identical to the one presented two trials before. The target probability for both conditions was 0.37 with a ratio of 48 nontargets to 28 targets. There were four 0‐back blocks alternating with four 2‐back blocks and 8 baseline blocks in between the both (0‐back, 2‐back) conditions. Each block lasted for 30 s and the whole N‐back task had duration of 8 min and 8 s. Stimuli were presented with Presentation 10.1 software package (Neurobehavioral Systems, San Francisco, CA). Subjects were instructed in detail with task examples before scanning procedure, and during the fMRI data acquisition an instruction screen was presented every time the condition changed.
fMRI Data Acquisition
All scanning was performed on a 3‐T Tim Trio MR scanner (Siemens Medical Systems) in the Institute of Neuroscience and Biophysics‐Medicine, Research Centre Jülich. Functional images were collected with echo planar imaging (EPI) sensitive to blood oxygenation level dependent (BOLD) contrast (T2*, 64 × 64 matrix, FoV 200 mm × 200 mm, 36 slices, 3 mm thickness, TR = 2.25 s, TE = 30 ms, flipangle = 90°). Slices covered the whole brain and were positioned transaxially parallel to the anterior‐posterior commissural line (AC‐PC). Two hundred seventeen functional images were collected, and the initial three images excluded from further analysis to remove the influence of T1 stabilization effects. Head movement was minimized by foam wedges which fixed the head in the RF (radio‐frequency) coil. A mirror allowed the subjects to view a screen, which facilitated the presentation of the stimuli via a shielded LCD screen inside the scanner room.
Data Analyses
Behavioral data analysis
Behavioral data of 22 risk‐allele carriers and 35 noncarriers were analyzed for the number of correct responses (hits), false alarms, missed responses, and reaction time. A two‐sample t‐test was used for comparison between both groups with regard to the reaction time variable. A nonparametric test (Mann–Whitney U‐test) was applied for assessing the differences between carriers and noncarriers for hits, false alarms, and misses, because of the small, almost none variance within the groups in these variables.
fMRI data analysis
fMRI data analyses were calculated using Statistical Parametric Mapping software (SPM5; http://www.fil.ion.ucl.ac.uk) implemented in MATLAB 6.5 (Mathworks, Sherborn, MA). After discarding the first three volumes, 214 images from each participant were spatially realigned with rigid‐body transformations using the first image as reference. Next, images were normalised using nonlinear spatial transformations to a standard brain stereotaxic (2 mm × 2 mm × 2 mm) anatomical MNI (Montreal Neurological Institute) space calculated from the mean EPI‐scan of each subject and the EPI‐template. Afterwards, images were smoothed using a 6 mm full ‐width‐at‐half‐maximum (FWHM) Gaussian kernel to increase signal‐to‐noise ratio, accommodate normal variability in functional and gyral anatomy, and facilitate intersubject averaging of measured BOLD signal changes. The volume of interest was restricted to gray matter voxels by use of an exclusive standard white matter mask (WFU PickAtlas toolbox for SPM5; http://www.fil.ion.ucl.ac.uk).
Statistical analysis was performed in a two‐level, mixed‐effects procedure. At the first level, the BOLD responses for the 2‐back and 0‐back condition, respectively, were modeled by a boxcar function convolved with the canonical hemodynamic response function employed by SPM5. Parameter estimate (β) and t‐statistic images were calculated for each subject. At the second level, the individual β‐contrasts relating to activation differences between the 2‐back and the 0‐back condition were analyzed. A one‐sample t‐test was calculated for the whole sample (n = 57) to investigate general WM activation (simple contrast). For exploration of genotype effects, a two‐sample t‐test (high vs. low risk) was calculated. An inclusive mask restricted the analysis to voxels with above‐threshold activation obtained from within‐group (2‐back versus 0‐back) contrasts to include only regions showing activations in both groups (complex cotrast). To correct for multiple comparisons within a search volume, we applied a cluster extent threshold determined by Monte Carlo simulations. In the Monte‐Carlo procedure “sufficient” data sets under the null hypothesis are simulated. Then an uncorrected threshold is applied to each simulated 3D image, and the number of voxels for a cluster to be considered active is increased stepwise [Slotnick et al., 2003]. For an uncorrected threshold at the voxel level at P = 0.001 and spatial properties as presented in this study, 10,000 simulations resulted in an extent threshold of 26 resampled voxels. This procedure prevented a false positive rate above 5% due to multiple testing.
Brain activations were plotted on the anatomical SPM template. All subjects showed head movement smaller than one voxel size according to the SPM5 translation parameters and smaller than three degrees according to the SPM5 rotation parameters. Thus, head movement was minimal and did not lead to artifacts.
RESULTS
Behavioral Data
There were no significant differences on behavioral level between both groups in any of the variables listed earlier (see Table I).
Table I.
Behavioral performance during the N‐back task
| Carriers (T/C) | Noncarriers (C/C) | U | P a | |||
|---|---|---|---|---|---|---|
| Mean | MR | Mean | MR | |||
| Hits | ||||||
| 0‐back | 28.00 | 27.50 | 27.86 | 24.05 | 262.5 | n.s. |
| 2‐back | 25.45 | 27.35 | 25.83 | 23.38 | 243.0 | n.s. |
| False alarms | ||||||
| 0‐back | 0.50 | 21.15 | 0.69 | 22.57 | 235.0 | n.s. |
| 2‐back | 0.80 | 23.18 | 0.93 | 26.26 | 253.5 | n.s. |
| Mean | SD | Mean | SD | F | P b | |
| Reaction time (ms) | ||||||
| 0‐back | 388.74 | 60.56 | 381.67 | 35.15 | 0.27 | n.s. |
| 2‐back | 448.14 | 77.66 | 445.39 | 59.12 | 0.02 | n.s. |
MR, mean rank; SD, standard deviation.
n.s., nonsignificant (all P > 0.5).
Mann–Whitney U‐test.
Two‐sample t‐test.
fMRI Data
The simple contrast (2‐back > 0‐back) for the whole fMRI sample (one‐sample t‐test, FWE corrected, P < 0.05) revealed activations in a wide spread fronto‐temporo‐parietal network (see Fig. 1) typically found in N‐back tasks [for a review see Owen et al., 2005].
Figure 1.
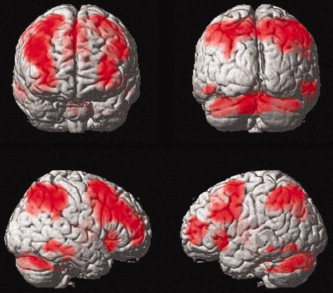
Whole sample (n = 57) brain activation for the contrast 2‐back versus 0‐back condition (one‐sample t‐test; P < 0.05; FWE corrected, cluster extent = 50 voxels). A typical fronto‐temporo‐parietal network hyperactivation for working memory processes was observed.
The group comparison between risk‐allele carriers and noncarriers (two‐sample t‐test, Monte Carlo corrected, P < 0.001) yielded greater activation in bilateral middle frontal gyrus (BA 9) in the carrier group (see Table II, Fig. 2). The activation was inclusively masked by the overall contrast of 2‐back > 0‐back independent of carrier status. The activated areas did not correlate with any of the behavioral data after modeling them as co‐variables in post‐hoc analyses. The reverse complex contrast (0‐back > 2‐back) showed no significant differences in the BOLD signal change between groups.
Table II.
Local cluster‐level maxima of blood oxygen level dependent fMRI signal change during 2‐back condition versus 0‐back baseline condition between carrier group (n = 22) and noncarrier group (n = 35)
| Group/anatomical region | Hemisphere | BA | Coordinates | Z | Cluster size (voxel) | ||
|---|---|---|---|---|---|---|---|
| x | y | z | |||||
| Carriers > noncarriers | |||||||
| Middle frontal gyrus | R | 9 | 26 | 21 | 32 | 4.60 | 34 |
| Middle frontal gyrus | L | 9 | −32 | 34 | 32 | 3.80 | 52 |
| Noncarriers < carriers | |||||||
| No region of stat. significance | |||||||
Coordinates are listed in Talairach and Tournoux (1998) atlas space. BA is the Brodmann area nearest to the coordinate and should be considered approximate. The significance level is given in Z‐values and cluster size in number of voxels for P < 0.001 (corrected by Monte Carlo simulations), extent threshold = 26 voxel.
Figure 2.

Significant group differences in frontal brain activation for the contrast 2‐back versus 0‐back (two‐sample t‐test; P < 0.001, corrected by Monte Carlo simulations; cluster extent = 26 voxels). Risk‐allele carriers (n = 22) exhibited increased activation compared with non‐carriers (n = 35) in bilateral middle frontal gyrus during working memory processes. The crosshairs indicate the global maxima of BOLD responses in left (Tal. coordinates: x = −32, y = 34, z = 28) and right (x = 26, y = 21, z = 32) Brodmann area 9.
DISCUSSION
The aim of this study was to investigate the influence of genetic variation in DTNBP1 gene region tagged by SNP rs1018381 on WM and its neural correlates in healthy individuals. A significant effect of this SNP on brain activation in bilateral middle frontal gyrus (BA 9) during WM performance in healthy individuals was observed. The same SNP showed no significant influence on a behavioral level during N‐back task. No correlation between brain activation and WM performance in relation to risk‐carrier status was identified.
The absence of behavioral differences between risk‐allele carriers and noncarriers was not surprising because of the fact that participants were university students and the task was not really difficult for our participants. Activation patterns for the simple contrast (2‐back > 0‐back) of the whole fMRI sample were consistent with previous studies [e.g. Krug et al., 2008; Schneider et al., 2007] and meta‐analyses [Glahn et al., 2005; Owen et al., 2005], thus confirming the validity of the paradigm and the scanning procedure. The group comparison revealed hyperactivation in bilateral middle frontal gyrus (BA 9) in the carrier group during the WM task (2‐back > 0‐back). This result is in line with increased activation in these regions in patients with schizophrenia when compared with controls during N‐back task [for review see Glahn et al., 2005]. BA 9 (together with BA 46) is consistently associated with working memory processes [for review see Cabeza and Nyberg, 2000; Owen et al., 2005], and its dysregulation is thought to be central to the neurophysiology of schizophrenia [for review see Glahn et al., 2005].
Increased activity in DLPFC has already been found in nonpsychotic and cognitively intact siblings [Callicott et al., 2003; Delawalla et al., 2008] and relatives [Thermenos et al., 2004] of persons with schizophrenia while performing N‐back tasks. Thus, their findings point to a genetic influence on working memory processes related to this brain region and this is in line with our results showing an impact of dysbindin 1 gene on cerebral hyperactivation in the same area.
The DLPFC activity is also related to WM load. Hyperactivation in this area is associated with moderate WM load, while hypoactivation occurs during high and low WM task demands [Callicott et al., 2003; Johnson et al., 2006; Manoach, 2003]. The observed hyperactivation in BA 9 in our study may appear as a consequence of a moderate WM load for university students, which is in line with the hypothesis of the inverted U‐shaped curve function between WM load and PFC activation [Callicott et al., 2003; Manoach, 2003]. Indeed, our participants reported in an informal postscan interview that the 2‐back condition of the N‐back task was not too difficult. Owing to their reports it could be suggested that the increased activation in BA 9 occurs due to a moderate WM load.
However, we can only speculate about the reason of hyperactivation in DLPFC to date. Several authors have already interpreted greater activity in prefrontal cortex during N‐back performance as “inefficient” processing [e.g. Callicott et al., 2003; Delawalla et al., 2008; Thermenos et al., 2004]. One possible explanation of this “inefficient” DLPFC function is a difference in strategy use. Braver et al. [ 2007] have proposed proactive and reactive cognitive control strategies. Employing a proactive strategy, participants pay attention to the cue as soon as it appears and prepare for a response to the subsequent target, whereas a reactive strategy involves minimal processing of the cue information at the time of presentation but requires reactivation of the cue information when the target appears. It is possible that patients with schizophrenia and their relatives may employ a reactive strategy, which is less efficient than a proactive strategy probably utilized by healthy individuals. Another alternative explanation of hyperactivation in DLPFC comes from a recent study by MacDonald et al. [ 2006] who found subtle reductions in prefrontal activity for relatives following cue presentation and an increase following the target. Thus, an increase in activity is based on target‐related activity rather than cue maintenance. On the basis of their findings, we speculate that risk‐allele carriers may require additional resources, as indexed by bilateral BA 9 activity, to compensate for the suboptimal cognitive strategy to accomplish a certain level of WM performance.
Finally, we identified enhanced fMRI responses in BA 9, a part of DLPFC, during WM activation. This difference in brain activation was not manifested in behavior. Because it could be suggested that at some level the cellular strategy for processing WM information is abnormal in healthy risk‐allele carriers and genetic variation of dysbindin 1 gene could contribute to this difference. Indeed, a proximate study by our own group [Nickl‐Jockschat et al., in prep) used diffusion tensor imaging (DTI) as measurement method revealed evidence for increased white matter connectivity in the left middle frontal lobe and right superior medial gyrus due to influence of genetic variation in DTNBP1 gene region tagged by SNP rs1018381. Thus, increased anatomic connectivity in these brain regions might lead to hyperactivations in the same or adjacent brain areas in the frontal lobe in risk‐allele carriers during an N‐back working memory task.
CONCLUSION
Our results provide evidence for an influence of genetic variation in DTNBP1 gene region tagged by SNP rs1018381 on brain activation in bilateral middle frontal gyrus during WM task in healthy individuals. These regions have previously been related to WM processes and are further core neuropathological areas in schizophrenia. The increased activation of the observed cortical areas in the current study may occur due to a moderate WM load and “inefficient” or compensatory DLPFC cognitive control functions. Genetic variation of DTNBP1 gene may play a significant role at the cellular level for qualitative difference in information processing within the DLPFC. The stronger brain activity in risk‐allele carriers appears in absence of performance differences between risk‐allele carriers and non‐carriers, suggesting that brain activation can act as a more sensitive measure than behavioral performance, which can contribute to a better investigation, diagnostic and prevention of schizophrenia.
Acknowledgements
This work is a part of the thesis of Mr. Markov. We thank Carin Whitney, Anna Weiss, Jane Horn, Petra Engels, Veronika Ermer, and Dorothe Krug for their assistance and support as well as all the participants of this study.
REFERENCES
- Barrantes‐Vidal N, Aguilera M, Campanera S, Fatjo‐Vilas M, Guitart M, Miret S, Valero S, Fananas L ( 2007): Working memory in siblings of schizophrenia patients. Schizophr Res 95: 70–75. [DOI] [PubMed] [Google Scholar]
- Bedwell JS, Kamath V, Baksh E ( 2006): Comparison of three computer‐administered cognitive tasks as putative endophenotypes of schizophrenia. Schizophr Res 88: 36–46. [DOI] [PubMed] [Google Scholar]
- Braver TS, Gray JR, Burgess GC ( 2007): Explaining the many varieties of working memory variation: Dual mechanisms of cognitive control In: Conway AR, Jarrold C, Kane M, Miyake A, Towse J, editors. Variation in Working Memory. Oxford: Oxford University Press; pp 76–109. [Google Scholar]
- Brewer WJ, Wood SJ, Phillips LJ, Francey SM, Pantelis C, Yung AR, Cornblatt B, McGorry PD ( 2006): Generalized and specific cognitive performance in clinical high‐risk cohorts: A review highlighting potential vulnerability markers for psychosis. Schizophr Bull 32: 538–555. [DOI] [PMC free article] [PubMed] [Google Scholar]
- Buckholtz JW, Meyer‐Lindenberg A, Honea RA, Straub RE, Pezawas L, Egan MF, Vakkalanka R, Kolachana B, Verchinski BA, Sust S, Mattay VS, Weinberger DR, Callicott JH ( 2007): Allelic variation in RGS4 impacts functional and structural connectivity in the human brain. J Neurosci 27: 1584–1593. [DOI] [PMC free article] [PubMed] [Google Scholar]
- Burdick KE, Hodgkinson CA, Szeszko PR, Lencz T, Ekholm JM, Kane JM, Goldman D, Malhotra AK ( 2005): DISC1 and neurocognitive function in schizophrenia. Neuroreport 16: 1399–1402. [DOI] [PubMed] [Google Scholar]
- Burdick KE, Lencz T, Funke B, Finn CT, Szeszko PR, Kane JM, Kucherlapati R, Malhotra AK ( 2006): Genetic variation in DTNBP1 influences general cognitive ability. Hum Mol Genet 15: 1563–1568. [DOI] [PubMed] [Google Scholar]
- Burdick KE, Goldberg TE, Funke B, Bates JA, Lencz T, Kucherlapati R, Malhotra AK ( 2007): DTNBP1 genotype influences cognitive decline in schizophrenia. Schizophr Res 89: 169–172. [DOI] [PMC free article] [PubMed] [Google Scholar]
- Cabeza R, Nyberg L ( 2000): Imaging cognition II: An empirical review of 275 PET and fMRI studies. J Cogn Neurosci 12: 1–47. [DOI] [PubMed] [Google Scholar]
- Callicott JH, Ramsey NF, Tallent K, Bertolino A, Knable MB, Coppola R, Goldberg T, van Gelderen P, Mattay VS, Frank JA, Moonen CT, Weinberger DR ( 1998): Functional magnetic resonance imaging brain mapping in psychiatry: Methodological issues illustrated in a study of working memory in schizophrenia. Neuropsychopharmacology 18: 186–196. [DOI] [PubMed] [Google Scholar]
- Callicott JH, Bertolino A, Mattay VS, Langheim FJ, Duyn J, Coppola R, Goldberg TE, Weinberger DR ( 2000): Physiological dysfunction of the dorsolateral prefrontal cortex in schizophrenia revisited. Cereb Cortex 10: 1078–1092. [DOI] [PubMed] [Google Scholar]
- Callicott JH, Mattay VS, Verchinski BA, Marenco S, Egan MF, Weinberger DR ( 2003): Complexity of prefrontal cortical dysfunction in schizophrenia: More than up or down. Am J Psychiatry 160: 2209–2215. [DOI] [PubMed] [Google Scholar]
- Callicott JH, Straub RE, Pezawas L, Egan MF, Mattay VS, Hariri AR, Verchinski BA, Meyer‐Lindenberg A, Balkissoon R, Kolachana B, Goldberg TE, Weinberger DR ( 2005): Variation in DISC1 affects hippocampal structure and function and increases risk for schizophrenia. Proc Natl Acad Sci U S A 102: 8627–8632. [DOI] [PMC free article] [PubMed] [Google Scholar]
- Cohen JD, Forman SD, Braver TS, Casey BJ, Servan‐Schreiber D, Noll DC ( 1993): Activation of the prefrontal cortex in a nonspatial working memory task with functional MRI. Hum Brain Mapp 1: 293–304. [DOI] [PubMed] [Google Scholar]
- D'Esposito M, Postle BR, Ballard D, Lease J ( 1999): Maintenance versus manipulation of information held in working memory: An event‐related fMRI study. Brain Cogn 41: 66–86. [DOI] [PubMed] [Google Scholar]
- Datta SR, McQuillin A, Puri V, Choudhury K, Thirumalai S, Lawrence J, Pimm J, Bass N, Lamb G, Moorey H, Morgan J, Punukollu B, Kandasami G, Kirwin S, Sule A, Quested D, Curtis D, Gurling HM ( 2007): Failure to confirm allelic and haplotypic association between markers at the chromosome 6p22.3 dystrobrevin‐binding protein 1 (DTNBP1) locus and schizophrenia. Behav Brain Funct 3: 50. [DOI] [PMC free article] [PubMed] [Google Scholar]
- Delawalla Z, Csernansky JG, Barch DM ( 2008): Prefrontal cortex function in nonpsychotic siblings of individuals with schizophrenia. Biol Psychiatry 63: 490–497. [DOI] [PMC free article] [PubMed] [Google Scholar]
- Dickinson D, Ramsey ME, Gold JM ( 2007): Overlooking the obvious: A meta‐analytic comparison of digit symbol coding tasks and other cognitive measures in schizophrenia. Arch Gen Psychiatry 64: 532–542. [DOI] [PubMed] [Google Scholar]
- Donohoe G, Morris DW, Clarke S, McGhee KA, Schwaiger S, Nangle JM, Garavan H, Robertson IH, Gill M, Corvin A ( 2007): Variance in neurocognitive performance is associated with dysbindin‐1 in schizophrenia: A preliminary study. Neuropsychologia 45: 454–458. [DOI] [PubMed] [Google Scholar]
- Funke B, Finn CT, Plocik AM, Lake S, DeRosse P, Kane JM, Kucherlapati R, Malhotra AK ( 2004): Association of the DTNBP1 locus with schizophrenia in a U.S. population. Am J Hum Genet 75: 891–898. [DOI] [PMC free article] [PubMed] [Google Scholar]
- Glahn DC, Ragland JD, Abramoff A, Barrett J, Laird AR, Bearden CE, Velligan DI ( 2005): Beyond hypofrontality: A quantitative meta‐analysis of functional neuroimaging studies of working memory in schizophrenia. Hum Brain Mapp 25: 60–69. [DOI] [PMC free article] [PubMed] [Google Scholar]
- Goldberg TE, Straub RE, Callicott JH, Hariri A, Mattay VS, Bigelow L, Coppola R, Egan MF, Weinberger DR ( 2006): The G72/G30 gene complex and cognitive abnormalities in schizophrenia. Neuropsychopharmacology 31: 2022–2032. [DOI] [PubMed] [Google Scholar]
- Gothelf D, Hoeft F, Hinard C, Hallmayer JF, Stoecker JV, Antonarakis SE, Morris MA, Reiss AL ( 2007): Abnormal cortical activation during response inhibition in 22q11.2 deletion syndrome. Hum Brain Mapp 28: 533–542. [DOI] [PMC free article] [PubMed] [Google Scholar]
- Hall J, Whalley HC, Job DE, Baig BJ, McIntosh AM, Evans KL, Thomson PA, Porteous DJ, Cunningham‐Owens DG, Johnstone EC, Lawrie SM ( 2006): A neuregulin 1 variant associated with abnormal cortical function and psychotic symptoms. Nat Neurosci 9: 1477–1478. [DOI] [PubMed] [Google Scholar]
- Harrison PJ, Weinberger DR ( 2005): Schizophrenia genes, gene expression, and neuropathology: On the matter of their convergence. Mol Psychiatry 10: 40–68; image 5. [DOI] [PubMed] [Google Scholar]
- Heinrichs RW, Zakzanis KK ( 1998): Neurocognitive deficit in schizophrenia: A quantitative review of the evidence. Neuropsychology 12: 426–445. [DOI] [PubMed] [Google Scholar]
- Hill K, Mann L, Laws KR, Stephenson CM, Nimmo‐Smith I, McKenna PJ ( 2004): Hypofrontality in schizophrenia: A meta‐analysis of functional imaging studies. Acta Psychiatr Scand 110: 243–256. [DOI] [PubMed] [Google Scholar]
- Johnson MR, Morris NA, Astur RS, Calhoun VD, Mathalon DH, Kiehl KA, Pearlson GD ( 2006): A functional magnetic resonance imaging study of working memory abnormalities in schizophrenia. Biol Psychiatry 60: 11–21. [DOI] [PubMed] [Google Scholar]
- Johnson AD, Handsaker RE, Pulit SL, Nizzari MM, O'Donnell CJ, de Bakker PI ( 2008): SNAP: A web‐based tool for identification and annotation of proxy SNPs using HapMap. Bioinformatics 24: 2938–2939. [DOI] [PMC free article] [PubMed] [Google Scholar]
- Keshavan MS, Diwadkar VA, Spencer SM, Harenski KA, Luna B, Sweeney JA ( 2002): A preliminary functional magnetic resonance imaging study in offspring of schizophrenic parents. Prog Neuropsychopharmacol Biol Psychiatry 26: 1143–1149. [DOI] [PubMed] [Google Scholar]
- Kircher T, Thienel R, Wagner M, Reske M, Habel U, Kellermann T, Frommann I, Schwab S, Wolwer W, von Wilmsdorf M, Braus DF, Schmitt A, Rapp A, Stöcker T, Shah NJ, Henn FA, Sauer H, Gaebel W, Maier W, Schneider F ( 2009): Neuregulin 1 ICE‐single nucleotide polymorphism in first episode schizophrenia correlates with cerebral activation in fronto‐temporal areas. Eur Arch Psychiatry Clin Neurosci 259: 72–79. [DOI] [PubMed] [Google Scholar]
- Kirov G, Ivanov D, Williams NM, Preece A, Nikolov I, Milev R, Koleva S, Dimitrova A, Toncheva D, O'Donovan MC, Owen MJ ( 2004): Strong evidence for association between the dystrobrevin binding protein 1 gene (DTNBP1) and schizophrenia in 488 parent‐offspring trios from Bulgaria. Biol Psychiatry 55: 971–975. [DOI] [PubMed] [Google Scholar]
- Krug A, Markov V, Eggermann T, Krach S, Zerres K, Stocker T, Shah NJ, Schneider F, Nothen MM, Treutlein J, Rietschel M, Kircher T ( 2008): Genetic variation in the schizophrenia‐risk gene neuregulin1 correlates with differences in frontal brain activation in a working memory task in healthy individuals. Neuroimage 23: 344–349. [DOI] [PubMed] [Google Scholar]
- Lee J, Park S ( 2005): Working memory impairments in schizophrenia: A meta‐analysis. J Abnorm Psychol 114: 599–611. [DOI] [PubMed] [Google Scholar]
- Li D, He L ( 2007): Association study between the dystrobrevin binding protein 1 gene (DTNBP1) and schizophrenia: A meta‐analysis. Schizophr Res 96: 112–118. [DOI] [PubMed] [Google Scholar]
- Luciano M, Miyajima F, Lind PA, Bates TC, Horan M, Harris SE, Wright MJ, Ollier WE, Hayward C, Pendleton N, Gow AJ, Visscher PM, Starr JM, Deary IJ, Martin NG, Payton A ( 2009): Variation in the dysbindin gene and normal cognitive function in three independent population samples. Genes Brain Behav 8: 218–227. [DOI] [PubMed] [Google Scholar]
- Ma X, Wang Q, Sham PC, Liu X, Rabe‐Hesketh S, Sun X, Hu J, Meng H, Chen W, Chen EY, Deng W, Chan RC, Murray RM, Collier DA, Li T ( 2007): Neurocognitive deficits in first‐episode schizophrenic patients and their first‐degree relatives. Am J Med Genet B Neuropsychiatr Genet 144B: 407–416. [DOI] [PubMed] [Google Scholar]
- MacDonald AW III, Becker TM, Carter CS ( 2006): Functional magnetic resonance imaging study of cognitive control in the healthy relatives of schizophrenia patients. Biol Psychiatry 60: 1241–1249. [DOI] [PubMed] [Google Scholar]
- Manoach DS ( 2003): Prefrontal cortex dysfunction during working memory performance in schizophrenia: Reconciling discrepant findings. Schizophr Res 60: 285–298. [DOI] [PubMed] [Google Scholar]
- Manoach DS, Press DZ, Thangaraj V, Searl MM, Goff DC, Halpern E, Saper CB, Warach S ( 1999): Schizophrenic subjects activate dorsolateral prefrontal cortex during a working memory task, as measured by fMRI. Biol Psychiatry 45: 1128–1137. [DOI] [PubMed] [Google Scholar]
- Manoach DS, Greve DN, Lindgren KA, Dale AM ( 2003): Identifying regional activity associated with temporally separated components of working memory using event‐related functional MRI. Neuroimage 20: 1670–1684. [DOI] [PubMed] [Google Scholar]
- Mutsuddi M, Morris DW, Waggoner SG, Daly MJ, Scolnick EM, Sklar P ( 2006): Analysis of high‐resolution HapMap of DTNBP1 (Dysbindin) suggests no consistency between reported common variant associations and schizophrenia. Am J Hum Genet 79: 903–909. [DOI] [PMC free article] [PubMed] [Google Scholar]
- Myles‐Worsley M, Ord LM, Ngiralmau H, Weaver S, Blailes F, Faraone SV ( 2007): The Palau Early Psychosis Study: Neurocognitive functioning in high‐risk adolescents. Schizophr Res 89: 299–307. [DOI] [PubMed] [Google Scholar]
- Numakawa T, Yagasaki Y, Ishimoto T, Okada T, Suzuki T, Iwata N, Ozaki N, Taguchi T, Tatsumi M, Kamijima K, Straub RE, Weinberger DR, Kunugi H, Hashimoto R ( 2004): Evidence of novel neuronal functions of dysbindin, a susceptibility gene for schizophrenia. Hum Mol Genet 13: 2699–2708. [DOI] [PubMed] [Google Scholar]
- O'Tuathaigh CM, Babovic D, O'Meara G, Clifford JJ, Croke DT, Waddington JL ( 2007): Susceptibility genes for schizophrenia: Characterisation of mutant mouse models at the level of phenotypic behaviour. Neurosci Biobehav Rev 31: 60–78. [DOI] [PubMed] [Google Scholar]
- Oldfield RC ( 1971): The assessment and analysis of handedness: The Edinburgh inventory. Neuropsychologia 9: 97–113. [DOI] [PubMed] [Google Scholar]
- Owen MJ, Williams NM, O'Donovan MC ( 2004a): Dysbindin‐1 and schizophrenia: From genetics to neuropathology. J Clin Invest 113: 1255–1257. [DOI] [PMC free article] [PubMed] [Google Scholar]
- Owen MJ, Williams NM, O'Donovan MC ( 2004b): The molecular genetics of schizophrenia: New findings promise new insights. Mol Psychiatry 9: 14–27. [DOI] [PubMed] [Google Scholar]
- Owen AM, McMillan KM, Laird AR, Bullmore E ( 2005): N‐back working memory paradigm: A meta‐analysis of normative functional neuroimaging studies. Hum Brain Mapp 25: 46–59. [DOI] [PMC free article] [PubMed] [Google Scholar]
- Perlstein WM, Dixit NK, Carter CS, Noll DC, Cohen JD ( 2003): Prefrontal cortex dysfunction mediates deficits in working memory and prepotent responding in schizophrenia. Biol Psychiatry 53: 25–38. [DOI] [PubMed] [Google Scholar]
- Repovs G, Baddeley A ( 2006): The multi‐component model of working memory: Explorations in experimental cognitive psychology. Neuroscience 139: 5–21. [DOI] [PubMed] [Google Scholar]
- Salgado‐Pineda P, Junque C, Vendrell P, Baeza I, Bargallo N, Falcon C, Bernardo M ( 2004): Decreased cerebral activation during CPT performance: Structural and functional deficits in schizophrenic patients. Neuroimage 21: 840–847. [DOI] [PubMed] [Google Scholar]
- Schneider F, Habel U, Reske M, Kellermann T, Stocker T, Shah NJ, Zilles K, Braus DF, Schmitt A, Schlosser R, Wagner M, Frommann I, Kircher T, Rapp A, Meisenzahl E, Ufer S, Ruhrmann S, Thienel R, Sauer H, Henn FA, Gaebel W ( 2007): Neural correlates of working memory dysfunction in first‐episode schizophrenia patients: An fMRI multi‐center study. Schizophr Res 89: 198–210. [DOI] [PubMed] [Google Scholar]
- Schwab SG, Knapp M, Mondabon S, Hallmayer J, Borrmann‐Hassenbach M, Albus M, Lerer B, Rietschel M, Trixler M, Maier W, Wildenauer DB ( 2003): Support for association of schizophrenia with genetic variation in the 6p22.3 gene, dysbindin, in sib‐pair families with linkage and in an additional sample of triad families. Am J Hum Genet 72: 185–190. [DOI] [PMC free article] [PubMed] [Google Scholar]
- Simon AE, Cattapan‐Ludewig K, Zmilacher S, Arbach D, Gruber K, Dvorsky DN, Roth B, Isler E, Zimmer A, Umbricht D ( 2007): Cognitive functioning in the schizophrenia prodrome. Schizophr Bull 33: 761–771. [DOI] [PMC free article] [PubMed] [Google Scholar]
- Slotnick SD, Moo LR, Segal JB, Hart J Jr ( 2003): Distinct prefrontal cortex activity associated with item memory and source memory for visual shapes. Brain Res Cogn Brain Res 17: 75–82. [DOI] [PubMed] [Google Scholar]
- Straub RE, Jiang Y, MacLean CJ, Ma Y, Webb BT, Myakishev MV, Harris‐Kerr C, Wormley B, Sadek H, Kadambi B, Cesare AJ, Gibberman A, Wang X, O'Neill FA, Walsh D, Kendler KS ( 2002): Genetic variation in the 6p22.3 gene DTNBP1, the human ortholog of the mouse dysbindin gene, is associated with schizophrenia. Am J Hum Genet 71: 337–348. [DOI] [PMC free article] [PubMed] [Google Scholar]
- Straub RE, Lipska BK, Egan MF, Goldberg TE, Callicott JH, Mayhew MB, Vakkalanka RK, Kolachana BS, Kleinman JE, Weinberger DR ( 2007): Allelic variation in GAD1 (GAD67) is associated with schizophrenia and influences cortical function and gene expression. Mol Psychiatry 12: 854–869. [DOI] [PubMed] [Google Scholar]
- Tan HY, Sust S, Buckholtz JW, Mattay VS, Meyer‐Lindenberg A, Egan MF, Weinberger DR, Callicott JH ( 2006): Dysfunctional prefrontal regional specialization and compensation in schizophrenia. Am J Psychiatry 163: 1969–1977. [DOI] [PubMed] [Google Scholar]
- Tan HY, Chen Q, Sust S, Buckholtz JW, Meyers JD, Egan MF, Mattay VS, Meyer‐Lindenberg A, Weinberger DR, Callicott JH ( 2007): Epistasis between catechol‐O‐methyltransferase and type II metabotropic glutamate receptor 3 genes on working memory brain function. Proc Natl Acad Sci USA 104: 12536–12541. [DOI] [PMC free article] [PubMed] [Google Scholar]
- Tang JX, Zhou J, Fan JB, Li XW, Shi YY, Gu NF, Feng GY, Xing YL, Shi JG, He L ( 2003): Family‐based association study of DTNBP1 in 6p22.3 and schizophrenia. Mol Psychiatry 8: 717–718. [DOI] [PubMed] [Google Scholar]
- Thermenos HW, Seidman LJ, Breiter H, Goldstein JM, Goodman JM, Poldrack R, Faraone SV, Tsuang MT ( 2004): Functional magnetic resonance imaging during auditory verbal working memory in nonpsychotic relatives of persons with schizophrenia: A pilot study. Biol Psychiatry 55: 490–500. [DOI] [PubMed] [Google Scholar]
- Thermenos HW, Goldstein JM, Buka SL, Poldrack RA, Koch JK, Tsuang MT, Seidman LJ ( 2005): The effect of working memory performance on functional MRI in schizophrenia. Schizophr Res 74: 179–194. [DOI] [PubMed] [Google Scholar]
- Tunbridge EM, Harrison PJ, Weinberger DR ( 2006): Catechol‐o‐methyltransferase, cognition, and psychosis: Val158Met and beyond. Biol Psychiatry 60: 141–151. [DOI] [PubMed] [Google Scholar]
- Van Den Bogaert A, Schumacher J, Schulze TG, Otte AC, Ohlraun S, Kovalenko S, Becker T, Freudenberg J, Jonsson EG, Mattila‐Evenden M, Sedvall GC, Czerski PM, Kapelski P, Hauser J, Maier W, Rietschel M, Propping P, Nöthen MM, Cichon S ( 2003): The DTNBP1 (dysbindin) gene contributes to schizophrenia, depending on family history of the disease. Am J Hum Genet 73: 1438–1443. [DOI] [PMC free article] [PubMed] [Google Scholar]
- van den Oord EJ, Sullivan PF, Jiang Y, Walsh D, O'Neill FA, Kendler KS, Riley BP ( 2003): Identification of a high‐risk haplotype for the dystrobrevin binding protein 1 (DTNBP1) gene in the Irish study of high‐density schizophrenia families. Mol Psychiatry 8: 499–510. [DOI] [PubMed] [Google Scholar]
- Wang Q, Chan R, Sun J, Yao J, Deng W, Sun X, Liu X, Sham PC, Ma X, Meng H, Murray RM, Collier DA, Li T ( 2007): Reaction time of the Continuous Performance Test is an endophenotypic marker for schizophrenia: A study of first‐episode neuroleptic‐naive schizophrenia, their non‐psychotic first‐degree relatives and healthy population controls. Schizophr Res 89: 293–298. [DOI] [PubMed] [Google Scholar]
- Williams NM, O'Donovan MC, Owen MJ ( 2005): Is the dysbindin gene (DTNBP1) a susceptibility gene for schizophrenia? Schizophr Bull 31: 800–805. [DOI] [PubMed] [Google Scholar]
- Yurgelun‐Todd DA, Waternaux CM, Cohen BM, Gruber SA, English CD, Renshaw PF ( 1996): Functional magnetic resonance imaging of schizophrenic patients and comparison subjects during word production. Am J Psychiatry 153: 200–205. [DOI] [PubMed] [Google Scholar]
- Zinkstok JR, de Wilde O, van Amelsvoort TA, Tanck MW, Baas F, Linszen DH ( 2007): Association between the DTNBP1 gene and intelligence: a case‐control study in young patients with schizophrenia and related disorders and unaffected siblings. Behav Brain Funct 3: 19. [DOI] [PMC free article] [PubMed] [Google Scholar]