

Abstract
Multimodal integration of nonverbal social signals is essential for successful social interaction. Previous studies have implicated the posterior superior temporal sulcus (pSTS) in the perception of social signals such as nonverbal emotional signals as well as in social cognitive functions like mentalizing/theory of mind. In the present study, we evaluated the relationships between trait emotional intelligence (EI) and fMRI activation patterns in individual subjects during the multimodal perception of nonverbal emotional signals from voice and face. Trait EI was linked to hemodynamic responses in the right pSTS, an area which also exhibits a distinct sensitivity to human voices and faces. Within all other regions known to subserve the perceptual audiovisual integration of human social signals (i.e., amygdala, fusiform gyrus, thalamus), no such linked responses were observed. This functional difference in the network for the audiovisual perception of human social signals indicates a specific contribution of the pSTS as a possible interface between the perception of social information and social cognition. Hum Brain Mapp, 2010. © 2009 Wiley‐Liss, Inc.
Keywords: crossmodal integration, facial expression, prosody, social cognition, STS
INTRODUCTION
The multimodal integration of social signals (verbal and nonverbal, e.g., facial expressions, speech melody, gestures) into a unitary perception is a basic part of successful social interaction. This perception then allows us to infer the intentions and emotional states of our counterparts.
During the past years, a multitude of neuroimaging studies on the perceptions of: voices [e.g., Belin et al., 2000; Belizaire et al., 2007; Fecteau et al., 2004; Giraud et al., 2004; Kriegstein and Giraud, 2004], faces [e.g., Haxby et al., 1994; Kanwisher et al., 1997], nonverbal social information transported in speech melody [e.g., Buchanan et al., 2000; Dietrich et al., 2008; Ethofer et al., 2006b,c; George et al., 1996; Imaizumi et al., 1997; Kotz et al., 2003; Mitchell et al., 2003; Warren et al., 2006; Wiethoff et al., 2008; Wildgruber et al., 2002, 2004, 2005; reviewed in: Wildgruber et al., 2006], and social signals conveyed via facial expressions [e.g. Blair et al., 1999; Breiter et al., 1996; Morris et al., 1996; Phillips et al., 1997; reviewed in: Posamentier and Abdi, 2003] have accumulated. These studies form a solid groundwork for further investigations into the integration of audiovisual socially salient signals via functional neuroimaging.
Neuroimaging studies exploring the neural correlates of the audiovisual integration of nonverbal social signals [i.e., emotional expressions; Dolan et al., 2001; Ethofer et al., 2006a,d; Kreifelts et al., 2007; Pourtois et al., 2005] have established a network of brain regions including the bilateral posterior superior temporal sulcus (pSTS), right thalamus, left amygdala, and the right fusiform gyrus. On this basis, the aforementioned five regions were defined as a priori anatomical regions of interest for the present study. In almost all of these studies, the audiovisual integration of social signals was investigated during an explicit evaluation task of social information. This approach allows a direct link between behavioral integration effects (e.g., differences in valence ratings, a higher classification hit rate, faster reaction times) and corresponding changes in brain function [Ethofer et al., 2006a; Kreifelts et al., 2007].
It is, however, much more common in our everyday lives to integrate social information in an implicit, unattended fashion. There is both behavioral and electrophysiological evidence [De Gelder and Vroomen, 2000; Ethofer et al., 2006a; Pourtois et al., 2000; Vroomen et al., 2001] that crossmodal integration of nonverbal social signals is a mandatory process, which takes place very early (110–220 ms after stimulus onset) and independently of attentional resources. Thus, the main goal of the present study was to investigate the neural correlates of the audiovisual integration of social signals from voice and face under implicit conditions.
A problem that arises with respect to the study of implicit integration of social information is the lack of a direct measure for the integration effect. The application of priming paradigms is one way to obtain behavioral data within the framework of implicit processing studies [e.g., Mogg and Bradley, 1999; Pourtois et al., 2004]. Another approach is based on an analysis of individual differences in personality or dispositional affect, which are paralleled by distinct brain activation patterns [Hamann and Canli, 2004]. This relationship can also be regarded from the reversed perspective: if a certain brain activation pattern found during implicit processing of social signals can be linked to a certain psychometric measure of trait or personality, it seems likely that the activation pattern reflects a process related to this psychometric measure.
Successful integration of social signals into an adequate social perception appears as a precondition for a set of social skills that have been united in a construct, which has been termed emotional intelligence [EI; Salovey and Mayer, 1990]. Moreover, it has been demonstrated that a deficiency in integration and perception of social information (in relationship with several psychiatric diseases: autism, schizophrenia, and psychopathy) impedes both modulation of emotions and their utilization to further one's social aims. This deficiency may lead to severely impaired social functioning and a reduction of EI [for reviews, see Couture et al., 2006; Eack et al., 2007; Kohler and Martin, 2006; Tremeau, 2006; van Honk and Schutter, 2006]. We assessed individual trait EI as an indirect measure of the multimodal integration of social signals from voice and face by using the self‐report emotional intelligence test [SREIT; Schutte et al., 1998]. This test was designed in accordance with the Salovey and Mayer model of EI [Salovey and Mayer, 1990]. Yet, it ought to be dealt with as a trait measure due to the fact that, being a self‐report measure, it might picture behavioral dispositions and self‐perceived emotional competence rather than actual abilities [Petrides and Furnham, 2001].
On the level of brain activation, audiovisual integration during the perception of social signals from voice and face can be formalized as a stronger response to audiovisual stimulation than to either unimodal stimulation. Since perception of social communicative signals is prerequisite for successful social interaction and crossmodal integration improves understanding of these signals, we hypothesized that the individual size of this integration effect would correlate with the subjects' trait EI (SREIT score) within brain areas subserving audiovisual integration. This association could then be interpreted as evidence that the corresponding activation pattern reflects integration of social information.
In human communication, voices and faces constitute the carrier signals for social signals conveyed via speech melody and facial expressions. Therefore, we investigated, as a further point of interest, whether or not those brain regions contributing to audiovisual integration of social signals might also exhibit both sensitivity to human faces and to human voices.
To address the issues described above, we performed a series of functional magnetic resonance imaging (fMRI) experiments. Since nonverbal emotional expressions constitute strong and prototypical social signals, we employed dynamic stimuli (videos) from various emotional categories under the implicit emotion processing conditions of a gender classification task. Activations under audiovisual (AV) stimulation were compared to those under auditory (A) and visual (V) stimulation. Only audiovisual integration areas, i.e. areas with a significantly stronger response to bimodal than to either unimodal stimulation, were considered for further analysis. Within these regions, the relationship between interindividual differences in audiovisual integration effects at the level of hemodynamic responses and interindividual differences in trait EI was assessed.
Additionally, the audiovisual integration sites were investigated with respect to their sensitivity to human faces and voices. To this end, two more fMRI experiments were conducted. The first of these was designed to determine voice sensitivity by comparing responses to human vocal sounds with sounds from animals and from the environment. In the second experiment, face sensitivity was measured by comparing hemodynamic responses to pictures of faces with those to pictures of houses, objects and natural scenes.
The following three hypotheses were formulated regarding expected properties of audiovisual integration sites for social information:
-
1
A stronger hemodynamic activation during audiovisual stimulation as compared to either unimodal condition.
-
2
A relationship between the individual hemodynamic integration effects [AV − max(A, V)] and SREIT scores.
-
3
A specific sensitivity for human voices and faces.
MATERIALS AND METHODS
Subjects
Twenty‐four volunteers (12 males, 12 females, mean age 26.6, SD 4.7 years) were included in the fMRI study. All the participants were native speakers of the German language and were right‐handed, as assessed with the Edinburgh Inventory [Oldfield, 1971]. None of the participants had a history of neurological or psychiatric illness, substance abuse, or impaired hearing. Vision was normal or corrected to normal. None of the participants was on any medication. The study was performed according to the Code of Ethics of the World Medical Association (Declaration of Helsinki). The protocol for this investigation with human subjects was approved by the local ethics committee. All subjects gave their written informed consent prior to inclusion in the study. All data reported here were acquired in a different group of subjects than the data reported in a previous work by our group [Ethofer et al., 2009] and without overlap between the two groups of subjects.
Stimuli and Experimental Design
Experiment 1—Audiovisual integration
The stimulus material consisted of sixty single words (nouns: 43/60 and adjectives: 17/60; e.g., “Paradies” = paradise, “Möbel” = furniture, “Albtraum” = nightmare) consisting of one to three syllables (mean: 2.1) spoken in either a neutral or one of six emotional intonations (angry, disgusted, erotic, fearful, happy, or sad) with congruent emotional facial expressions. The words were spoken by three female und three male professional actors and recorded in a 1.6‐s video sequence with a resolution of 720 × 576 pixels. All stimuli were presented in three modalities: auditory (A), visual (V), and audiovisual (AV) totaling 180 stimuli per subject. The stimulus material was balanced for the genders of the speakers and approximately balanced for the emotional categories (anger, disgust, eroticism, fear, and neutral 13.3% each, and happiness and sadness 16.7% each). The stimuli were also balanced for the valences of word content [mean: 4.94 ± 2.32 on a Likert scale ranging from 1 to 9; Herbert et al., 2006]. All audio stimuli were normalized with respect to mean acoustic energy using Sound Forge (Sony, Tokyo, Japan). The average duration of the spoken words was 899 ± 306 ms.
In a preliminary study with 30 subjects reported elsewhere [Kreifelts et al., 2007], a significantly increased performance (hit rate) through audiovisual integration during an emotional classification task, estimated as (AV > A) AND (AV > V), was documented using a body of 630 stimuli. A restudy of the behavioral integration effect for the reduced body of 180 stimuli, used in the present study, confirmed this integration effect with mean hit rates of 65% (A), 73% (V), and 82% (AV). A conjunction over two separate paired‐samples T‐tests (AV > A) AND (AV > V) was significant [T(29) ≤ 4.3 and P < 0.001, one‐tailed]. Also, the more conservative approach of testing the minimum difference between the bimodal and either unimodal condition [AV − max(A, V)] against zero across subjects was significant with T(29) = 2.5 and P = 0.009, one‐tailed. Thus, audiovisual integration of social information may be expected during the perception of these stimuli. The classification performance for the single emotional categories in the preliminary study [630 stimuli; Kreifelts et al., 2007] was comparable for the reduced body of 180 stimuli used in the present study: anger: 73% (71%), disgust: 58% (55%), eroticism: 81% (76%), fear: 81% (77%), happiness: 77% (81%), sadness: 67% (65%) and neutral: 77% (76%). Percentages in parentheses pertain to the full body of stimuli. Classification performance for the reduced body of 180 stimuli was above chance level (14%) for each and every emotional category [T(29) ≥ 16.5, P < 0.001, one‐sample T‐test].
Auditory stimuli were presented binaurally via magnetic resonance compatible headphones (Sennheiser, Wedemark, Germany; in‐house modified). Video sequences were back‐projected onto a translucent screen (picture size ∼45 × 30 cm2) placed ∼80 cm from the subject's head in the scanner room. The participants viewed the stimuli via a mirror system mounted on the head coil.
Within the framework of a blocked design, the stimuli were divided into 3 × 12 blocks (A, V, and AV) with five stimuli each and a length of 8 s/block. Stimuli were randomized across blocks under the condition that blocks had to be balanced for the gender of the speaker and the expressed emotion. Stimulus presentation was randomized within single blocks. The sequence of blocks within each modality was likewise randomized. In contrast, the modalities of the stimulus blocks were randomized with the restriction that there could not be more than two adjacent blocks from one modality. The periods of stimulation were interleaved with rest periods of 2 s. Over the complete duration of the experiment, 79 functional brain images were acquired (36 blocks with two images per block = 72 images + 7 discarded images preceding T1 equilibrium).
To ensure constant attention to the stimuli, participants were asked to identify the second “male” stimulus within each block, that is to say, the second stimulus to which the attribute “male” could be assigned, either based on the sound of the voice (A) or the look of the face (V) or a combination of both (AV). Subjects conveyed their decisions by pressing a button on a fiber optic system (LumiTouch, Photon Control, Burnaby, Canada) with their right index finger (Fig. 1a).
Figure 1.
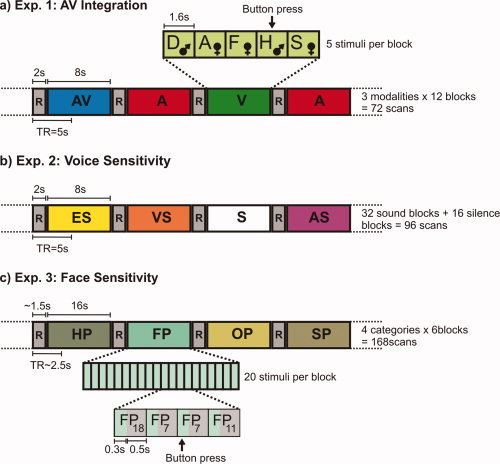
Experimental design. (a) Audiovisual integration experiment. Thirty‐six overall stimulation blocks from three modalities (A, V, and AV) with five stimuli per block were presented in a random order with the restriction that there could not be more than two adjoining blocks from one modality and interleaved with 2 s of rest (R). Stimulus material was randomized across the blocks with the restriction that blocks were balanced for emotional categories. Stimulus presentation within blocks was randomized (D = disgust, A = anger, F = fear, H = happiness, S = sadness; the two remaining emotional categories are not presented within the exemplified block). The task was to press a button when the second “male” (♂) (i.e. male voice, or male face, or both) stimulus within a block was identified. (b) Voice sensitivity experiment. Thirty‐two sound blocks (ES = environmental sounds, VS = vocal sounds, AS = animal sounds) and 16 blocks of silence (S) were presented in randomized order with the restriction that there were no adjoining silence blocks. Blocks were separated by 2‐s periods of rest (R). (c) Face sensitivity experiment. Pictures from four different categories (HP = house pictures, FP = face pictures, OP = object pictures, SP = scene pictures) were presented in 24 blocks. Each block contained 20 pictures, each of which was presented for 300 ms followed by 500 ms of fixation. Stimulus presentation was randomized within blocks. The order of blocks was randomized with the restriction that there could not be adjoining blocks from the same stimulus category. Blocks were separated by ∼1.5 s of rest (R). The task was to press a button whenever a picture was directly repeated (twice per block), exemplified here in the doubling of FP7. [Color figure can be viewed in the online issue, which is available at www.interscience.wiley.com.]
Experiment 2—Voice sensitivity
The stimulus material used in the voice sensitivity experiment was adapted from Belin et al. [ 2000]. Overall, it contained 32 stimulus blocks of 8 s length. Sixteen blocks consisted of human vocal sounds (speech, sighs, laughs, and cries) and sixteen blocks consisted of nonvocal sounds. Of these 16 blocks of nonvocal sounds, eight blocks contained animal sounds (various cries and gallops) and the remaining eight blocks were made up of sounds from the modern human environment (cars, planes, doors, telephones, etc.). Stimulus material was normalized for mean acoustic energy. For a more detailed description of the stimulus material, see Belin et al. [ 2000]. Sound blocks were separated by 2 s of silence. Additionally, there were 16 blocks of silence, each with a length of 8 s (Fig. 1b). Sound blocks were randomized across the experiment. Silence blocks were presented in a randomized fashion as well, but with the restriction of a maximum of two adjacent blocks of silence. Parallel to the experiment of Belin et al. [ 2000], we employed a passive listening paradigm. Subjects were asked to listen attentively to the sound samples with their eyes closed. Overall, 103 functional brain images were recorded for each subject (overall 48 blocks with two images per block = 96 images + 7 discarded images preceding T1 equilibrium).
Experiment 3—Face sensitivity
Pictures from four different categories (faces, houses, objects, and natural scenes) were used within this experiment. Both the selection of stimulus categories and the experimental design were adapted from previous studies on face processing [Epstein et al., 1999; Kanwisher et al., 1997]. Each category and block contained 20 stimuli and lasted for 16s. Stimulation blocks were separated by short ∼1.5 s rest periods. Within blocks, stimuli were presented in a random order for 300 ms and interleaved with 500 ms of fixation [1 block = 20 stimuli × (300 ms picture + 500 ms fixation)] (Fig. 1c). Each stimulus category was repeated six times, giving a total of 24 stimulation blocks with six images per block and 173 functional images overall (including five discarded images preceding T1 equilibrium). Throughout the whole experiment, a small fixation cross was displayed in the center of the screen. To keep their attentions fixed on the stimuli, subjects were engaged in a one‐back matching task, that is, the subjects were instructed to press a button on a fiber optic system (LumiTouch, Photon Control, Burnaby, Canada) with their right index fingers when they saw a picture directly repeated. Repetitions occurred twice per block. Positions of repeated stimulus presentations were randomized within blocks under the condition that one occurred during the first half of the block and one during the second half.
Self‐report emotional intelligence test
Subsequent to the fMRI experiments, all subjects were asked to complete the SREIT [Schutte et al., 1998]. This test was constructed to sample the three central domains of Salovey and Mayer's [ 1990] initial concept of EI (appraisal/expression of emotions, regulation of emotions, and utilization of emotions). All these are also key components of other major EI models [Bar‐On, 1997; Goleman, 1995]. The SREIT represents one of the major scales for trait EI [Chapman and Hayslip, 2005]. In several studies, it has been demonstrated that the SREIT score of subject is related to such measures of the subject's personality as positive mood, alexithymia (negative), openness, extraversion, and agreeableness [Brackett and Mayer, 2003; Saklofske and Minski, 2003; Schutte et al., 1998]. The SREIT score is also related to measures of social functioning [e.g., social skills, cooperation, marital satisfaction; Schutte et al., 2001]. The SREIT questionnaire contains 33 items, three of which are negatively worded. Answers are given on a five‐point Likert scale, which ranges from 1 = “strongly disagree” to 5 = “strongly agree.” This results in scores ranging between 33 and 165. Results are also given in percent of the maximum score of 165. A high SREIT score corresponds to a high degree of trait EI and vice versa.
Analysis of behavioral data
Subsequent to the audiovisual integration experiment, the gender classification hit rates and mean reaction times were calculated for every modality and every subject to assess the subjects' performances. Responses were rejected if they occurred either earlier than 300 ms or later than 2,000 ms after the onset of the target stimulus. To test for differences in performance among the different modalities (A, V, and AV), hit rates and mean reaction times were then submitted to two separate one‐way ANOVAs with modality as the within‐subject factor. All resulting P values were corrected for heterogeneous correlations [Geisser and Greenhouse, 1958]. Significant effects were further investigated using paired‐samples T‐tests. For the face sensitivity experiment, hit rates during the one‐back matching task were calculated to confirm the subject's constant attention to the stimuli. Here again the restriction was imposed that responses were rejected if they did not fall within a window of 300–1,500 ms after the onset of the target stimulus.
Image acquisition
A 3 T whole body scanner (Siemens TRIO; Siemens, Erlangen, Germany) was employed to acquire functional MR images covering the cerebrum [field of view (FOV) = 192 mm × 192 mm, 34 axial slices, 3‐mm slice thickness, and 0.75‐mm gap]. During the audiovisual integration experiment and during the voice sensitivity experiment, the echo‐planar imaging (EPI) sequence had a repetition time (TR) of 5 s with an acquisition time (TA) of 2.49 s. Two scans covered one block of stimulation (8 s) and the preceding rest period (2 s). During the face sensitivity experiment, continuous scanning with a TR of 2.49 s was used. Further parameters were equal for both sequences applied: echo time (TE) = 40 ms, matrix = 642, and flip angle = 90 degrees. For the audiovisual integration experiment and the voice sensitivity experiment, the first seven EPI images were discarded to exclude measurements preceding T1 equilibrium. For the face sensitivity experiment, the first five images were discarded. A static field map (TR = 400 ms, TEs = 5.19, and 7.65 ms) was obtained in every subject for offline correction of distortions of the EPI images. High‐resolution T1‐weighted images were acquired using a magnetization prepared rapid acquisition gradient echo (MPRAGE) sequence (FOV = 256 mm × 256 mm, 176 slices, 1‐mm slice thickness, no gap, flip angle 15 degrees, TR = 2,300 ms, TE = 2.92 ms, and matrix size = 2562).
Image analysis
Functional images were analyzed with SPM5 software (Wellcome Department of Imaging Neuroscience, London, UK; http://www.fil.ion.ucl.ac.uk/spm). The following steps were included in the preprocessing of the images: motion correction, unwarping on the basis of a static field map, slice time correction to the middle slice (17th slice), and coregistration with the anatomical data. All functional images were resliced to a size of 3 × 3 × 3 mm3, normalized to the Montreal Neurological Institute (MNI) space [Collins et al., 1994], and smoothed using a Gaussian filter with 10‐mm full width half maximum (FWHM) before statistical analysis. For the audiovisual integration experiment, three regressors were defined for the different conditions (A, V, and AV) using a box car function convolved with the hemodynamic response function (HRF). Blocks were time‐locked to the stimulus onset. In a similar fashion, three regressors (vocal sounds, animal sounds, and environmental sounds) were defined for the voice sensitivity experiment and four regressors (faces, houses, objects, and scenes) for the face sensitivity experiment. Low‐frequency components were minimized by applying a high‐pass filter with a cut‐off frequency of 1/128 Hz. To account for serial autocorrelations within the data, the error term was modeled as an autoregressive process [Friston et al., 2002].
Following previous studies on the audiovisual integration of nonverbal social signals from voice and face [Dolan et al., 2001; Ethofer et al., 2006a,d; Kreifelts et al., 2007; Pourtois et al., 2005], five a priori anatomical regions of interest (ROI) (bilateral pSTS, right thalamus, left amygdala, and right fusiform gyrus) were defined using the automated anatomic labeling tool integrated in the SPM software [Tzourio‐Mazoyer et al., 2002]. As the STS separates the superior and middle temporal gyri, the ROIs of the pSTS were defined as the posterior third of a combination of these two gyri.
Parallel to a previous study [Kreifelts et al., 2007], brain regions showing stronger responses during audiovisual stimulation (AV) than during either unimodal stimulation were identified via the conjunction analysis (AV > A) AND (AV > V). Statistical evaluation of group data was based on a second‐level random effects analysis. Thresholding of statistical parametric maps relied on a conjunction null‐hypothesis [Nichols et al., 2005]. Activations are reported at a height threshold of P < 0.005, uncorrected and an extent threshold of k > 30 voxels. Population inference relied on a random effects analysis. Corrections for multiple comparisons were performed based on random field theory [Friston et al., 1994] using small volume correction [SVC; Worsley et al., 1996] for the predefined anatomical ROIs. No correction for multiple comparisons across ROIs was applied since an effect was predicted not for any but rather for all of the predefined ROIs. Only activations significant within the a priori defined anatomical ROIs were considered for further analysis. Activations outside the anatomical ROIs are reported for the purpose of completeness.
To assess voice sensitivity and face sensitivity within the audiovisual integration areas, mean parameter estimates of the clusters with a significant audiovisual integration effect were extracted for both the voice sensitivity experiment and the face sensitivity experiment. Voice sensitivity was calculated as VOCAL SOUNDS > (ANIMAL SOUNDS, ENVIRONMENTAL SOUNDS) and face sensitivity was calculated as FACES > (HOUSES, OBJECTS, SCENES). Statistical significance was determined with one‐sided paired T‐tests, Bonferroni‐corrected for the number of ROIs, inasmuch as there were no comparable predictions on the outcome paralleling those from the audiovisual integration experiment.
The individual mean audiovisual integration effect [AV − max(A, V)] of the clusters with a significant audiovisual integration effect and SREIT scores was submitted to a bivariate correlation analysis (Pearson). Statistical thresholds were set to two‐tailed testing. As the ROIs for the correlation analysis were selected on the basis of the conjunction of two contrasts (AV > A and AV > V), which are independent of the SREIT, the present analysis is in accordance with the suggestions to overcome recently discussed caveats concerning circular analyses in fMRI studies [Kriegeskorte et al., 2009]. Parallel to the assessment of voice sensitivity and face sensitivity, results were Bonferroni‐corrected for the number of ROIs.
To ascertain that a possible correlation between the individual audiovisual integration effect [AV − max(A, V)] and SREIT scores is not simply driven by the social salience of nonverbal expressions in voice and/or face, or by human voices and/or faces per se, further correlation analyses were performed in regions with a significant correlation between the audiovisual integration effect and the SREIT scores: Mean parameter estimates for the unimodal conditions (A and V) as well the bimodal condition (AV) and for voice‐sensitivity and face‐sensitivity were extracted from the respective audiovisual integration areas as identified by the conjunction analysis and were correlated with the SREIT scores. Statistical thresholds were adapted to two‐tailed testing. The strengths of these additional correlations were then statistically compared to the strength of the correlation between the audiovisual integration effect and SREIT scores using the approach of Steiger [ 1980]. Statistical thresholds were adapted to one‐tailed testing.
To exclude that the correlation between SREIT scores and the individual audiovisual integration effect [AV − max(A, V)] might be an unspecific effect widely distributed across the a priori defined anatomical ROIs, a voxelwise analysis of this correlation independent of the functionally defined ROIs was performed. Activations are reported at the same thresholds as the conjunction analysis (AV > A and AV > V) with the exception that the results were Bonferroni‐corrected for the number of anatomical ROIs. Additionally, a parallel voxelwise correlation analysis restricted to areas with a significant audiovisual integration effect [(AV > A) AND (AV > V)] was used to investigate with heightened spatial sensitivity potential subregions within the audiovisual integration areas, where the individual audiovisual integration effect correlates with individual SREIT scores thereby cross‐checking the results of the initial correlation analysis, which was based on mean parameter estimates. The height threshold remained P < 0.005, two tailed. Again, reported results are corrected for multiple comparisons across the respective ROI and then Bonferroni‐corrected for the number of functional ROIs.
RESULTS
Behavioral Data
Because of technical failure, behavioral data were lost for two subjects. Results reported pertain to the remaining 22 subjects. Mean hit rates in the gender classification task (±standard error of the mean, SEM) were 0.917 ± 0.018 (A), 0.936 ± 0.014 (V), and 0.943 ± 0.015 (AV). The respective mean reaction times were 1,230 ± 30 ms (A), 719 ± 37 ms (V), and 743 ± 42 ms (AV). In two separate one‐way ANOVAs with modality (A, V, and AV) as the within‐subject factor, there was no evidence of significant differences in the hit rate [F(1.8,38) = 1.1, P > 0.05]. The second ANOVA, however, indicated significant differences in reaction times across modalities [F(1.5,32) = 270.7, P < 0.001]. Post‐hoc T‐tests showed that these differences were due to significantly faster reactions to visual and audiovisual stimuli than to auditory stimuli. There were, on the other hand, no significant differences in reaction times with respect to the visual and audiovisual stimuli [A vs. V: T(21) = 18.4, P < 0.001; A vs. AV: T(21) = 17.2, P < 0.001; V vs. AV: T(21) = −1.4, P > 0.05]. During the face sensitivity experiment, the mean hit rate for the detection of stimulus repetitions was 0.903 ± 0.016. SREIT scores among the participants ranged from 106 (64%) to 141 (85%) with a mean of 124.2 (75.3%) and a standard deviation of 9.5 (5.8%).
fMRI Analysis
A network of brain regions with stronger activation during audiovisual stimulation than during either unimodal condition (A and V) was revealed bilaterally within the pSTS, as well as in the right thalamus—extending into the midbrain (superior colliculi) and the left thalamus, in the bilateral fusiform gyrus, the left hippocampus/amygdala, the right amygdala, and the right precentral gyrus—extending into middle and inferior frontal gyrus (Table I, Fig. 2). Small volume corrections for the regions of interest (bilateral pSTS, right thalamus, right fusiform gyrus, and left amygdala) revealed that activations were significant (P < 0.05) within all five regions of interest. Investigation of voice sensitivity and face sensitivity within the regions of interest yielded significant results for voice sensitivity exclusively within the right pSTS, whereas face sensitivity was significant within the bilateral pSTS, the right fusiform gyrus, and the left hippocampus/amygdala (Table II, Fig. 2). The right pSTS proved to be the only region of interest with a significant correlation between the individual BOLD integration effect, estimated as AV − max(A, V), and trait EI as measured with the SREIT (Table II, Fig. 2). Moreover, none of the correlations between the SREIT scores and individual contrast estimates for either the unimodal conditions (A and V), the bimodal condition, voice sensitivity or the face sensitivity were significant (P ≥ 0.39) in the audiovisual integration area within the right pSTS. Also, the correlation between the audiovisual integration effect and the SREIT scores within this region was stronger than any of the other correlations (Z ≥ 2.19, P ≤ 0.01, one‐tailed). Two additional voxelwise correlation analyses between the individual audiovisual integration effect and SREIT scores corroborated the results of the initial correlation analysis: The first one performed within the a priori anatomical ROIs evidenced a single significant cluster in the right pSTS (Fig. 3; k = 107 voxels, Z = 3.75, MNI coordinates: 60x, −57y, 12z; P ≤ 0.05, two‐tailed, corrected), while a smaller cluster in the left pSTS (k = 38 voxels, Z = 3.29, MNI coordinates: −42x, −51y, 6z) does not survive correction for multiple comparisons across the ROIs indicating that the observed correlation is a highly specific phenomenon. Also the second additional correlation analysis restricted to the functional ROIs with a significant audiovisual integration effect resulted in a single significant cluster in the posterior part of the audiovisual integration region in the right pSTS (k = 27 voxels, Z = 3.66, MNI coordinates: 57x, −54y, 9z; P ≤ 0.05, two‐tailed, corrected). A smaller cluster in the audiovisual integration area in the left pSTS (k = 3 voxels, Z = 2.99, MNI coordinates: −45x, −51y, 6z) is not significant.
Table 1.
Increase of activation during audiovisual integration
| Anatomical definition | MNI coordinates | Z score | Cluster size |
|---|---|---|---|
| Right precentral gyrus | 54, 0, 45 | 4.86 | 161 |
| Right thalamus | 15, −27, −3 | 4.68 | 150* |
| Left hippocampus/amygdala | −24, −9, −21 | 3.92 | 54* |
| Right posterior middle temporal gyrus | 48, −48, 6 | 3.79 | 81* |
| Right fusiform gyrus | 45, −60, −18 | 3.76 | 141* |
| Left fusiform gyrus | −27, −60, −21 | 3.59 | 116 |
| Right amygdala | 24, −6, −12 | 3.52 | 36 |
| Left posterior middle temporal gyrus | −54, −57, 6 | 3.15 | 38* |
P < 0.05, corrected for multiple comparisons across the anatomical ROIs (for the definition of ROIs see Materials and Methods). Voxel size: 27 mm3.
Results of the conjunction analysis of activation during audiovisual stimulation as compared to auditory and visual stimulation: (AV > A) ∩ (AV > V); P < 0.005, uncorrected; cluster size k > 30.
Figure 2.
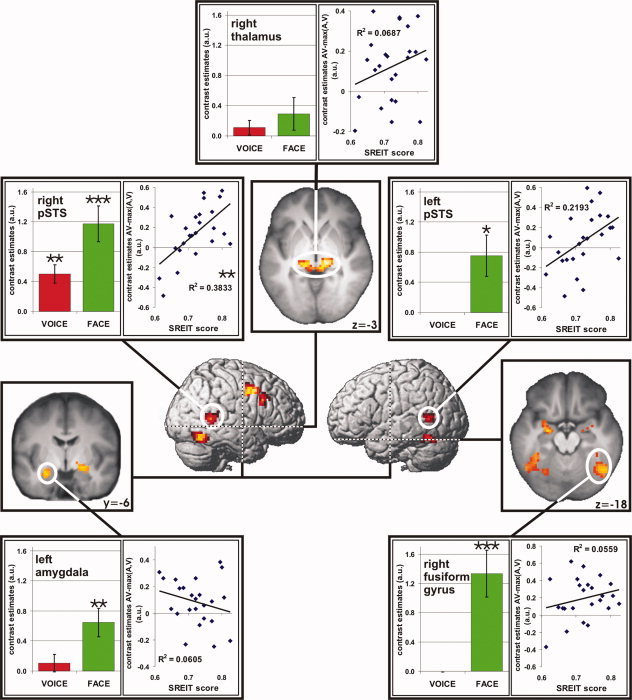
Increased activation during audiovisual stimulation as compared to either auditory or visual stimulation (AV > A) AND (AV > V) (P < 0.005, uncorrected, cluster size k > 30, voxel size: 27 mm3). White circles mark regions of interest within bilateral pSTS, right thalamus, right fusiform gyrus, and left amygdala. Activations, small volume corrected for these ROIs, are significant at P < 0.05, corrected for multiple comparisons across the anatomical ROI. Vertical‐bar diagrams depict the voice sensitivity (red) and face sensitivity (green) within the respective audiovisual integration areas as identified by the conjunction analysis. Results of the correlation analysis between individual BOLD integration effect, estimated as AV − max(A, V), and trait EI (SREIT scores) are given as scatter plots with regression line. Significant results are marked with asterisks (*P < 0.05; **P < 0.01, ***P < 0.001). Error bars show standard error of the mean. [Color figure can be viewed in the online issue, which is available at www.interscience.wiley.com.]
Table 2.
Differential display of voice sensitivity, face sensitivity, and correlation between individual audiovisual BOLD signal gain [AV − max(A, V)] and trait EI within the audiovisual integration areas
| Anatomical definition | Voice sensitivity | Face sensitivity | Correlation with SREIT score | ||||
|---|---|---|---|---|---|---|---|
| T value (df = 23) | P value | T value (df = 23) | P value | Correlation coefficient | T value (df = 22) | P value | |
| Right thalamus | 1.1 | 0.67 | 1.4 | 0.46 | 0.26 | 1.3 | 1 |
| Left Hippocampus/Amygdala | 0.9 | 0.96 | 3.4 | 0.006 | −0.25 | −1.2 | 1 |
| Right posterior middle temporal gyrus | 4.1 | 0.001 | 4.9 | <0.001 | 0.62 | 3.7 | 0.006 |
| Right fusiform gyrus | −1.1 | 1 | 4.2 | <0.001 | 0.24 | 1.1 | 1 |
| Left posterior middle temporal gyrus | −0.1 | 1 | 2.7 | 0.03 | 0.47 | 2.5 | 0.1 |
P values one‐tailed for voice sensitivity and face sensitivity and two‐tailed for the correlation analysis. All P values Bonferroni‐corrected for the number ROIs.
Figure 3.
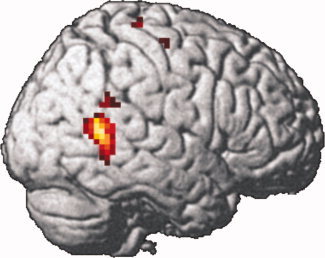
Additional voxelwise analysis: Positive correlation between the individual audiovisual integration effect [AV − max(A, V)] and trait EI (SREIT scores). Height threshold at P < 0.005, uncorrected, cluster size k > 30, voxel size: 27 mm3. The cluster within the right pSTS is significant at P ≤ 0.05, two‐tailed, corrected for multiple comparisons across the anatomical ROI and Bonferroni‐corrected for the number of anatomical ROIs. [Color figure can be viewed in the online issue, which is available at www.interscience.wiley.com.]
DISCUSSION
In the present study, we were able to demonstrate significant audiovisual integration effects within all five regions of interest that had been derived from previous studies on the audiovisual integration of nonverbal social signals from voice and face (bilateral pSTS, right thalamus, right fusiform gyrus, and left amygdala). Thus, the present study not only replicated the results of a previous study that demonstrated audiovisual integration effects bilaterally in the pSTS and in the right thalamus during explicit processing of nonverbal social signals [with comparable audiovisual stimulation: Kreifelts et al., 2007] but also yielded evidence for significant audiovisual integration effects in two additional brain regions with known sensitivity for social signals carried in emotional expressions [amygdala: e.g., Adolphs, 2002; LeDoux, 1996; fusiform gyrus: e.g., Lang et al., 1998; Vuilleumier and Pourtois, 2007].
A significant positive correlation between trait EI (SREIT) and the individual BOLD integration effect was found only in the right pSTS, where this relationship was strongest in the posterior part of the audiovisual integration area. In the left pSTS, this correlation remained a trend without reaching the level of statistical significance.
This link between the individual trait rating of EI and neural correlates of audiovisual integration is the most important finding of the present study. Specifically, within the right pSTS, the individual BOLD integration effect significantly predicted the outcome of the SREIT; greater integration effects predicted higher trait EI. Conclusions from this finding should be discussed very cautiously, however, because it does not per se imply a specific causal relation.
The observed association between activation of an area contributing to audiovisual integration of social information and trait EI might indicate that a strong responsiveness of this region to audiovisual social signals may be a prerequisite for the development of a high trait EI. This appears plausible insofar as the successful integration of multimodal social signals into an adequate social percept is basic to the EI concept underlying the SREIT. On the other hand, development of trait EI might be driven by numerous other factors throughout the process of socialization and individuation. The experience of increasing success in social interaction might in turn enhance the tendency to automatically integrate social information from face and voice independent of a volitional switch of attention to communicational signals. The observed cerebral activation pattern, thus, might be a consequence as well as the cause of increasing social skills. The strength of the observed correlation, however, highlights the importance of the assessment of interindividual differences in traits and personality when carrying out research in the realm of social interaction.
Moreover, the association between the neural correlates of audiovisual integration during the perception of nonverbal social signals from voice and face and trait EI in the right pSTS demonstrated in the present study fits well in the mainstream of other neuroimaging literature, not only on the processing of socially significant eye, body, and hand movements [e.g., Grèzes et al., 1998; Lotze et al., 2006; Puce et al., 1998; for a review, see Allison et al., 2000] but also on the representation of higher social cognitive functions such as the perception of intentionality [Pelphrey et al., 2004] or mentalizing/theory of mind [e.g., Gobbini et al., 2007; Singer et al., 2004; Spiers and Maguire, 2006] in the pSTS. These social functions also have been shown to be associated with rightward lateralized neural activity in the pSTS.
The lack of a significant correlation between the SREIT scores and individual contrast estimates for both unimodal conditions, the bimodal condition, voice sensitivity, and face sensitivity also underpins the notion that the observed correlation between the individual audiovisual integration effect and trait EI in the audiovisual integration area within the right pSTS is not simply driven by the social salience of nonverbal emotional expressions in voice and/or face, or the social salience of human voices and/or faces per se but is specifically linked to the audiovisual integration of social signals from voice and face. This idea is further supported by the fact that the correlation between the SREIT scores and the audiovisual integration effect is significantly stronger than any of the other correlations that were computed.
It must, however, be stated as a caveat that the current study did not investigate the integration of nonsocial information [for example tools, as demonstrated in Beauchamp et al. [ 2004]]; this militates against any definite conclusions about the specificity of the observed correlation. On the other hand, it seems unlikely that such a strong association between the BOLD integration effect and such a complex concept as trait EI seen here would reflect merely unspecific features of audiovisual integration.
A further piece of evidence, which supports the idea that one of the major elements in the neural network for the integration of social communicative signals is housed within the right pSTS, is the coincidence of a significant sensitivity to voices as well as to faces in this region. This combined sensitivity to two of the most important sources of human social communication, which sets the right pSTS apart from all other putative integration sites studied, might be conceived as an essential characteristic of the neural structures subserving the audiovisual integration of human social communicative signals. It needs to be stated, however, that given the differences in control stimuli in the voice sensitivity and the face sensitivity experiment (voice sensitivity: animal and environmental sound; face sensitivity: houses, objects, and natural scenes), we refrain from any direct comparisons between these two qualities. While the voice sensitivity experiment contained animal voices, no animal faces were used in the face sensitivity experiment. Therefore, it might be argued that voice sensitivity was more tightly controlled than face sensitivity, which might result in a lower degree of observed voice sensitivity especially in the STS.
Given the lack of a significant relationship of trait EI with neural activity in any of the other putative integration areas (left amygdala, right fusiform gyrus, and right thalamus), it is difficult to say what roles, if any, these areas might play in the integration process. Other factors, such as emotional salience, which might influence perceptual integration in, for example, the amygdala, have not been explicitly investigated in the present study. We thus refrain from speculating on the potential role of the audiovisual integration effects in these regions.
Nevertheless, the pronounced face sensitivity of the putative “integration site” located in the fusiform gyrus demonstrated in the present study indicates that this “integration area” at least partly overlaps with the so‐called fusiform face area [Kanwisher et al., 1997]. While considering activations in the left amygdala and the right fusiform gyrus as regions of interest, it is worthwhile to note that the left fusiform gyrus and the right amygdala also exhibited somewhat weaker BOLD integration effects in the audiovisual integration experiment. The authors of previous studies on the audiovisual integration of nonverbal social signals [Dolan et al., 2001; Ethofer et al., 2006a] speculated that crossmodal integration effects within the fusiform gyrus could be the neuroimaging correlate of heightened attention to faces driven by the amygdala. This theoretical consideration is further supported by psychophysiological interaction analyses [Ethofer et al., 2006b; Morris et al., 1998] that showed enhanced effective connectivity between the amygdala and the fusiform gyrus during the perceptual integration of fearful expressions. A possible explanation for the occurrence of bilateral activations in the amygdala and the fusiform gyrus seen in the present study could be that dynamic visual stimulation produces stronger amygdala activation than static visual stimulation [Sato et al., 2004]. Possibly, this stronger and more natural visual stimulation enhances the audiovisual integration effect, which then can be more easily detected. Also, judging from the behavioral data of the gender classification task (hit rate: A ≈ V ≈ AV; reaction times: A > V ≈ AV), it seems improbable that the significant results of the conjunction (AV > A) AND (AV > V) should have occurred solely due to the influence of task difficulty on amygdala activation [Hsu and Pessoa, 2007].
As are the cases with the activations in the amygdala and the fusiform gyrus, the role of the thalamus in the implicit integration of social signals from voice and face cannot be inferred from the data collected in the present study: the BOLD integration effect in this region does not bear any relationship to voice sensitivity, face sensitivity, or trait EI. Anatomical as well as electrophysiological studies [Komura et al., 2005; Linke et al., 1999; Mufson and Mesulam, 1984; Yeterian and Pandya, 1989] indicate that the thalamus possesses both the anatomical connections and the physiological properties necessary to act as an integrative relay station in the network for multimodal social perception. In one previous study, a relationship was observed between the behavioral integration effect and the BOLD integration effect during explicit emotional perception [Kreifelts et al., 2007].
Finally, it should be considered that the process of perceptual audiovisual integration as investigated in the present study is coupled to an increased perceptual load during bimodal stimulation. With regard to future research, it seems worthwhile to employ experimental designs controlling for perceptual load to investigate audiovisual integration independently from this aspect of the integration process. One way to control perceptual load is to employ a congruence design in which a condition with emotionally congruent bimodal stimulation (i.e., matching emotional speech melody and emotional facial expressions) is compared to emotionally incongruent bimodal cues. Another experimental approach would be to replace the unimodal conditions as used in the present study by bimodal conditions in which either auditory or visual cues are “scrambled” using filters removing nonverbal emotional information while conserving the perceptual complexity of the auditory/visual cue thus resulting in three experimental conditions with comparable perceptual load (i.e. AV, AscrambledV, and AVscrambled). One has to bear in mind, however, that these artificial incongruent or “scrambled” conditions might themselves trigger confounding crossmodal interaction processes.
In conclusion, we have presented evidence that a distributed network of brain regions including the bilateral pSTS, the right thalamus, the right fusiform gyrus, and the left amygdala displays significant audiovisual integration effects during the perception of social signals from voice and face. Within the right pSTS, a significant positive correlation could be established between the BOLD integration effect and a trait marker of EI (SREIT). This observation can be taken as evidence that the neuroimaging correlate of audiovisual integration in this region indeed reflects processing of social information, again highlighting the significance of interindividual trait differences for the field of research on social communication. BOLD effects associated with the audiovisual integration of social communication signals in the amygdala and in the fusiform gyrus exhibited no relationship with trait EI. Furthermore, neither of these two regions showed a combination of voice and face sensitivity. Thus, BOLD integration effects in these regions may reflect other levels of integrational processing not assessable in the framework of the present study.
Finally, the right pSTS was the only region, which exhibited a significant sensitivity to both voices and faces; this further supports the notion that this region plays a unique and pivotal role in the processing of human social communication signals.
Acknowledgements
We are indebted to Dr. Anja Bialkowski for invaluable help during the acquisition of fMRI data and to Dr. Frank Rodden for sharing his thoughts on the manuscript. This study was supported by the Deutsche Forschungsgemeinschaft (DFG) Sonderforschungsbereich (SFB) 550 B10 and the Werner Reichardt Centre for Integrative Neuroscience.
REFERENCES
- Adolphs R ( 2002): Neural systems for recognizing emotion. Curr Opin Neurobiol 12: 169–177. [DOI] [PubMed] [Google Scholar]
- Allison T, Puce A, McCarthy G ( 2000): Social perception from visual cues: Role of the STS region. Trends Cogn Sci 4: 267–278. [DOI] [PubMed] [Google Scholar]
- Bar‐On R ( 1997): The Emotional Quotient Inventory Technichal Manual. Toronto: Multihealth Systems. [Google Scholar]
- Beauchamp MS, Lee KE, Argall BD, Martin A ( 2004): Integration of auditory and visual information about objects in superior temporal sulcus. Neuron 41: 809–823. [DOI] [PubMed] [Google Scholar]
- Belin P, Zatorre RJ, Lafaille P, Ahad P, Pike B ( 2000): Voice‐selective areas in human auditory cortex. Nature 403: 309–312. [DOI] [PubMed] [Google Scholar]
- Belizaire G, Fillion‐Bilodeau S, Chartrand JP, Bertrand‐Gauvin C, Belin P ( 2007): Cerebral response to ‘voiceness’: a functional magnetic resonance imaging study. Neuroreport 18: 29–33. [DOI] [PubMed] [Google Scholar]
- Blair RJ, Morris JS, Frith CD, Perrett DI, Dolan RJ ( 1999): Dissociable neural responses to facial expressions of sadness and anger. Brain 122 ( Pt 5): 883–893. [DOI] [PubMed] [Google Scholar]
- Brackett MA, Mayer JD ( 2003): Convergent, discriminant, and incremental validity of competing measures of emotional intelligence. Pers Soc Psychol Bull 29: 1147–1158. [DOI] [PubMed] [Google Scholar]
- Breiter HC, Etcoff NL, Whalen PJ, Kennedy WA, Rauch SL, Buckner RL, Strauss MM, Hyman SE, Rosen BR ( 1996): Response and habituation of the human amygdala during visual processing of facial expression. Neuron 17: 875–887. [DOI] [PubMed] [Google Scholar]
- Buchanan TW, Lutz K, Mirzazade S, Specht K, Shah NJ, Zilles K, Jancke L ( 2000): Recognition of emotional prosody and verbal components of spoken language: an fMRI study. Brain Res Cogn Brain Res 9: 227–238. [DOI] [PubMed] [Google Scholar]
- Chapman BP, Hayslip B Jr ( 2005): Incremental validity of a measure of emotional intelligence. J Pers Assess 85: 154–169. [DOI] [PubMed] [Google Scholar]
- Collins DL, Neelin P, Peters TM, Evans AC ( 1994): Automatic 3D intersubject registration of MR volumetric data in standardized Talairach space. J Comput Assist Tomogr 18: 192–205. [PubMed] [Google Scholar]
- Couture SM, Penn DL, Roberts DL ( 2006): The functional significance of social cognition in schizophrenia: A review. Schizophr Bull 32 Suppl 1: S44–S63. [DOI] [PMC free article] [PubMed] [Google Scholar]
- De Gelder B, Vroomen J ( 2000): The perception of emotions by ear and by eye. Cogn Emot 14: 289–311. [Google Scholar]
- Dietrich S, Hertrich I, Alter K, Ischebeck A, Ackermann H ( 2008): Understanding the emotional expression of verbal interjections: A functional MRI study. Neuroreport 19: 1751–1755. [DOI] [PubMed] [Google Scholar]
- Dolan RJ, Morris JS, de Gelder B ( 2001): Crossmodal binding of fear in voice and face. Proc Natl Acad Sci USA 98: 10006–10010. [DOI] [PMC free article] [PubMed] [Google Scholar]
- Eack SM, Hogarty GE, Greenwald DP, Hogarty SS, Keshavan MS ( 2007): Cognitive enhancement therapy improves emotional intelligence in early course schizophrenia: Preliminary effects. Schizophr Res 89( 1–3): 308–311. [DOI] [PMC free article] [PubMed] [Google Scholar]
- Epstein R, Harris A, Stanley D, Kanwisher N ( 1999): The parahippocampal place area: Recognition, navigation, or encoding? Neuron 23: 115–125. [DOI] [PubMed] [Google Scholar]
- Ethofer T, Anders S, Erb M, Droll C, Royen L, Saur R, Reiterer S, Grodd W, Wildgruber D ( 2006a): Impact of voice on emotional judgment of faces: An event‐related fMRI study. Hum Brain Mapp 27: 707–714. [DOI] [PMC free article] [PubMed] [Google Scholar]
- Ethofer T, Anders S, Erb M, Herbert C, Wiethoff S, Kissler J, Grodd W, Wildgruber D ( 2006b): Cerebral pathways in processing of affective prosody: a dynamic causal modeling study. Neuroimage 30: 580–587. [DOI] [PubMed] [Google Scholar]
- Ethofer T, Anders S, Wiethoff S, Erb M, Herbert C, Saur R, Grodd W, Wildgruber D ( 2006c): Effects of prosodic emotional intensity on activation of associative auditory cortex. Neuroreport 17: 249–253. [DOI] [PubMed] [Google Scholar]
- Ethofer T, Pourtois G, Wildgruber D ( 2006d): Investigating audiovisual integration of emotional signals in the human brain. Prog Brain Res 156: 345–361. [DOI] [PubMed] [Google Scholar]
- Ethofer T, Kreifelts B, Wiethoff S, Wolf J, Grodd W, Vuilleumier P, Wildgruber D ( 2009): Differential influences of emotion, task, and novelty on brain regions underlying the processing of speech melody. J Cogn Neurosci 21: 1255–1268. [DOI] [PubMed] [Google Scholar]
- Fecteau S, Armony JL, Joanette Y, Belin P ( 2004): Is voice processing species‐specific in human auditory cortex? An fMRI study. Neuroimage 23: 840–848. [DOI] [PubMed] [Google Scholar]
- Friston KJ, Worsley KJ, Frackowiak RSJ, Mazziotta JC, Evans AC ( 1994): Assessing the significance of focal activations using their spatial extent. Hum Brain Mapp 1: 210–220. [DOI] [PubMed] [Google Scholar]
- Friston KJ, Glaser DE, Henson RN, Kiebel S, Phillips C, Ashburner J ( 2002): Classical and Bayesian inference in neuroimaging: Applications. Neuroimage 16: 484–512. [DOI] [PubMed] [Google Scholar]
- Geisser S, Greenhouse SW ( 1958): An extension of Box's results on the use of the F‐distribution in multivariate analysis. Ann Math Stat 29: 885–891. [Google Scholar]
- George MS, Parekh PI, Rosinsky N, Ketter TA, Kimbrell TA, Heilman KM, Herscovitch P, Post RM ( 1996): Understanding emotional prosody activates right hemisphere regions. Arch Neurol 53: 665–670. [DOI] [PubMed] [Google Scholar]
- Giraud AL, Kell C, Thierfelder C, Sterzer P, Russ MO, Preibisch C, Kleinschmidt A ( 2004): Contributions of sensory input, auditory search and verbal comprehension to cortical activity during speech processing. Cereb Cortex 14: 247–255. [DOI] [PubMed] [Google Scholar]
- Gobbini MI, Koralek AC, Bryan RE, Montgomery KJ, Haxby JV ( 2007): Two takes on the social brain: A comparison of theory of mind tasks. J Cogn Neurosci 19: 1803–1814. [DOI] [PubMed] [Google Scholar]
- Goleman D, editor ( 1995). Emotional Intelligence. New York: Bantam. [Google Scholar]
- Grèzes J, Costes N, Decety J ( 1998): Top down effect of strategy on the perception of human biological motion: A pet investigation. Cogn Neuropsychol 15( 6–8): 553–582. [DOI] [PubMed] [Google Scholar]
- Hamann S, Canli T ( 2004): Individual differences in emotion processing. Curr Opin Neurobiol 14: 233–238. [DOI] [PubMed] [Google Scholar]
- Haxby JV, Horwitz B, Ungerleider LG, Maisog JM, Pietrini P, Grady CL ( 1994): The functional organization of human extrastriate cortex: a PET‐rCBF study of selective attention to faces and locations. J Neurosci 14: 6336–6353. [DOI] [PMC free article] [PubMed] [Google Scholar]
- Herbert C, Kissler J, Junghofer M, Peyk P, Rockstroh B ( 2006): Processing of emotional adjectives: Evidence from startle EMG and ERPs. Psychophysiology 43: 197–206. [DOI] [PubMed] [Google Scholar]
- Hsu SM, Pessoa L ( 2007): Dissociable effects of bottom–up and top–down factors on the processing of unattended fearful faces. Neuropsychologia 45: 3075–3086. [DOI] [PMC free article] [PubMed] [Google Scholar]
- Imaizumi S, Mori K, Kiritani S, Kawashima R, Sugiura M, Fukuda H, Itoh K, Kato T, Nakamura A, Hatano K, Kojima S, Nakamura K ( 1997): Vocal identification of speaker and emotion activates different brain regions. Neuroreport 8: 2809–2812. [DOI] [PubMed] [Google Scholar]
- Kanwisher N, McDermott J, Chun MM ( 1997): The fusiform face area: A module in human extrastriate cortex specialized for face perception. J Neurosci 17: 4302–4311. [DOI] [PMC free article] [PubMed] [Google Scholar]
- Kohler CG, Martin EA ( 2006): Emotional processing in schizophrenia. Cogn Neuropsychiatry 11: 250–271. [DOI] [PubMed] [Google Scholar]
- Komura Y, Tamura R, Uwano T, Nishijo H, Ono T ( 2005): Auditory thalamus integrates visual inputs into behavioral gains. Nat Neurosci 8: 1203–1209. [DOI] [PubMed] [Google Scholar]
- Kotz SA, Meyer M, Alter K, Besson M, von Cramon DY, Friederici AD ( 2003): On the lateralization of emotional prosody: an event‐related functional MR investigation. Brain Lang 86: 366–376. [DOI] [PubMed] [Google Scholar]
- Kreifelts B, Ethofer T, Grodd W, Erb M, Wildgruber D ( 2007): Audiovisual integration of emotional signals in voice and face: An event‐related fMRI study. Neuroimage 37: 1445–1456. [DOI] [PubMed] [Google Scholar]
- Kriegeskorte N, Simmons WK, Bellgowan PS, Baker CI ( 2009): Circular analysis in systems neuroscience: The dangers of double dipping. Nat Neurosci 12: 535–540. [DOI] [PMC free article] [PubMed] [Google Scholar]
- Kriegstein KV, Giraud AL ( 2004): Distinct functional substrates along the right superior temporal sulcus for the processing of voices. Neuroimage 22: 948–955. [DOI] [PubMed] [Google Scholar]
- Lang PJ, Bradley MM, Fitzsimmons JR, Cuthbert BN, Scott JD, Moulder B, Nangia V ( 1998): Emotional arousal and activation of the visual cortex: an fMRI analysis. Psychophysiology 35: 199–210. [PubMed] [Google Scholar]
- LeDoux J. 1996. The Emotional Brain: The Mysterious Underpinnings of Emotional Life. New York: Simon and Schuster. [Google Scholar]
- Linke R, De Lima AD, Schwegler H, Pape HC ( 1999): Direct synaptic connections of axons from superior colliculus with identified thalamo‐amygdaloid projection neurons in the rat: Possible substrates of a subcortical visual pathway to the amygdala. J Comp Neurol 403: 158–170. [PubMed] [Google Scholar]
- Lotze M, Heymans U, Birbaumer N, Veit R, Erb M, Flor H, Halsband U ( 2006): Differential cerebral activation during observation of expressive gestures and motor acts. Neuropsychologia 44: 1787–1795. [DOI] [PubMed] [Google Scholar]
- Mitchell RL, Elliott R, Barry M, Cruttenden A, Woodruff PW ( 2003): The neural response to emotional prosody, as revealed by functional magnetic resonance imaging. Neuropsychologia 41: 1410–1421. [DOI] [PubMed] [Google Scholar]
- Mogg K, Bradley BP ( 1999): Some methodological issues in assessing attentional biases for threatening faces in anxiety: A replication study using a modified version of the probe detection task. Behav Res Ther 37: 595–604. [DOI] [PubMed] [Google Scholar]
- Morris JS, Frith CD, Perrett DI, Rowland D, Young AW, Calder AJ, Dolan RJ ( 1996): A differential neural response in the human amygdala to fearful and happy facial expressions. Nature 383: 812–815. [DOI] [PubMed] [Google Scholar]
- Morris JS, Friston KJ, Buchel C, Frith CD, Young AW, Calder AJ, Dolan RJ ( 1998): A neuromodulatory role for the human amygdala in processing emotional facial expressions. Brain 121 ( Pt 1): 47–57. [DOI] [PubMed] [Google Scholar]
- Mufson EJ, Mesulam MM ( 1984): Thalamic connections of the insula in the rhesus monkey and comments on the paralimbic connectivity of the medial pulvinar nucleus. J Comp Neurol 227: 109–120. [DOI] [PubMed] [Google Scholar]
- Nichols T, Brett M, Andersson J, Wager T, Poline JB ( 2005): Valid conjunction inference with the minimum statistic. Neuroimage 25: 653–660. [DOI] [PubMed] [Google Scholar]
- Oldfield RC ( 1971): The assessment and analysis of handedness: The Edinburgh inventory. Neuropsychologia 9: 97–113. [DOI] [PubMed] [Google Scholar]
- Pelphrey KA, Morris JP, McCarthy G ( 2004): Grasping the intentions of others: The perceived intentionality of an action influences activity in the superior temporal sulcus during social perception. J Cogn Neurosci 16: 1706–1716. [DOI] [PubMed] [Google Scholar]
- Petrides KV, Furnham A ( 2001): Trait emotional intelligence: Psychometric investigation with reference to established trait taxonomies. Eur J Pers 15: 425–448. [Google Scholar]
- Phillips ML, Young AW, Senior C, Brammer M, Andrew C, Calder AJ, Bullmore ET, Perrett DI, Rowland D, Williams SC, Gray JA, David AS ( 1997): A specific neural substrate for perceiving facial expressions of disgust. Nature 389: 495–498. [DOI] [PubMed] [Google Scholar]
- Posamentier MT, Abdi H ( 2003): Processing faces and facial expressions. Neuropsychol Rev 13: 113–143. [DOI] [PubMed] [Google Scholar]
- Pourtois G, de Gelder B, Bol A, Crommelinck M ( 2005): Perception of facial expressions and voices and of their combination in the human brain. Cortex 41: 49–59. [DOI] [PubMed] [Google Scholar]
- Pourtois G, de Gelder B, Vroomen J, Rossion B, Crommelinck M ( 2000): The time‐course of intermodal binding between seeing and hearing affective information. Neuroreport 11: 1329–1333. [DOI] [PubMed] [Google Scholar]
- Pourtois G, Grandjean D, Sander D, Vuilleumier P ( 2004): Electrophysiological correlates of rapid spatial orienting towards fearful faces. Cereb Cortex 14: 619–633. [DOI] [PubMed] [Google Scholar]
- Puce A, Allison T, Bentin S, Gore JC, McCarthy G ( 1998): Temporal cortex activation in humans viewing eye and mouth movements. J Neurosci 18: 2188–2199. [DOI] [PMC free article] [PubMed] [Google Scholar]
- Saklofske A, Minski P ( 2003): Factor structure and validity of a trait emotional intelligence measure. Pers Individ Dif 34: 707–721. [Google Scholar]
- Salovey P, Mayer J ( 1990): Emotional intelligence. Imaging Cogn Pers 9: 185–221. [Google Scholar]
- Sato W, Kochiyama T, Yoshikawa S, Naito E, Matsumura M ( 2004): Enhanced neural activity in response to dynamic facial expressions of emotion: An fMRI study. Brain Res Cogn Brain Res 20: 81–91. [DOI] [PubMed] [Google Scholar]
- Schutte N, Malouff J, Hall L, Haggerty D, Cooper J, Golden C, Dornheim L ( 1998): Development and validation of a measure of emotional intelligence. Pers Individ Dif 25: 167–177. [Google Scholar]
- Schutte NS, Malouff JM, Bobik C, Coston TD, Greeson C, Jedlicka C, Rhodes E, Wendorf G ( 2001): Emotional intelligence and interpersonal relations. J Soc Psychol 141: 523–536. [DOI] [PubMed] [Google Scholar]
- Singer T, Kiebel SJ, Winston JS, Dolan RJ, Frith CD ( 2004): Brain responses to the acquired moral status of faces. Neuron 41: 653–662. [DOI] [PubMed] [Google Scholar]
- Spiers HJ, Maguire EA ( 2006): Spontaneous mentalizing during an interactive real world task: An fMRI study. Neuropsychologia 44: 1674–1682. [DOI] [PubMed] [Google Scholar]
- Steiger JH ( 1980): Tests for comparing elements of a correlation matrix. Psychol Bull 87: 245–251. [Google Scholar]
- Tremeau F ( 2006): A review of emotion deficits in schizophrenia. Dialogues Clin Neurosci 8: 59–70. [DOI] [PMC free article] [PubMed] [Google Scholar]
- Tzourio‐Mazoyer N, Landeau B, Papathanassiou D, Crivello F, Etard O, Delcroix N, Mazoyer B, Joliot M ( 2002): Automated anatomical labeling of activations in SPM using a macroscopic anatomical parcellation of the MNI MRI single‐subject brain. Neuroimage 15: 273–289. [DOI] [PubMed] [Google Scholar]
- van Honk J, Schutter DJ ( 2006): Unmasking feigned sanity: A neurobiological model of emotion processing in primary psychopathy. Cogn Neuropsychiatry 11: 285–306. [DOI] [PubMed] [Google Scholar]
- Vuilleumier P, Pourtois G ( 2007): Distributed and interactive brain mechanisms during emotion face perception: Evidence from functional neuroimaging. Neuropsychologia 45: 174–194. [DOI] [PubMed] [Google Scholar]
- Vroomen J, Driver J, de Gelder B ( 2001): Is cross‐modal integration of emotional expressions independent of attentional resources? Cogn Affect Behav Neurosci 1: 382–387. [DOI] [PubMed] [Google Scholar]
- Warren JE, Sauter DA, Eisner F, Wiland J, Dresner MA, Wise RJ, Rosen S, Scott SK ( 2006): Positive emotions preferentially engage an auditory‐motor “mirror” system. J Neurosci 26: 13067–13075. [DOI] [PMC free article] [PubMed] [Google Scholar]
- Wiethoff S, Wildgruber D, Kreifelts B, Becker H, Herbert C, Grodd W, Ethofer T ( 2008): Cerebral processing of emotional prosody‐influence of acoustic parameters and arousal. Neuroimage 39: 885–893. [DOI] [PubMed] [Google Scholar]
- Wildgruber D, Pihan H, Ackermann H, Erb M, Grodd W ( 2002): Dynamic brain activation during processing of emotional intonation: Influence of acoustic parameters, emotional valence, and sex. Neuroimage 15: 856–869. [DOI] [PubMed] [Google Scholar]
- Wildgruber D, Hertrich I, Riecker A, Erb M, Anders S, Grodd W, Ackermann H ( 2004): Distinct frontal regions subserve evaluation of linguistic and emotional aspects of speech intonation. Cereb Cortex 14: 1384–1389. [DOI] [PubMed] [Google Scholar]
- Wildgruber D, Riecker A, Hertrich I, Erb M, Grodd W, Ethofer T, Ackermann H ( 2005): Identification of emotional intonation evaluated by fMRI. Neuroimage 24: 1233–1241. [DOI] [PubMed] [Google Scholar]
- Wildgruber D, Ackermann H, Kreifelts B, Ethofer T ( 2006): Cerebral processing of linguistic and emotional prosody: fMRI studies. Prog Brain Res 156: 249–268. [DOI] [PubMed] [Google Scholar]
- Worsley K, Marrett S, Neelin P, Vandal AC, Friston KJ, Evans A ( 1996): A unified statistical approach for determining significant signals in images of cerebral activation. Hum Brain Mapp 4: 74–90. [DOI] [PubMed] [Google Scholar]
- Yeterian EH, Pandya DN ( 1989): Thalamic connections of the cortex of the superior temporal sulcus in the rhesus monkey. J Comp Neurol 282: 80–97. [DOI] [PubMed] [Google Scholar]