

Abstract
Magnetic resonance imaging (MRI) studies have highlighted the possibility to investigate brain iron content in vivo. In this study, we combined T2* relaxometry and automatic segmentation of basal ganglia based on T1‐weighted images in healthy subjects, with the aim of characterizing age related changes in volume and iron‐related relaxivity values (R2*) of these structures. Thirty healthy subjects underwent MR imaging at 3 Tesla. Mean R2* values and volumes were calculated for the selected subcortical structures (pallidum, putamen, thalamus and caudate nucleus). Our results showed a correlation between R2* values and iron concentration as calculated from published post‐mortem data. Furthermore, we observed a shrinkage/iron increase with a different pattern in the anatomical regions selected in this work, suggesting that the age‐related changes on these MR parameters are specific to the subcortical structure considered. In particular, the putamen demonstrated a decrease of volume and an increase of iron level, with the posterior region of this structure appearing more disposed to iron deposition. Our work suggests that combining volumetry and iron estimation in MRI permits to investigate in vivo neurophysiological and neuropathological changes of basal ganglia. Hum Brain Mapp 2009. © 2009 Wiley‐Liss, Inc.
Keywords: MRI, iron, volumetry, basal ganglia, putamen, thalamus, striatum
INTRODUCTION
Several studies have investigated the ways in which the healthy brain changes with age. Almost 50 years ago, biochemical analysis of post‐mortem brain tissue was used to demonstrate that iron levels increase with age in different brain regions, principally in striatum and globus pallidus [Fiehring and Sundermann,1959; Hallgren and Sourander,1958]. Dysregulation of iron metabolism and iron accumulation in various parts of the brain are implicated in the pathogenesis of many neurodegenerative diseases (for review see Moos and Morgan [2004]; Zecca et al. [2004]). The presence of iron potentiates reactive oxygen species, and consequently contributes to an increase in the oxidative stress implicated in neuronal loss in neurodegenerative disorders such as Alzheimer's disease [Bush,2003; Jellinger et al.,1990; Morris et al.,1994], Parkinson's disease [Berg et al.,2006; Jenner,2003; Kaur and Andersen,2004; Martin et al.,2008], Huntington's disease [Bartzokis et al.,1999a; Hilditch‐Maguire et al.,2000].
Magnetic Resonance (MR) imaging, T2‐weighted imaging in particular [Bizzi et al.,1990; Drayer et al.,1986], has been used to measure signal reductions due to local field inhomogeneities (additional proton spin dephasing) induced by the presence of iron (for review see Haacke et al. [2005]). In the past, efforts have been made to find a sensitive, reliable method to evaluate iron content in vivo in the brain [Bartzokis et al.,1997; Gelman et al.,1999; Gorell et al.,1995; Graham et al.,2000; Jensen et al.,2006; Ordidge et al.,1994; Peran et al.,2007]. One of the most promising methods, developed during the last decade, is the Field‐Dependent‐Rate‐Increase (FDRI) method introduced by Bartzokis and co‐workers [Bartzokis et al.,1997; Bartzokis et al.,1999a,b,2007,2004; Pfefferbaum et al.,2008]. This method has shown a high degree of sensitivity and good protein specificity (iron bound to ferritin). In spite of these advantages, the FDRI method presents practical limitations such as the need of two MR scanners with different field intensities, and an acquisition time that lasts approximately 1 h.
A characteristic shared by all iron‐related MR studies [Bartzokis et al.,1997; Gelman et al.,1999; Gorell et al.,1995; Graham et al.,2000; Jensen et al.,2006; Ordidge et al.,1994] published so far is represented by the manual definition a priori of regions of interest (ROI) (except for [Peran et al.,2007]). However, in these works the delineation of ROIs was performed on T2 or T2*‐weighted images, whose signal intensities were influenced by the presence of iron species. Moreover, ROIs were defined with cubic shapes, possibly overlooking the measures of MR iron‐related levels for the entire anatomical structure.
In this study, we intend to overcome these limitations by performing an in vivo estimation of iron content and a volumetric study in young healthy subjects. We choose to concentrate our analysis on basal ganglia since previous studies have shown that age‐related increase of iron content [Bartzokis et al.,2007; Martin et al.,1998; Ogg et al.,1999], pathological iron deposition in Parkinson's disease [Bartzokis et al.,1999b; Graham et al.,2000; Michaeli et al.,2007; Pujol et al.,1992] and in Huntington's disease [Bartzokis et al.,1999a] are more prominent in these structures. In order to precisely identify the structures of interest we employed a fully automated model‐based segmentation algorithm on MRI anatomical images, and accurate coregistration of T2* images to high resolution T1 anatomical images to extract volumes and regional values of iron‐related relaxivity values in these specific areas.
MATERIALS AND METHODS
Subjects and Apparatus
Thirty healthy subjects, 16 men and 14 women, aged 20–41 years (mean = 29.3, SD = 5.7), provided informed written consent to participate in this study, which was approved by the local ethics committee. None of the subjects had a history of head injury or stroke, nor of any neurological or psychiatric diseases. These volunteers were examined using a 3T‐head only scanner (Siemens Medical Solutions, Erlangen, Germany).
Measurement Protocol
All participants underwent the same imaging protocol with a whole‐brain T1‐weighted and T2*‐weighted scanning. Whole‐brain T1‐weighted images were obtained in the sagittal plane using a modified driven equilibrium Fourier transform (MDEFT) sequence (TE/TR = 2.4/7.92 ms, flip angle 15°, voxel‐size 1 × 1 × 1 mm3). The parameters chosen for the T2*‐weighted measurements were inspired by a previous work which have demonstrated good reproducibility and sensibility [Peran et al.,2007]. Six consecutive T2*‐weighted gradient‐echo whole‐brain volumes were acquired using a segmented echo‐planar imaging sequence at different TEs: 6‐12‐20‐30‐45‐60 ms (major details of acquisition and typical examples of image quality can be found in a previous work by Péran et al. [2007]. The other measurement parameters were: the number of segments = 11; EPI echo‐spacings = 1.04 ms; repetition time (TR) = 5000 ms; field‐of‐view (FOV) = 192 mm; matrix size = 128 × 128; in‐plane voxel size = 1.8 × 1.8 mm, 80 slices, thickness = 1.8 mm, acquisition time of 15 min.
Image Analysis
Data were analyzed using the FMRIB Software Library (FSL) 4.0 (http://www.fmrib.ox.ac.uk/fsl/) and locally written MATLAB (version 6.5, The Mathworks Inc) scripts. In order to minimize the effects of head movements during acquisition, the six T2*‐weighted were corrected applying a full affine (mutual information cost function) alignment of each image to the mean image (average of the 6 T2*‐weighted images). For each subject, we performed a voxel‐by‐voxel non‐linear least‐squares fitting of the data acquired at the six TEs to obtain a mono‐exponential signal decay curve (i.e. S(t) = S 0e−t/T2* where t = echo time, S = measured data, S 0 = multiplicative constant, T2* = effective transverse relaxation time). The T2* (and R2* = 1/T2*) values were thus calculated for each voxel. The mean image was then registered to brain‐extracted T1‐weighted volume using a full affine (normalized mutual information cost function). Thus both T1 weighted and R2* images were in the individual spatial reference.
The anatomical T1‐weighted images were processed with the segmentation tool FIRST 1.0 [Patenaude et al.,2007] integrated within FSL software. FIRST uses mesh models trained with a large amount of rich hand‐segmented training data to segment subcortical structures. This automatic method of segmentation is particularly useful for structures with low contrast‐to‐noise ratio. In each subject were segmented the putamen, thalamus, pallidum and caudate nuclei. An expert neuroradiologist (U. Sabatini) verified the accuracy of the segmentation on each subject. These segmented structures defined the anatomical ROIs from where R2* mean and standard deviation (ROI‐SD) of values were calculated. In order to take into account the inter‐subject differences in brain global volume, the T1‐weighted images of each subject were registered to the ICBM152 template using a full affine registration algorithm (normalized mutual information cost function). This spatial transformation was applied to each ROI and each subject, and we calculated the volumes of the four segmented areas from the normalized images. The normalization process did not change the regional volume variability in a major way [Ahsan et al.,2007].
Iron Content and R2* Values
To test the validity of our method as an indirect measure of iron content, we correlated the mean R2* values from each structure and each subject with published brain iron levels in normal adult [Hallgren and Sourander,1958]. In their post‐mortem study, these authors measured non‐heme iron content histologically (mg iron/100 g fresh tissue) in human specimens. In the same work, Hallgren and Sourander have also determined empirical formulae for the relationship between age and iron content in different brain regions. Among the regions examined, there were: globus pallidus (Y = 21.41 {1 − exp(−0.09X)} + 0.37), caudate nucleus (Y = 9.66 {1 − exp(−0.05X)} + 0.33), and putamen (Y = 14.62{1 − exp(−0.04X)} + 0.46), where Y represents the non‐heme iron in milligrams per 100 g fresh weight and X is the age in years. Therefore, for each subject age and for each structure, we calculated from the formula, the correspondent estimate for iron concentration (e.g., for an age of 20 years: globus pallidus: 29.66 mg/100 g = 21.41 {1 − exp(−0.09 × 20)} + 0.37). Previous iron‐related MR studies have used a similar methodology to test the relationship between MR signal and iron content [Bartzokis et al.,2007; Martin et al.,2008].
For these three structures, we realized a non parametric correlation between the calculated iron content value estimated in function of age and the measured R2* (R2* mean values of each structure).
Region‐Based Statistical Analysis
Volume of subcortical regions was compared with a repeated measures multivariate analysis of covariance (MANCOVA) using a three‐factor design that included two between‐structures factors (i) anatomical region (thalamus, putamen, caudate nucleus, pallidum) and (ii) lateralization (left and right hemisphere) and a within subjects factor (gender), co‐varying for the effects of age, given the known sensitivity of brain volume measures to this variable [Gunning‐Dixon et al.,1998; Raz et al.,2003]. Following this analysis, we compared volume for each anatomical regions with a MANCOVA using a two‐factor design that included a between‐structures factor (lateralization) and a within subjects factor (gender), co‐varying for the effects of age. Post‐hoc Scheffé tests were only conducted for structures where MANCOVA main effect resulted significant. The same analyses were performed on R2*mean values and R2* ROI‐SD values.
Finally, we performed non parametric correlation (Spearman rank correlation) for each structure testing for correlations between volume and age, and between volume and ROI‐SD to test the dependence between region size and ROI R2* heterogeneity.
Voxel‐Based Analysis
The spatial transformations calculated between individual [T1‐weighted − T1 ICBM152] and between individual [T2*‐weighted mean − T1‐weighted image] were applied for each subject to coregister R2* map on MNI template. We performed a non‐parametric correlation (permutation tests) between age and R2* values for each voxel of the four structures using Randomise v2.0 (Permutation‐based nonparametric inference − FSL 4). We reported correlations that survived at Family Wise Error (FWE) correction for multiple comparisons at voxel‐level significance threshold P < 0.05 (minimum cluster size = 20). In order to determine the probability of a particular voxel in ICBM152 space being occupied by a structure of interest, assessments were made of the frequency of that structure residing at that voxel across the 30 data sets. Unit increments in voxel intensity correspond to an increase of the probability of encountering a particular structure at that location of 1/30 = 3.33%.
RESULTS
Iron Content and R2*
The iron concentration calculated from age for each subject showed a variation for each structure: caudate nucleus: 6.44 − 8.75 mg iron/100 g fresh tissue, putamen 8.51 − 12.24 mg iron/100 g fresh tissue, globus pallidus 18.24 − 21.24 mg iron/100 g fresh tissue. The non parametric correlation between iron content calculated values and R2* measured values showed a significant positive correlation (Rho = 0.93 ; P < 0.001). These data are shown in Figure 1 with the regression line and the standard deviation of each structure.
Figure 1.

Correlation between iron concentration derived from published post‐mortem data [Hallgren and Sourander,1958] in function of age and R2* mean values of each entire subcortical structure for each participant. The values plotted on the Y axis are a direct MR measure (R2*), the values plotted on the X axis represent an indirect estimation of iron concentration in the basal ganglia obtained from the age of the subject. In the top left corner, 3D reconstruction based on T1‐weighted images of subcortical regions considered in this work. CN (blue): caudate nucleus ; Pu (red): putamen; GP (green): Globus pallidus.
Region‐Based Analysis
Volume
Figure 2 shows the mean and standard deviation of volume for each structure. The repeated measures multi‐factor MANCOVA (anatomical region, lateralization, gender) controlling for age showed only a significant main effect for anatomical region [F(3,78) = 53.55, P < .0001. The MANCOVA (lateralization, gender) controlling for age of each anatomical region showed for the thalamus only a significant main effect of lateralization [F(1,27) = 5.34, P < 0.05], for the caudate nucleus a significant main effect of gender [F(1,26) = 7.23, P < 0.02 and for pallidum only a significant interactions lateralization × gender [F(1,27) = 5.01, P < 0.05]. Post‐hoc Scheffé tests showed that the thalamus demonstrated an effect of lateralization (left < right; P < 0.001), the caudate nucleus showed a significant effect of gender (woman > man; P < 0.01). Post‐hoc Scheffé test was also realized to test the significant interaction found for the pallidum but these results did not reach significant statistical threshold (P < 0.05).
Figure 2.

Volumes (top) and R2* mean values (bottom) of subcortical structures considered in this work. From left to right: right and left thalamus, right and left putamen, right and left caudate nucleus, right and left globus pallidus.
The correlation analysis demonstrated (Table I) a significant negative correlation between age and volume for the right thalamus (Rho = −0.42, P < 0.05), right and left putamen (respectively : Rho = −0.37, P < 0.05, Rho = −0.43, P < 0.05).
Table I.
Correlative analysis between age and MR values
| Regions | Volume ± std. dev. (mm3) | Rho | P | R2 *Mean ± std dev (s−1) | Rho | P | R2* ROI‐SD ± std dev (s−1) | Rho | P |
|---|---|---|---|---|---|---|---|---|---|
| Left thalamus | 9986.93 ± 1061.93 | −0.25 | – | 20.34 ± 0.83 | 0.13 | – | 2.78 ± 0.45 | 0.16 | – |
| Right thalamus | 10513.13 ± 926.38 | −0.41 | <0.05* | 20.28 ± 0.72 | 0.15 | – | 2.98 ± 0.55 | 0.27 | – |
| Left putamen | 6472.97 ± 720.99 | −0.43 | <0.05* | 23.04 ± 1.49 | 0.73 | <0.001* | 2.79 ± 0.78 | 0.83 | <0.001* |
| Right putamen | 6660.13 ± 606.30 | −0.37 | <0.05* | 23.22 ± 1.54 | 0.60 | <0.001* | 2.77 ± 0.74 | 0.87 | <0.001* |
| Left caudate nucleus | 5268.53 ± 747.57 | −0.25 | – | 20.21 ± 1.21 | 0.47 | <0.05* | 2.96 ± 0.56 | 0.55 | <0.01* |
| Right caudate nucleus | 5335.53 ± 519.26 | −0.20 | – | 20.09 ± 1.17 | 0.44 | <0.01* | 3.16 ± 0.79 | 0.49 | <0.01* |
| Left globus pallidus | 2026.10 ± 358.02 | −0.24 | – | 34.26 ± 2.94 | 0.25 | – | 4.23 ± 1.03 | 0.27 | – |
| Right globus pallidus | 2095.50 ± 217.25 | −0.20 | – | 34.30 ± 2.66 | 0.23 | – | 4.13 ± 0.93 | 0.21 | – |
R2*
Figure 2 illustrates the mean and inter‐individual standard deviation of R2*‐mean values for each structure. The repeated measures multi‐factor MANCOVA (anatomical region, lateralization, gender) on R2* mean values controlling for age showed a significant interaction anatomical region × lateralization [F(3,81) = 22.82, P < 0.001] and a significant interaction anatomical region × lateralization × gender [F(3,81) = 5.82 P < 0.01]. Post‐hoc Scheffé test showed that the R2* mean values was significantly higher in pallidum and lower in caudate nucleus and thalamus (pallidum > putamen > caudate nucleus, thalamus). The MANCOVA (lateralization, gender) controlling for age of each anatomical region showed only significant interactions lateralization × gender in caudate nucleus [F(1,27) = 8.72, P < 0.01] and in pallidum [F(1,27) = 5.15, P < 0.05]. However, the post‐hoc Scheffé test did not reveal any significant differences. The correlation analysis demonstrated (Table II) a significant positive correlation between age and R2* mean located in the caudate nucleus (left: Rho = 0.47, P < 0.01; right : Rho = 0.44, P < 0.05), and the putamen (left : Rho = 0.73, P < 0.001; right: Rho = 0.60, P < 0.001).
We conducted also a repeated measures multi‐factor ANCOVA (anatomical region, lateralization, gender) controlling for age on R2* ROI‐SD values. This analysis showed a significant main effect of anatomical region [F(3,81) = 7.07, P < 0.001], a significant interaction gender × lateralization [F(1,27) = 9.32, P < 0.001] and a significant interaction anatomical region × lateralization × gender [F(3,81) = 2.94, P < 0.05]. Post‐hoc Scheffé test showed that the R2* ROI‐SD was significantly higher in pallidum compared to caudate nucleus, putamen and thalamus (P < 0.001). The MANCOVA (lateralization, gender) controlling for age of each anatomical region showed only significant interactions lateralization × gender in pallidum [F(1,27) = 6.14 P < 0.05]. The correlation analysis demonstrated (Table I) a significant positive correlation between age and R2* ROI‐SD located in the caudate nucleus (left: Rho = 0.55, P < 0.01; right : Rho = 0.50; P < 0.05), and the putamen (left : Rho = 0.83, P < 0.001; right: Rho = 0.87, P < 0.001).
Volume and R2*
For each structure, we performed also a non parametric correlation between R2* mean and volume and between R2* ROI‐SD and volume. No region showed significant correlation using a threshold at P < 0.05.
Voxel‐Based Analysis
The R2*‐mean values were also investigated using a voxel‐based analysis taking into consideration the four structures. Figure 3 shows the probabilistic maps. The correlation analysis was confined to those voxels belonging to the same anatomical structure in each subject corresponding to 100% in probabilistic maps. The result of analysis for each voxel considering the four structures showed that the posterior part of putamen bilaterally presented positive correlations with age (Fig. 3, colored in red).
Figure 3.
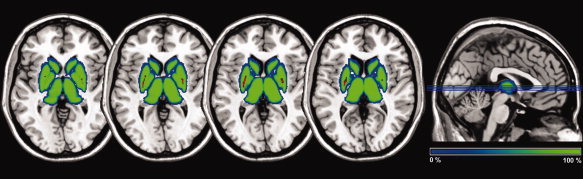
Results of R2* voxel‐based analysis. The blue‐green scale corresponds to the probabilistic map of subcortical structures. In red, regions for which non parametric significant correlations (P < 0.05; FWE corrected) have been found between R2* values and age.
DISCUSSION
It is the first time that a work combined iron level quantification and size estimation of entire subcortical structures in young healthy subjects. Our results revealed that the four subcortical structures presented different age‐related iron deposition/shrinkage patterns.
The close relationship (see Fig. 1) between R2* mean values measured in our study and iron concentration values calculated from published post‐mortem data on adult brain iron distribution [Hallgren and Sourander,1958] suggests that the MR parameter R2* could be used as a marker of iron content in brain. This indirect validation between MR values and iron content has been similarly used in previous studies [Bartzokis et al.,2007; Martin et al.,2008]. Moreover, previous in vitro [Gossuin et al.,2004] and animal [Hardy et al.,2005] histochemical studies have showed that the transverse relaxation time represents a good indicator of total iron concentrations in the brain.
Iron Content of Basal Ganglia and Thalamus
The indirect measures of iron level, from our automatic processing method, in each entire subcortical region are in agreement with previous post‐mortem studies [Fiehring and Sundermann,1959; Hallgren and Sourander,1958] and MR studies [Bartzokis et al.,2007; Pfefferbaum et al.,2008]. Recently, Bartzokis et al. [2007] showed that women have lower brain ferritin iron levels than men in all regions that we have evaluated. Our results failed to find any asymmetry between genders or hemispheres for iron content in these four structures. However, our analysis was conducted on young population of healthy subjects (age range: from 20 to 40 years) contrary to Bartzokis 's work in which the age range of population was larger (age range: 30 and 80 years) [Bartzokis et al.,2007]. The results of analysis, performed on each brain region, revealed a significant positive correlation between age and MR iron‐related values localized bilaterally in putamen and in caudate nucleus. The age‐related increase in iron levels in basal ganglia regions is well described in post‐mortem studies [Fiehring and Sundermann,1959; Hallgren and Sourander,1958] as in MR in vivo studies [Bartzokis et al.,2007; Pfefferbaum et al.,2008]. The significant relationship found between age and iron level heterogeneity in the same subcortical regions (putamen and caudate nucleus) is in agreement with the hypothesis of a progressive accumulation of iron content with age. It is important to note that we found no relationship between iron level heterogeneity and volume in any region. This result excluded the hypothesis that iron level heterogeneity could be linked to region size. In order to further investigate the iron level heterogeneity of each region, we tested also the age‐related increase using a voxel‐based approach. Our results showed only a significant positive correlation bilaterally in the posterior part of putamen.
Age‐Related Changes in Basal Ganglia and Thalamus
The aim of our work was to conjunctly measure volumes and iron levels of four entire subcortical structures. Regarding the relationship between age and shrinkage, our results showed a decrease of volume related to age in the right thalamus and the putamen bilaterally. This result is, at least partially, in agreement with previous studies [Greenberg et al.,2008; Gunning‐Dixon et al.,1998; McDonald et al.,1991; Raz et al.,2003; Sullivan et al.,2004; Walhovd et al.,2005].
We chose to use thalamus as a control structure since this subcortical region did not demonstrate age‐related iron increase [Hallgren and Sourander,1958]. Our results confirmed that the thalamus did not show age‐related iron deposition, while age had influence on the thalamus volume. Indeed, our results showed age‐related volume decrease in the thalamus of the right hemisphere. The caudate nucleus demonstrated the opposite pattern. In fact, we observed no volume decrease due to age but we found an increase of iron level. In the putamen, the results showed both age changes: a decrease of size and an increase of iron level. No correlations were observed in the globus pallidus. It is interesting to note that the iron level heterogeneity was significantly higher in this latter region than in the three other measured structures. However, the voxel‐based analysis failed to find age‐related iron deposition. Previous studies failed also to reveal age‐related iron increase in the pallidum [Martin et al.,1998; Pfefferbaum et al.,2008].
Considering together volume and iron level, the four subcortical structures revealed different patterns related to age. It is relevant to stress that we found no relationship between volume and iron level whatever the subcortical structure. One possible interpretation is that the age‐related iron deposition could potentiate the oxidative stress (for review see Zecca et al. [2004]) but would not directly promote the neuronal loss responsible for the structure shrinkage during the first years of adulthood. The pathogenic role of iron in brain aging has been described following a temporal evolution in three phases: iron accumulation, invasion and increased reactivity [Zecca et al.,2004]. The striatal age‐related iron increase in young adulthood could be interpreted as the first phase of this evolution (i.e. iron accumulation). Moreover, Cass and co‐workers showed that iron levels in the striatum might be a biomarker of motor dysfunction in aging [Cass et al.,2007].
Volume Asymmetry of Basal Ganglia and Thalamus
The values of volumes for each structure were similar to other recent volumetric results collected in an older group of healthy subjects [Ahsan et al.,2007]. Considering asymmetry, our volumetric results showed that the thalamus is bigger in the right hemisphere, and the caudate nucleus is bigger in women than in men. The difference between hemispheres regarding the thalamus has been observed in a previous study [Sullivan et al.,2004] that did not correct for intracranial volume and with studied older subjects. Other studies have reported significant differences in volume between the hemispheres for the caudate, putamen and globus pallidus [Anastasi et al.,2006; Gunning‐Dixon et al.,1998; Rosas et al.,2001; Szabo et al.,2003]. Concerning gender asymmetry, the caudate nucleus has been previously found larger in females than in males [Giedd et al.,1996] however this gender difference was not found systematically [Ahsan et al.,2007; Ifthikharuddin et al.,2000].
Past research has yielded an inconsistent pattern regarding the hemispheric direction of asymmetry of the neostriatal nuclei [Raz et al.,1995]. This discrepancy of the volumetric literature could be due to the methodological differences (i.e. in vivo or post mortem studies, manual or automatic definition of ROI) and/or to the different age of populations (different age mean or age range).
Technical Limitations
Even if the transverse relaxation rate (R2*) was criticized as an iron‐related MR estimation [Haacke et al.,2005], previous studies using this MR parameter have obtained convincing results [Gelman et al.,1999; Gorell et al.,1995; Graham et al.,2000; Martin et al.,2008; Ordidge et al.,1994]. Recently, R2*was used to demonstrate an iron‐related increase in the lateral substantia nigra pars compacta in Parkinson's disease that could be associated to the neuronal loss [Martin et al.,2008]. Another point demonstrating the validity of this method came from the small R2*mean standard deviation obtained in our group for each structure. It is not surprising considering that T2* relaxometry protocol combining data acquisition and data processing affords a high degree of sensitivity and good reproducibility while maintaining high spatial resolution [Peran et al.,2007].
Transverse relaxation rates can be measured using different image sequences or MR protocols (for a review see Haacke et al. [2005]). We chose to acquire several EPI volumes with high spatial resolution and different T2* weightings, using a setup identical to a previous work [Peran et al.,2007]. As an alternative, multi‐echo methods that acquire fully registered R2 and R2* images could remove the problems caused by slices misregistration or by variable EPI distortions at different echo times. However, our choice represented a compromise between high spatial resolution and short acquisition times, that has previously shown a good reproducibility and an excellent sensitivity to R2* variations [Peran et al.,2007].
Another methodological limitation, but in the same time an advantage, was the segmentation based on volumetric T1‐weighted images. This kind of MR acquisition is less sensible to the presence of iron species. This relative iron independence makes the segmentation step reasonably independent to the iron‐related determination step. Moreover the probabilistic map (Fig. 3) from voxel‐based analysis did not show noteworthy anatomical variations between subjects for the same subcortical structures in agreement with a previous work in which subcortical segmentation was realized manually [Ahsan et al.,2007].
In our work, we used a region‐based analysis and a voxel‐based approach to calculate the relationship between MR iron‐related level and age. The volumetric results demonstrated the importance to keep the localization information. A possible compromise could be to realize region definition more precisely segmenting subpart of each subcortical structure (e.g. head and tale of caudate nucleus).
CONCLUSION
Our approach, combining volumetry and iron estimation, could potentially represent a method for investigating physiological and pathological changes in basal ganglia, in particular for neurodegenerative pathologies such as Parkinson's [Bartzokis et al.,1999b; Graham et al.,2000; Michaeli et al.,2007; Pujol et al.,1992] or Huntington's disease [Bartzokis et al.,1999a].
REFERENCES
- Ahsan RL,Allom R,Gousias IS,Habib H,Turkheimer FE,Free S,Lemieux L,Myers R,Duncan JS,Brooks DJ,Koepp MJ,Hammers A ( 2007): Volumes, spatial extents and a probabilistic atlas of the human basal ganglia and thalamus. Neuroimage 38: 261–270. [DOI] [PubMed] [Google Scholar]
- Anastasi G,Cutroneo G,Tomasello F,Lucerna S,Vitetta A,Bramanti P,Di Bella P,Parenti A,Porzionato A,Macchi V, et al. ( 2006): In vivo basal ganglia volumetry through application of NURBS models to MR images. Neuroradiology 48(5): 338–345. [DOI] [PubMed] [Google Scholar]
- Bartzokis G,Beckson M,Hance DB,Marx P,Foster JA,Marder SR ( 1997): MR evaluation of age‐related increase of brain iron in young adult and older normal males. Magn Reson Imaging 15(1): 29–35. [DOI] [PubMed] [Google Scholar]
- Bartzokis G,Cummings J,Perlman S,Hance DB,Mintz J ( 1999a): Increased basal ganglia iron levels in Huntington disease. Arch Neurol 56(5): 569–574. [DOI] [PubMed] [Google Scholar]
- Bartzokis G,Cummings JL,Markham CH,Marmarelis PZ,Treciokas LJ,Tishler TA,Marder SR,Mintz J ( 1999b): MRI evaluation of brain iron in earlier‐ and later‐onset Parkinson's disease and normal subjects. Magn Reson Imaging 17(2): 213–222. [DOI] [PubMed] [Google Scholar]
- Bartzokis G,Tishler TA,Lu PH,Villablanca P,Altshuler LL,Carter M,Huang D,Edwards N,Mintz J ( 2007): Brain ferritin iron may influence age‐ and gender‐related risks of neurodegeneration. Neurobiol Aging 28(3): 414–423. [DOI] [PubMed] [Google Scholar]
- Bartzokis G,Tishler TA,Shin IS,Lu PH,Cummings JL ( 2004): Brain ferritin iron as a risk factor for age at onset in neurodegenerative diseases. Ann N Y Acad Sci 1012: 224–236. [DOI] [PubMed] [Google Scholar]
- Berg D,Hochstrasser H,Schweitzer KJ,Riess O ( 2006): Disturbance of iron metabolism in Parkinson's disease—Ultrasonography as a biomarker. Neurotox Res 9(1): 1–13. [DOI] [PubMed] [Google Scholar]
- Bizzi A,Brooks RA,Brunetti A,Hill JM,Alger JR,Miletich RS,Francavilla TL,Di Chiro G ( 1990): Role of iron and ferritin in MR imaging of the brain: a study in primates at different field strengths. Radiology 177(1): 59–65. [DOI] [PubMed] [Google Scholar]
- Bush AI ( 2003): The metallobiology of Alzheimer's disease. Trends Neurosci 26(4): 207–214. [DOI] [PubMed] [Google Scholar]
- Cass WA,Grondin R,Andersen AH,Zhang Z,Hardy PA,Hussey‐Andersen LK,Rayens WS,Gerhardt GA,Gash DM ( 2007): Iron accumulation in the striatum predicts aging‐related decline in motor function in rhesus monkeys. Neurobiol Aging 28(2): 258–271. [DOI] [PubMed] [Google Scholar]
- Drayer B,Burger P,Darwin R,Riederer S,Herfkens R,Johnson GA ( 1986): MRI of brain iron. AJR Am J Roentgenol 147(1): 103–110. [DOI] [PubMed] [Google Scholar]
- Fiehring H,Sundermann A ( 1959): [Ferritin in the normal human brain.]. Z Gesamte Inn Med 14: 787–790. [PubMed] [Google Scholar]
- Gelman N,Gorell JM,Barker PB,Savage RM,Spickler EM,Windham JP,Knight RA ( 1999): MR imaging of human brain at 3.0 T: preliminary report on transverse relaxation rates and relation to estimated iron content. Radiology 210(3): 759–767. [DOI] [PubMed] [Google Scholar]
- Giedd JN,Snell JW,Lange N,Rajapakse JC,Casey BJ,Kozuch PL,Vaituzis AC,Vauss YC,Hamburger SD,Kaysen D, et al. ( 1996): Quantitative magnetic resonance imaging of human brain development: ages 4–18. Cereb Cortex 6(4): 551–560. [DOI] [PubMed] [Google Scholar]
- Gorell JM,Ordidge RJ,Brown GG,Deniau JC,Buderer NM,Helpern JA ( 1995): Increased iron‐related MRI contrast in the substantia nigra in Parkinson's disease. Neurology 45(6): 1138–1143. [DOI] [PubMed] [Google Scholar]
- Gossuin Y,Burtea C,Monseux A,Toubeau G,Roch A,Muller RN,Gillis P ( 2004): Ferritin‐induced relaxation in tissues: an in vitro study. J Magn Reson Imaging 20(4): 690–696. [DOI] [PubMed] [Google Scholar]
- Graham JM,Paley MN,Grunewald RA,Hoggard N,Griffiths PD ( 2000): Brain iron deposition in Parkinson's disease imaged using the PRIME magnetic resonance sequence. Brain 123(Pt 12): 2423–2431. [DOI] [PubMed] [Google Scholar]
- Greenberg DL,Messer DF,Payne ME,Macfall JR,Provenzale JM,Steffens DC,Krishnan RR ( 2008): Aging, gender, and the elderly adult brain: an examination of analytical strategies. Neurobiol Aging 29(2): 290–302. [DOI] [PMC free article] [PubMed] [Google Scholar]
- Gunning‐Dixon FM,Head D,McQuain J,Acker JD,Raz N ( 1998): Differential aging of the human striatum: A prospective MR imaging study. AJNR Am J Neuroradiol 19(8): 1501–1507. [PMC free article] [PubMed] [Google Scholar]
- Haacke EM,Cheng NY,House MJ,Liu Q,Neelavalli J,Ogg RJ,Khan A,Ayaz M,Kirsch W,Obenaus A ( 2005): Imaging iron stores in the brain using magnetic resonance imaging. Magn Reson Imaging 23(1): 1–25. [DOI] [PubMed] [Google Scholar]
- Hardy PA,Gash D,Yokel R,Andersen A,Ai Y,Zhang Z ( 2005): Correlation of R2 with total iron concentration in the brains of rhesus monkeys. J Magn Reson Imaging 21(2): 118–127. [DOI] [PubMed] [Google Scholar]
- Hallgren B,Sourander P ( 1958): The effect of age on the non‐haemin iron in the human brain. J Neurochem 3(1): 41–51. [DOI] [PubMed] [Google Scholar]
- Hilditch‐Maguire P,Trettel F,Passani LA,Auerbach A,Persichetti F,MacDonald ME ( 2000): Huntingtin: An iron‐regulated protein essential for normal nuclear and perinuclear organelles. Hum Mol Genet 9(19): 2789–2797. [DOI] [PubMed] [Google Scholar]
- Ifthikharuddin SF,Shrier DA,Numaguchi Y,Tang X,Ning R,Shibata DK,Kurlan R ( 2000): MR volumetric analysis of the human basal ganglia: normative data. Acad Radiol 7(8): 627–634. [DOI] [PubMed] [Google Scholar]
- Jellinger K,Paulus W,Grundke‐Iqbal I,Riederer P,Youdim MB ( 1990): Brain iron and ferritin in Parkinson's and Alzheimer's diseases. J Neural Transm Park Dis Dement Sect 2(4): 327–340. [DOI] [PubMed] [Google Scholar]
- Jenner P. ( 2003): Oxidative stress in Parkinson's disease. Ann Neurol 53( Suppl 3): S26–S36; discussion S36–S38. [DOI] [PubMed] [Google Scholar]
- Jensen JH,Chandra R,Ramani A,Lu H,Johnson G,Lee SP,Kaczynski K,Helpern JA ( 2006): Magnetic field correlation imaging. Magn Reson Med 55(6): 1350–1361. [DOI] [PubMed] [Google Scholar]
- Kaur D,Andersen J ( 2004): Does cellular iron dysregulation play a causative role in Parkinson's disease? Ageing Res Rev 3(3): 327–343. [DOI] [PubMed] [Google Scholar]
- Martin WR,Wieler M,Gee M ( 2008): Midbrain iron content in early Parkinson disease: a potential biomarker of disease status. Neurology 70 (16 Pt 2): 1411–1417. [DOI] [PubMed] [Google Scholar]
- Martin WR,Ye FQ,Allen PS ( 1998): Increasing striatal iron content associated with normal aging. Mov Disord 13(2): 281–286. [DOI] [PubMed] [Google Scholar]
- McDonald WM,Husain M,Doraiswamy PM,Figiel G,Boyko O,Krishnan KR ( 1991): A magnetic resonance image study of age‐related changes in human putamen nuclei. Neuroreport 2(1): 57–60. [DOI] [PubMed] [Google Scholar]
- Michaeli S,Oz G,Sorce DJ,Garwood M,Ugurbil K,Majestic S,Tuite P ( 2007): Assessment of brain iron and neuronal integrity in patients with Parkinson's disease using novel MRI contrasts. Mov Disord 22(3): 334–340. [DOI] [PubMed] [Google Scholar]
- Moos T,Morgan EH ( 2004): The metabolism of neuronal iron and its pathogenic role in neurological disease: review. Ann N Y Acad Sci 1012: 14–26. [DOI] [PubMed] [Google Scholar]
- Morris CM,Kerwin JM,Edwardson JA ( 1994): Non‐haem iron histochemistry of the normal and Alzheimer's disease hippocampus. Neurodegeneration 3(4): 267–275. [PubMed] [Google Scholar]
- Ogg RJ,Langston JW,Haacke EM,Steen RG,Taylor JS ( 1999): The correlation between phase shifts in gradient‐echo MR images and regional brain iron concentration. Magn Reson Imaging 17(8): 1141–1148. [DOI] [PubMed] [Google Scholar]
- Ordidge RJ,Gorell JM,Deniau JC,Knight RA,Helpern JA ( 1994): Assessment of relative brain iron concentrations using T2‐weighted and T2*‐weighted MRI at 3 Tesla. Magn Reson Med 32(3): 335–341. [DOI] [PubMed] [Google Scholar]
- Patenaude B,Smith S,Kennedy D,Jenkinson M ( 2007): FMRIB's integrated registration and segmentation tool. Human Brain Mapping Conference. [Google Scholar]
- Peran P,Hagberg G,Luccichenti G,Cherubini A,Brainovich V,Celsis P,Caltagirone C,Sabatini U ( 2007): Voxel‐based analysis of R2* maps in the healthy human brain. J Magn Reson Imaging 26(6): 1413–1420. [DOI] [PubMed] [Google Scholar]
- Pfefferbaum A,Adalsteinsson E,Rohlfing T,Sullivan EV ( 2008): Diffusion tensor imaging of deep gray matter brain structures: Effects of age and iron concentration. Neurobiol Aging. doi:10.1016/j.neurobiolaging.2008.04.013 [DOI] [PMC free article] [PubMed] [Google Scholar]
- Pujol J,Junque C,Vendrell P,Grau JM,Marti‐Vilalta JL,Olive C,Gili J ( 1992): Biological significance of iron‐related magnetic resonance imaging changes in the brain. Arch Neurol 49(7): 711–717. [DOI] [PubMed] [Google Scholar]
- Raz N,Rodrigue KM,Kennedy KM,Head D,Gunning‐Dixon F,Acker JD ( 2003): Differential aging of the human striatum: longitudinal evidence. AJNR Am J Neuroradiol 24(9): 1849–1856. [PMC free article] [PubMed] [Google Scholar]
- Raz N,Torres IJ,Acker JD ( 1995): Age, gender, and hemispheric differences in human striatum: a quantitative review and new data from in vivo MRI morphometry. Neurobiol Learn Mem 63(2): 133–142. [DOI] [PubMed] [Google Scholar]
- Rosas HD,Goodman J,Chen YI,Jenkins BG,Kennedy DN,Makris N,Patti M,Seidman LJ,Beal MF,Koroshetz WJ ( 2001): Striatal volume loss in HD as measured by MRI and the influence of CAG repeat. Neurology 57(6): 1025–1028. [DOI] [PubMed] [Google Scholar]
- Sullivan EV,Rosenbloom M,Serventi KL,Pfefferbaum A ( 2004): Effects of age and sex on volumes of the thalamus, pons, and cortex. Neurobiol Aging 25(2): 185–192. [DOI] [PubMed] [Google Scholar]
- Szabo CA,Lancaster JL,Xiong J,Cook C,Fox P ( 2003): MR imaging volumetry of subcortical structures and cerebellar hemispheres in normal persons. AJNR Am J Neuroradiol 24(4): 644–647. [PMC free article] [PubMed] [Google Scholar]
- Walhovd KB,Fjell AM,Reinvang I,Lundervold A,Dale AM,Eilertsen DE,Quinn BT,Salat D,Makris N,Fischl B ( 2005): Effects of age on volumes of cortex, white matter and subcortical structures. Neurobiol Aging 26(9): 1261–1270; discussion 1275–1278. [DOI] [PubMed] [Google Scholar]
- Zecca L,Youdim MB,Riederer P,Connor JR,Crichton RR ( 2004): Iron, brain ageing and neurodegenerative disorders. Nat Rev Neurosci 5(11): 863–873. [DOI] [PubMed] [Google Scholar]