

Abstract
Both the N200 and P300, which are, for example, evoked by Go/Nogo or Stop‐Signal tasks, have long been interpreted as indicators for inhibition processes. Such interpretations have recently been challenged, and interest in the exact neural generators of these brain responses is continuously growing. Using recent methodological advancements, source estimations for the N200 and P300 as evoked by a tactile response inhibition task were computed. Current density reconstructions were also calculated accounting for interindividual differences in head geometry by incorporating information from T1‐weighted magnetic resonance images. To ease comparability with relevant paradigms, the task was designed to mimic important characteristics of both Go/Nogo and Stop‐Signal tasks as prototypes for a larger set of paradigms probing response inhibition. A network of neural generators was revealed, which has previously been shown to act in concert with executive control processes and thus is in full agreement with observations from other modalities. Importantly, a spatial segregation of midcingulate sources was observed. Our experimental data indicate that a left anterior region of the midcingulate cortex (MCC) is a major neural generator of the N200, whereas the midcingulate generator of the P300 is located in the right posterior MCC. Analyses of the P300 also revealed several areas, which have previously been associated with motor functions, for example, the precentral region. Our data clearly suggest a neuroanatomical and therefore also functional dissociation of the N200 and P300, a finding that cannot easily be provided by other imaging techniques. Hum Brain Mapp, 2010. © 2010 Wiley‐Liss, Inc.
Keywords: inhibition, nogo, N200, P300, anterior cingulated, source analysis, ACC, generator, EEG, stop
INTRODUCTION
Both the Go/Nogo task and the Stop‐Signal task have long been part of an experimental instrumentation of paradigms used to study the cognitive analogies of stopping [Aron, 2009]. They are often treated or interpreted interchangeably [e.g. Nee et al., 2007], not only because of their apparent similarities in task demands, but also due to the homogeneity of the evoked electrophysiological responses. Both tasks usually require that subjects withhold a response in a task‐set that, most frequently, calls for an immediate reaction. Accordingly, event‐related potentials (ERPs) from Go/Nogo and Stop‐Signal tasks strongly resemble each other. In the stop or nogo—but not the go condition—a pronounced fronto‐central negativity is regularly observed around 200–300 ms after stimulus onset, followed by a distinct positive response. These ERPs in electroencephalographic recordings (EEG) are commonly known as N200 (N2) and P300 (P3) or the N2/P3‐complex and are evoked in a large family of paradigms probing motor or response inhibition [Falkenstein et al., 1999; Johnstone et al., 2007].
The concept of inhibition provides the predominant functional interpretation of these ERPs. This concept assumes that, at some time during task execution, an inappropriate or unwanted action needs to be suppressed (for review, see Aron [2007]). Quite commonly both the N200 and P300 are interpreted alike. However, this view has recently been challenged. Supported by the observation that an N200‐like potential can be elicited with an inversion of trial frequencies (response to seldom go‐signals amongst frequent nogo‐signals), an alternative interpretation of the N200 has been provided by the conflict‐monitoring hypothesis ([Nieuwenhuis et al., 2003]; but see Smith et al. [2007], for a discussion). According to this view, electrophysiological differences between conditions reflect the detection of response conflict due to the simultaneous activation of two response alternatives, especially when one of the alternatives is prepotent in the task setting.
Stimulated by the discussion about functional meanings of the N200 and the P300, the interest in neuronal generators of these ERPs has substantially grown. The identification of the corresponding neural correlates of response inhibition or conflict monitoring might provide further insights concerning the functional meaning of the N2/P3‐complex. From a neuroanatomical perspective, increasing evidence links the concept of inhibition and the concept of conflict‐monitoring to the inferior frontal (IFC) and the midcingulate cortex (MCC; often also termed dorsal anterior cingulate cortex or dACC), respectively. For example, in an interesting review Aron [2007] argues in favor of a motor‐inhibition mechanism, which can for instance be observed in the Stop‐Signal paradigm and seems to be situated in the (right) IFC. This assumption is very much based on the following observations: (a) the larger a patient's lesion in the IFC, the longer the stopping times [Aron et al., 2003]; (b) activation in the right IFC and the subthalamic nucleus are associated with the speed of stopping in healthy subjects [Eagle and Robbins, 2003; van den Wildenberg et al., 2006]; (c) short‐interval intracortical inhibition in the contralateral primary motor cortex increases when the motor response is successfully inhibited [Coxon et al., 2006]. Likewise, recent research strongly associates conflict‐monitoring with the MCC (see, for example, Botvinick et al. [2004]). The MCC is usually recruited when experimental conditions lead to interferences in information processing, e.g. (a) overcoming a prepotent response tendency (e.g., with the Stroop task; [Laird et al., 2005]); (b) choosing between underdetermine responses (e.g., word‐stem completion; [Fu et al., 2002]); (c) processing errors that are relevant for current task performance [Debener et al., 2005]. Recent observations suggest that the MCC plays an important role in the evaluation of ongoing performance rather than the execution of control mechanisms. Kerns et al. [2004] showed that midcingulate activation preceded both behavioral adaptations to situations of high conflict as well as heightened prefrontal engagement during the performance of a Stroop task.
However, the inferior frontal and midcingulate cortical areas are often coactivated when executive functions are part of the experimental demands [e.g. Rubia et al., 2001; Nee et al., 2007]. Although many experimental manipulations presumably involve both, conflict‐monitoring and some form of inhibition simultaneously, it is important to investigate functional dissociations and task specificity of the IFC and the MCC. In accordance with this notion, recent studies reported functional and regional segregations of the IFC and the MCC. Chevrier et al. [2007], for example, found activation of the inferior frontal region only associated with inhibitory demands in a Stop‐Signal task, whereas the MCC responded specifically to aspects of performance monitoring, and more specifically error processing. Likewise, Matthews et al. [2005] reported activation of the IFC but not the MCC, when increasing the inhibitory load of a Stop‐Signal task. These findings underscore the idea that functionally distinct concepts are associated with inferior frontal and midcingulate regions.
Reviewing the literature on source analyses with Go/Nogo and Stop‐Signal tasks, the most commonly used tasks to study response inhibition, some variability concerning task characteristics, methods, and results becomes obvious. An overview of studies is given in Table I. Concerning the N200, previous studies found dominant generators in either the inferior frontal or the midcingulate region. With respect to the P300, surface potentials might also be generated by a deep source (MCC/dACC), but two studies also indicate contributions from the precentral cortex. Since source estimations so far have been computed as based on difference‐waves (nogo/stop–go), it still remains unclear whether the regions mentioned above indeed provide the major generators or if this technique only points to those structures that most strongly differentiate between conditions. Of note, only studies with a lower percentage of stop/nogo in relation to go trials indicated deep sources [Bekker et al., 2005; Nieuwenhuis et al., 2003]. In accordance with a midcingulate source underlying the N200, our group previously reported a strong association of morphological characteristics of the MCC and N200 amplitudes in a lateralized, tactile response inhibition task (Huster et al., submitted). We found that the stronger the experimental conditions functionally challenged the left hemisphere, the higher is the correlation of the N200 amplitude with a leftward asymmetry in midcingulate folding. More specifically, correlations were lowest with dominant right‐ and strongest with dominant left‐hemispheric processing. Therefore, these data also suggested a midcingulate contribution to N200 generation, exhibiting a bias towards the left hemisphere. Concerning the P300, the lack of such an association with midcingulate morphology might indicate either that there is no substantial involvement of the MCC or that there is a regional and functional dissociation in the MCC (see Lütcke and Frahm [2008] for a similar notion).
Table I.
List of source analyses on ERPs from Go/Nogo and Stop‐Signal tasks
| Author | Year | Task | ERP | Inverse | Model | Space | Esource |
|---|---|---|---|---|---|---|---|
| N200 | |||||||
| Kok et al. | 2004 | STOP‐50 | Difference | Dipole | Three spheres | Sphere | Ant tempa |
| Lavric et al. | 2004 | GNG‐50 | Difference | LORETA | sRHM | sCortex | rIFC |
| Bekker et al. | 2005 | GNG‐50/75b | Average | Dipole | Three spheres | Sphere | MCC |
| Nieuwenhuis et al. | 2003 | GNG‐80 | Difference | Dipole | Three spheres | Sphere | MCC |
| P300 | |||||||
| Kok et al. | 2004 | STOP‐50 | Difference | Dipole | Three spheres | Sphere | Mesial/pre central |
| Ramautar et al. | 2006 | STOP‐50 | Difference | Dipole | Three spheres | Sphere | Mesio‐central |
The number in the “task” column indicates the percentage of go trials; inverse, inverse solution; model, head model; space, source space; esource, estimated/reconstructed source; sRHM, standardized realistic head model; sCortex, standardized representation of the cortex.
Kok et al. [2004] report the N200 source estimates only for stimulus‐locked, unsuccessful stop‐signal trials.
Bekker et al. [2005] calculated ERPs from two studies using a hybrid of a Go/Nogo and a Continuous‐Performance‐Task with varying nogo‐trial probabilities.
As stated above, prior studies applied their estimation procedures to a difference‐wave (nogo/stop–go), an approach that usually helps to improve the interpretability of the results by suppressing processes common to both conditions, thereby isolating a cognitive process. Unfortunately, this procedure holds the potential disadvantage of introducing spurious activity if conditions differ in more than the effect of interest. A frequently debated issue in this context is the latency jitter of the response waveforms. Interpretations of the N200 and P300 might become even more problematic if conditions not only differ in a single cognitive process (inhibition or conflict‐monitoring in the nogo/stop, but not the go condition), but also in other experimental conditions such as the occurrence of a motor response (in go trials only). Therefore, computing difference‐waveforms might contaminate the N2/P3‐complex, leading to disturbances of the scalp topography in nogo and stop trials, potentially impairing the source estimation procedure. With respect to another methodological aspect, all prior studies except Lavric et al. [2004] attempted to estimate the neural source using data modeling based on single equivalent current dipoles and spherical head models. Although this technique is able to provide meaningful results, especially when trying to confirm an expected source constellation, its application in situations with an unknown number of sources is not trivial and sometimes even questionable. It is not uncommon to seed a single dipole to a point in space where the true generator is assumed and to interpret the percentage of explained variance as an index of the appropriateness of this model [e.g. Hanslmayr et al., 2008]. Nevertheless, given that the actual origin and number of generators for both the N200 and P300 are still under investigation a more data driven approach seems to be better suited.
Recent advances in the reconstruction of electrophysiological sources measured via EEG or magnetoencephalography (MEG) promise accurate source estimations even with cognitive experiments when the knowledge about number and constellation of possible generators is strongly limited. This can be achieved by integrating a maximum of information concerning an individual's neuroanatomy (head geometry) into the volume conductor model (see Michel et al. [2004] for an overview). For example, instead of approximating the geometry of a human head with a sphere, interfaces between brain compartments (e.g., brain, skull, and skin) are estimated from medical images (usually T1‐weighted magnetic resonance images) for each subject. In addition, MR images can also be used to segment gray‐matter brain maps. The resulting gray‐matter image reasonably confines the solution space for putative sources of electrophysiological activity to the cortex. Advances of methods for inverse modeling also promise a higher degree of spatial accuracy. For example, sLORETA and related approaches attract much attention due to their ability to provide solutions with low estimation errors even in the presence of noise [e.g. Michel et al., 2004; Pascual‐Marqui, 2002; Wagner et al., 2004]. The current methodological status concerning EEG source modeling thus enables us to infer brain activations from superficial electrode recordings with much higher accuracy than only a few years before [Grech et al., 2008; Hallez et al., 2007].
The main purpose of this study was to localize the cerebral generators of both the N200 and P300 as observed with motor‐inhibition paradigms. More specifically, we were interested to investigate whether a midcingulate source can be detected for the N200, but not the P300, or alternatively, whether different midcingulate regions contribute to N200 and P300 generation. Therefore, we established a task set mimicking major characteristics of the most regularly applied paradigms to study the cognitive determinants of stopping, namely the Go/Nogo and Stop‐Signal tasks. We adopted a lateralized tactile response inhibition task, which provided good signal‐to‐noise‐ratios for the potentials of interest in a prior study (Huster et al., submitted). Here, a low number of stop trials occurs amongst frequent manual responses, reflecting the most common way of a Stop‐Signal or Go/Nogo task setup. Taking advantage of recent methodological developments, the realistic head geometry as well as the solution space was estimated from structural T1‐weighted images for each individual. Current density distributions were then computed for a subject's N200 and P300 maxima using a sLORETA‐weighted accurate minimum norm inverse solution (SWARM; [Wagner et al., 2007]). As resulting current density reconstructions (CDRs) vary according to interindividual differences in neuroanatomy, a processing pipeline was implemented that relies on the SPM software package and allows for the computation of group statistics. Source analyses were first conducted separately for each condition, subsequently comparing differences between conditions within the framework of the general linear model. This procedure enables the differentiation of sources generally contributing to the generation of a specific potential and those generators predominantly causing the differences between conditions measured at scalp electrodes.
METHODS
Subjects
A total of 25 young female and male right‐handed subjects were recruited via advertisements and participated in this study. In a first session, participants underwent the MR scanning protocol as described below. Handedness was verified using the Edinburgh Handedness Inventory [Oldfield, 1971]. None of the subjects had a history of psychiatric or neurological disorders. During the second session, participants performed the tactile response inhibition task specified below while their EEG was continuously recorded. Datasets from three participants were excluded from the analysis due to excessive artifacts in the EEG recordings. The final sample consisted of 22 subjects (11 females, 11 males). The participants' age ranged from 20 to 28 years (mean age, 24.7 years). All participants gave written informed consent before participating in the study.
MRI Protocol
Scans were performed using a 1.5‐T Philips Gyroscan Intera MRI (Philips, The Netherlands). Movement‐related artifacts were minimized by stabilization of the participant's head with foam cushions and an elastic forehead strap. Fast field echo acquisition was used to collect 160 contiguous T1‐weighted (TR = 11.64 ms, TE = 3.3 ms) 1‐mm‐thick slices in the axial plane. Given a congruent field of view (FOV 256 × 256 mm2) and in‐plane matrix (256 × 256), resulting voxels were isotropic (1 mm3).
Apparatus and Stimuli
A tactile response inhibition task was implemented by means of a special device and software, primarily developed for the measurement of sensory abilities and interhemispheric transfer in the visual, auditory, and somatosensory domain. For this experimental setting, only the somatosensory module of the program was used. The equipment consisted of two mirror‐symmetrically build devices for stimulation and response‐registration of all fingers, except of the thumbs, of both hands. Subjects received a tactile stimulation of the tips of their index or middle fingers of either hand by an electromagnetically operated metallic bolt, embedded in an aperture of the device underneath the subjects' finger tips. Responses were recorded by simple button presses. Importantly, the device is built in an integral way allowing the same finger to be stimulated and to respond within the same trial. During the testing procedure, subjects were instructed to keep their gaze focused on a fixation cross presented on a screen at a distance of 60 cm.
Procedure
The participants were instructed to respond to a single stimulation applied to the index finger of a hand (go trial; S1), whereas to withhold the response if a stimulation was given to the index and the middle finger of the same hand in rapid succession [stop trial; S1–S2 stimulus onset asynchrony (SOA) = 95 ms]. By using this stimulus‐configuration with a short S1–S2 SOA, the design mimics the major characteristics of both Go/Nogo and stop‐signal tasks as conducted with other modalities. This “hybrid” paradigm thus fosters the comparability between the various variants of Go/Nogo and Stop‐Signal tasks. In addition, it has to be noted that the assignment of a doubled stimulation to the stop condition only, thus not controlling for the number of stimulations, constitutes a task set consistent with standard Stop‐Signal tasks. To counterbalance all effects due to functional lateralization, subjects were instructed to respond via button presses with the left or the right index finger, resulting in four stimulation × response‐side combinations assessed in two blocks each. The order of these experimental blocks was counterbalanced across subjects. It is agreed upon that such lateralized conditions, especially with this rather simple response choice paradigms, do not differ with respect to the composition of cognitive processes, but merely regarding the interhemispheric transition of information [Zaidel and Iacoboni, 2002]. Therefore, averaging across such conditions is feasible as long as aspects of lateralization per se are not of integral interest. Each of the blocks consisted of 160 trials (120 go‐ and 40 stop‐trials, presented in a randomized order) and was preceded by 12 training trials to ensure that participants understood the instructions and to familiarize them with the stimuli. The average intertrial‐interval (S1–S1) was set to 1,650 ms with a variable shift in timing from trial to trial of ±100 ms. The subjects were instructed that both speed and accuracy matter and that they should not emphasize one over the other.
Electrophysiological Recordings and Parametrization
Electrophysiological responses were recorded in a shielded room, using the BrainAmp amplification system for the measurement of EEG (Brain Products GmbH, Gilching, Germany). Electrophysiological indices of brain activity were recorded from 61 sintered Ag/AgCl equidistant electrodes mounted on a flexible lycra‐electrocap (easycap, Falk Minow Services, Munich, Germany) according to the 10–10 system for electrode placement. The vertical and horizontal electrooculograms (EOG) were recorded from four electrodes placed on the outer canthi of both eyes and from the infra‐ and supra‐orbital ridges of the right eye. EEG and EOG were recorded continuously within the bandwidth of DC to 100 Hz, at a sampling rate of 250 Hz. Impedances were kept below 5 kΩ and matched for homologous sites with a maximum deviation of 500 Ω. Cz was used as online reference, and a ground electrode was placed on the forehead. Offline, the data were recalculated against the common average reference and filtered from 0.1 to 35 Hz to increase the signal‐to‐noise ratio. Muscular as well as technical artifacts were rejected by precise visual inspection. Ocular artifacts were corrected by means of a regression algorithm according to Gratton et al. [1983]. The continuous EEG was segmented into epochs ranging from 100‐ms prestimulus to 800‐ms poststimulus, and a baseline correction was applied using the prestimulus interval. Averages were computed separately for both the go and stop conditions, excluding trials with delayed or erroneous responding (reaction times >1,000 ms and errors of commission). The individual electrode positions for each subject were digitized by means of a 3D tracking device (CMS20, zebris Medical GmbH, Isny, Germany) for later coregistration with the anatomical datasets.
For the statistical analysis of electrophysiological activity at the scalp, mean amplitudes (20 ms around the peak) of the N200 and P300 were calculated. The peaks were determined by computing the local (negative or positive) maxima within the time windows from 250 to 350 ms for the N200 and from 350 to 500 ms for the P300. Peak measures were derived from electrode positions approximating Fz, Cz, and Pz, because the effects of interest are usually most pronounced in these regions (e.g. [Kok et al., 2004]). The mean peak latencies were 289.66 ms and 401.24 ms for the stop‐related N200 and P300, respectively. Mean amplitudes were preferred to simple single peaks because of their higher reliability. In accordance with the surface topographical analysis, the same time intervals were used for the source estimation of N200 and P300. When there was no distinct peak detectable in a condition, the corresponding values from an associated condition were adopted. For example, if there was no clear N200 detectable in the go condition, the time interval was set up in correspondence with the stop condition.
Source Analysis
Individual source analyses were performed using the CURRY software package (version 6; Compumedics Germany GmbH, Hamburg). Anatomical landmarks (nasion, left, and right preauricular points) were used to coregister individual electrode positions to a subject's structural MRI. A three‐compartment boundary element model was computed for each participant. The resolution of the meshes was set to 9, 8, and 6 mm for skin, skull, and brain, respectively. Standard conductivity values for the three compartments were set to: skin = 0.33 S/m, skull = 0.0042 S/m, and brain = 0.33 S/m. After gray‐matter segmentation of the brain, a representation of the cortex excluding the brainstem and cerebellum was computed to limit the source space for the inverse solution. CDRs were calculated using the SWARM method [Wagner et al., 2007], which belongs to the family of weighted minimum norm solutions with its weights being based on a previously computed sLORETA outcome. Finally, the solutions for the different data points of the 20‐ms intervals were averaged separately for each potential, condition, and subject. As the resulting mean, current density images are not comparable between subjects due to individual differences in brain morphology, a normalization procedure similar to the preprocessing of fMRI data was applied. Therefore, the anatomical T1‐weighted images were normalized using the SPM 5 software package and its algorithms. The deformation fields resulting from this procedure were subsequently applied to the average CDR images, thereby transforming all source reconstructions to a standard space and enabling voxel‐wise comparisons. An adapted template of the cortical gray matter was computed by averaging the normalized and smoothed (FWHM 8 mm) gray matter images of the sample, subsequently overlaying this mean image with a mask of the cerebral cortex (which was exported from the MARINA software‐package from the Bender Institute of Neuroimaging at the University of Giessen; http://www.bion.de). Then, all CDRs were masked with this adapted template, smoothed (FWHM 8 mm), and masked again. This was done to restrict the statistical analysis to the cortical gray matter, thereby keeping the search volume small and constrained to a physiologically plausible source space, while diminishing inter‐individual differences in cortical morphology. Although the individual source estimates were already confined to the cortical gray matter, one has to note that most segmentation algorithms produce spurious gray matter regions near tissue boundaries, for example, at the ventricles or the corpus callosum. These were adequately dealt with given the described procedure.
Statistical Analyses
The software package SPSS (version 16, SPSS, Chicago, USA) was used for statistical evaluations. The surface potentials were assessed by means of a repeated measures analysis of variance (ANOVA) including the factors CONDITION (go vs. stop) and REGION (frontal vs. central vs. parietal). Lower‐order effects are reported only, if the nature of higher‐order interactions allow for their interpretation. Greenhouse‐Geisser epsilon corrections were computed when appropriate. Fisher LSD tests were calculated for post hoc assessments of relevant statistics but will explicitly be mentioned only when of special interest for the interpretation.
CDRs were analyzed within the framework of the SPM5 software package (Wellcome Institute, London, UK) running on MATLAB 7.3 (The MathWorks, Natrick, USA). For all analyses using SPM5, a statistical threshold of P < 0.05 with a family‐wise‐error correction was applied. To identify the neural sources without introducing spurious effects, no analyses were done on difference waves. Rather, the full generator‐constellations for both the N200 and P300 were identified computing one‐sample t‐tests for each condition separately. Then, repeated measures ANOVAs were computed contrasting go and stop trials to identify those sources driving the differences in the surface potentials between conditions. Mean current densities of relevant regions (see Figs. 2 and 4) were extracted by computing the average activation of an anatomical area, with masks being derived from the MARINA software package (University of Giessen, Germany, http://www.bion.de). In addition, the average current density was calculated from a control region, the superior occipital area, where differences between conditions were not expected.
Figure 2.
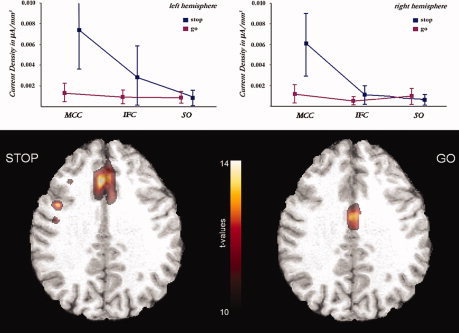
Mean current densities for regions underlying N200 generation: MCC, midcingulate cortex; IFG, inferior frontal gyrus. The superior‐occipital region (SO) was added as a control that does not (as expected) show relevant activations or differences between conditions.
Figure 4.
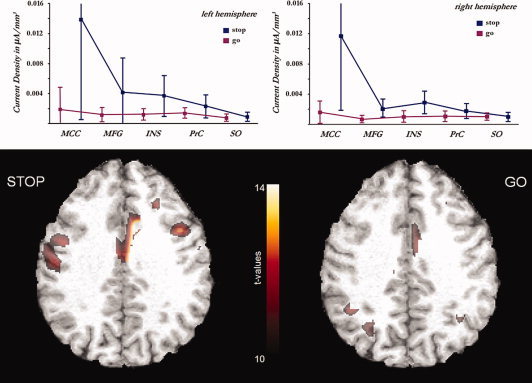
Mean current densities for regions underlying P300 generation: MCC, midcingulate cortex; MFG, middle frontal gyrus; INS, insula; PrC, precentral cortex. The superior‐occipital region (SO) was added as a control that does not (as expected) show relevant activations or differences between conditions.
RESULTS
Behavioral Data
The mean reaction time for correct go‐trials was 360.31 ms with a standard error of 11.36. Errors of omission (no response during go‐trials) did not occur on a regular basis, so that an analysis was not possible. Errors of commission (responding to Stop‐Signals) were produced in 5.21% (standard error: 1.06) of the trials in the stop condition. The mean reaction time for errors of commission was 342.33 ms (standard error: 20.53), indicating an increased error‐proneness in phases of fast responding.
Event‐Related Potentials
Assessing statistical effects for the N200 over midline electrodes, a significant interaction of CONDITION and REGION was found [F (2,42) = 40.8, P < 0.001]. More negative amplitudes occurred with stop‐ when compared with go‐trials. This difference was most pronounced over the central region (electrode 1 ≈ Cz; see Fig. 1). Similarly, the P300 was strongly augmented in the stop condition. A significant interaction of CONDITION and REGION indicated topographical differences associated with stop‐ and go‐related scalp potentials [F (2,42) = 43.58, P < 0.001]. As with the N200, the effect was more pronounced over the central than over the frontal or parietal regions. Figure 1 depicts the ERPs and their topographies for the go and the stop condition.
Figure 1.
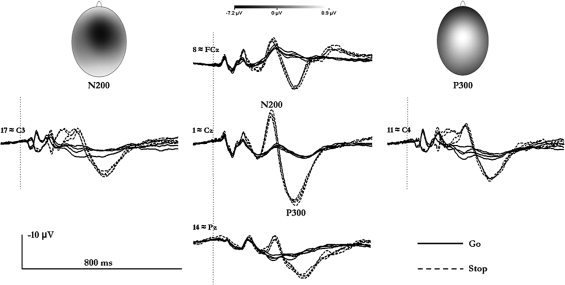
Event‐related potentials at some standard electrode positions along with scalp topographies of the N200 and P300. The four stimulation‐response‐side combinations are grouped according to go and stop conditions; a further differentiation due to stimulus‐response side combinations is disregarded. Lateralized effects prior to the N200 merely stem from the necessarily unilateral tactile stimulation. Shown as well are the topographies of the absolute N200 and P300 for the stop condition (averaged across the stimulations‐response‐side combinations).
Current Density Reconstructions
N200 generation
Separate one‐sample t‐tests for both the go and stop condition revealed major generators in midcingulate and inferior frontal cortices (see Fig. 2). The midcingulate generator was located more anterior in the stop condition, while it was at the border to the posterior cingulate cortex in go‐trials. For descriptive purposes, mean current densities and their standard errors were computed by placing ROIs in accordance with the significantly activated cortical patches (see Fig. 2; here, information is also included from the superior occipital region as control). Directly contrasting the conditions using a variance‐analytic design, strongly augmented activations with stop‐ when compared with go‐trials were found in the left and right midcingulate, but not the inferior frontal region. The midcingulate cluster of differentially activated voxels reached a local maximum in the paracingulate cortex, most likely corresponding to cytoarchitectural area 32′ within the anterior MCC (aMCC; as is shown in Fig. 3a). Thus, while similar anatomical regions, especially the MCC and IFC, seem to contribute to N200 generation in both conditions, our results indicate that an anterior midcingulate source is the major origin of differences between conditions in scalp amplitudes. Table II lists the locations of maximal stop‐related effects in Talairach coordinates.
Figure 3.
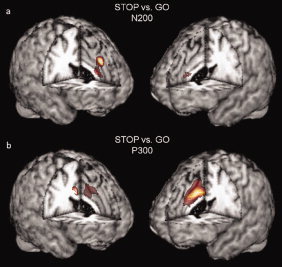
Depicted are the global maxima for the N200 (a) and P300 (b) source estimates which predominantly drive the differences between the go‐ and stop‐related ERPs. The N200‐related differences originate from left dorsal midcingulate cortex (left anterior MCC), whereas P300‐related differences stem from the right caudo‐ventral midcingulate cortex (right posterior MCC).
Table II.
Positions of maximally activated voxels for reconstructed sources; coordinates are given in Talairach space
| Region | Hemisphere | X | Y | Z |
|---|---|---|---|---|
| N200 | ||||
| Midcingulate | Left/right | −4 | 26 | 30 |
| Inferior frontal | Left | −44 | 6 | 28 |
| P300 | ||||
| Midcingulate | Right/left | 8 | 10 | 30 |
| Precentrala | Left | −26 | 2 | 54 |
| Right | 26 | 2 | 54 | |
| Middle frontal | Left | −18 | −8 | 61 |
| Right | 26 | 4 | 50 | |
| Insula | Left | −38 | −26 | 16 |
| Right | 36 | −8 | 14 | |
Although the peak activations were placed somewhat anterior to the precentral gyrus, the majority of significant voxels clearly covered the precentral region.
P300 generation
The one‐sample t‐test for the stop condition revealed a bihemispheric network of local maxima corresponding to the following regions: midcingulate cortices, middle frontal gyri (MFG), precentral cortices, and bilateral insulae. With respect to the go condition, effects were less pronounced and revealed a clear maximum in the right midcingulate region only. In addition, some activation survived statistical thresholding in the parieto‐occipital region. Again, mean current densities and standard errors for corresponding ROIs were computed and the superior occipital area was included as a control region (see Fig. 4). The contrast of stop‐ and go‐related activations differed maximally in the MCC. However, a different midcingulate area revealed the most pronounced effects when compared with the same contrast for the N200 (see Fig. 4). The center of the P300‐related effect was located in the right hemisphere and in a more ventral and posterior area (pMCC), likely corresponding to the proper cingulate gyrus (mainly comprising cytoarchitectural area 24′). Again, although a diversity of regions seems to contribute to P300 generation, the major differences between conditions seem to be caused by variations in the MCC (refer Table II for information concerning the locations of stop‐related effects).
DISCUSSION
This study assessed the neuroanatomical correlates of the N2/P3‐complex evoked by a tactile response inhibition task. In contrast to most prior studies, source reconstructions were performed using a rather data‐driven approach, also accounting for interindividual variability in neuroanatomy and head geometry. The major differences between the go and stop conditions for both the N200 and P300 were generated by the midcingulate region, and our data suggest a further regional differentiation. However, the absolute waveforms of both the N200 and P300 potentials are not generated by a single region, but they rather reflect the net‐effect of concurrently activated networks including the IFC and MCC.
Source reconstructions and statistical assessments for the N200 and P300 identified regions known from recent findings on a putative executive control network [e.g. Nee et al., 2007]. Concerning the N200, our data revealed that both the midcingulate and the inferior frontal regions significantly contributed to ERP generation. Therefore, our source reconstructions are in accordance with prior studies that found generators in or near the inferior frontal region and the MCC [Kok et al., 2004; Lavric et al., 2004; Nieuwenhuis et al., 2003]. Two aspects, however, are noteworthy and extend previous studies: first, the generator exhibiting the most pronounced differences between conditions was the aMCC; second, N200‐related activations in the inferior frontal region were not augmented in the right, as one might expect, but rather in the left hemisphere. This latter aspect deserves special consideration. For a long time, the prepotent interpretation for stop and nogo‐related potentials had been that inhibition (specifically motor inhibition) is the most dominant cognitive process [e.g. Falkenstein et al., 1999]. A wealth of research associates the process of inhibition with the right inferior frontal cortex (see Aron [2007] for a review). In accordance with this notion, fMRI studies on motor‐inhibition tasks regularly report activations of the right IFC. Nevertheless, these do not display the exact point of time for relevant effects. Assessing effects in a go/nogo task at around 200 ms, Lavric et al. [2004] reported a strong contribution to differences between conditions for the N200 from the inferior frontal region. This finding was not replicated in our study. However, Lavric et al. [2004] used a different task design. In their go/nogo study, nogo and go trials were presented with equal probability. This might have caused stronger accentuation of motor inhibition compared to other relevant cognitive processes like conflict‐monitoring, leading to more dominant right IFC activations in the nogo condition. In contrast, our results suggest an N200 generator in the left rather than the right inferior frontal region with both go and stop trials. Recent research suggests that homologue regions in the left hemisphere, for example, the IFC or the inferior frontal junction, are less relevant for inhibition per se, but are more concerned with the representation of the current task set [e.g. Brass et al., 2005; Derrfuss et al., 2005].
With respect to the P300, an anatomical network was detected, which has been shown to regularly act together [Nee et al., 2007]. Specifically, local maxima of activations were observed in middle frontal and precentral regions as well as bilaterally in the insula. The most dominant generator of the P300 was situated in the pMCC, with a maximum in the right hemisphere and more caudally compared to the anterior midcingulate generator of the N200. Although there were no single maxima detectable in the right or the left IFC, the middle frontal clusters covered an extended frontal area also including the inferior frontal gyri of both hemispheres. Overall, our findings with respect to the P300 are in accordance with studies using fMRI or, more recently, the integration of EEG and fMRI, which revealed the same functional network for performance monitoring [e.g. Eichele et al., 2008; Nee et al., 2007].
The results concerning the potential generators of the N200 and the P300 suggest that the global source constellations and the functional equivalents of the N200 and P300 most likely differ although some overlap in underlying networks might exist. For example, more dorsal activations are found with the P300 compared to the N200 (MFG vs. IFC), and the insulae contributed only to the P300. Precentral regions also account for P300 but not N200 generation. Although the MCC seems to be involved in both N200 and P300 formation, the results obtained here suggest a different topography of the N200 and P300 sources. The N200 data suggest a generator in the left paracingulate gyrus, probably at a position above the anterior corpus callosum, whereas the region involved in P300 generation was found more caudally corresponding to the right cingulate gyrus. This observation is in agreement with the recent neuroanatomical models of the MCC [e.g. Picard and Strick, 1996, 2001; Vogt et al., 1995, 2003]. Current views differentiate at least two subregions within the MCC. According to the nomenclature of Vogt and colleagues [2003], these major midcingulate compartments have been termed aMCC and pMCC. Such a distinction is supported by the existence of different cingulate motor areas as well as variations in the receptor architecture along the rostro‐caudal axis [e.g. Palomero‐Gallagher et al., 2009]. A caudal region (pMCC) is associated with simple motor tasks and a more rostral zone (aMCC) rather is concerned with the integration of higher cognitive functions, such as response selection or conflict monitoring (including error processing). Reviewing positron emission tomography studies on motor tasks with varying degrees of task difficulty, Picard and colleagues [2001] corroborated a regional and functional segregation of the MCC. Furthermore, data from a comparable tactile response inhibition task conducted in our laboratory provided additional evidence for a differential engagement of the MCC and its subregions to N200 and P300 generation [Huster et al., submitted]. When comparing subgroups of subjects with varying degrees of midcingulate folding, thereby manipulating the extension of the paralimbic cortex (area 32′), we found an association of structural characteristics with N200 amplitudes, but not P300 amplitudes. Our previous result is in agreement with our present observations indicating that generators for the N200 are located in the paracingulate region, whereas maximal activations with the P300 occurred in the proper cingulate gyrus (area 24′). Similar regional and hemispheric differentiations have recently been reported by other groups as well. Lütcke et al. [2009], for example, found that error‐related processing lead to bilateral activation in the MCC, whereas correct inhibitions were associated with right‐hemispheric activations only. However, it is important to note that topographical changes over time cannot easily be provided by means of fMRI, due to its poor resolution in time.
Merging the findings on global source constellations and differential foci for the N200 and P300 in the midcingulate region, our data strongly suggest a neuroanatomical and functional segregation of these potentials. Activations in the left‐inferior frontal region, likely corresponding to the inferior frontal junction, and in the aMCC were found to be associated with the N200. Importantly, the cognitive functions associated with these neuroanatomical structures suggest that the N200 reflects processes at the stage of response selection or even earlier. The P300, on the other hand, might more strongly be tied to the execution or suppression of a motor reaction. The observed neural generators in precentral and caudal cingulate motor areas (pMCC) are in clear accordance with this view. However, a satisfying interpretation is likely not that straightforward as additional foci of activations were also found in the MFC and both insulae. The MFC and the insulae have both been associated with control processes and switching between functionally connected networks, respectively [e.g. Sridharan et al., 2008]. In a recently published work, Lerner et al. [2009] also proposed an involvement of the insula in inhibitory mechanisms, such as suppression of spontaneous blinking. It should be noted that most studies indicating a contribution of the insula to control process rather find maxima in or near the anterior insula, whereas maxima with our study were situated slightly more posterior. However, the regional extension of the CDRs did include the anterior parts as well and is thus not mutually exclusive with prior findings.
Although the paradigm used here is well suited to reveal the common constellation of generators tapped with response inhibition paradigms, it is likely that the specific design and task demands will affect the relative contribution of a source to ERP generation. For example, with the current experiment, stop trials occurred at a probability of 25% with a fixed and rather short S1–S2 SOA. It is likely that an augmented stop trial probability and an adaptive SOA, hence stressing response inhibition, will cause a relative increase in right IFC engagement. Thus, although the advanced source analytic approach of this study overcomes the natural constraints associated with simple spherical‐ and dipole‐modeling, future studies have to address the impact of changes in the exact task settings.
To summarize, in this study, we computed source estimates for the N200 and P300 using recent methodological advancements. A network of neural generators of the N200 and P300 was revealed, which is in agreement with studies using other imaging approaches, for example, fMRI. However, we also observed a particularly interesting spatial segregation of midcingulate sources for ERP generation, a finding that extends our knowledge obtained from other imaging modalities. The N200 was partly generated by a left anterior region of the MCC (aMCC), whereas the P300, in contrast, was associated with the right pMCC. Overall, the P300 was generated by several sources, which have already been associated with motor functions. Our data suggest a functional dissociation of the N200 and P300 evoked potentials. Although the N200 might reflect the detection and resolution of interference or response selection at early stages, the P300, on the contrary, is probably linked to the execution of a response or its suppression.
REFERENCES
- Aron AR ( 2007): The neural basis of inhibition in cognitive control. Neuroscientist 13: 214–228. [DOI] [PubMed] [Google Scholar]
- Aron AR ( 2009): Introducing a special issue on stopping action and cognition. Neurosci Biobehav Rev 33: 611–612. [DOI] [PubMed] [Google Scholar]
- Aron AR, Fletcher PC, Bullmore ET, Sahakian BJ, Robbins TW ( 2003): Stop‐signal inhibition disrupted by damage to right inferior frontal gyrus in humans. Nat Neurosci 6: 115–116. [DOI] [PubMed] [Google Scholar]
- Bekker EM, Kenemans JL, Verbaten MN ( 2005): Source analysis of the N2 in a cued Go/NoGo task. Brain Res Cogn Brain Res 22: 221–231. [DOI] [PubMed] [Google Scholar]
- Botvinick M, Braver TS, Yeung N, Ullsperger M, Carter CS, Cohen J ( 2004): Conflict monitoring: Computational and empirical studies In: Posner MI, editor. Cognitive Neuroscience of Attention. New York: The Guilford Press; pp 91–104. [Google Scholar]
- Brass M, Derrfuss J, Forstmann B, von Cramon DY ( 2005): The role of the inferior frontal junction area in cognitive control. Trends Cogn Sci 9: 314–316. [DOI] [PubMed] [Google Scholar]
- Chevrier AD, Noseworthy MD, Schachar R ( 2007): Dissociation of response inhibition and performance monitoring in the stop signal task using event‐related fMRI. Hum Brain Mapp 28: 1347–1358. [DOI] [PMC free article] [PubMed] [Google Scholar]
- Coxon JP, Stinear CM, Byblow WD ( 2006): Intracortical inhibition during volitional inhibition of prepared action. J Neurophysiol 95: 3371–3383. [DOI] [PubMed] [Google Scholar]
- Debener S, Ullsperger M, Siegel M, Fiehler K, von Cramon DY, Engel AK ( 2005): Trial‐by‐trial coupling of concurrent electroencephalogram and functional magnetic resonance imaging identifies the dynamics of performance monitoring. J Neurosci 25: 11730–11737. [DOI] [PMC free article] [PubMed] [Google Scholar]
- Derrfuss J, Brass M, Neumann J, von Cramon DY ( 2005): Involvement of the inferior frontal junction in cognitive control: Meta‐analyses of switching and Stroop studies. Hum Brain Mapp 25: 22–34. [DOI] [PMC free article] [PubMed] [Google Scholar]
- Eagle DM, Robbins TW ( 2003): Inhibitory control in rats performing a stop‐signal reaction‐time task: Effects of lesions of the medial striatum and d‐amphetamine. Behav Neurosci 117: 1302–1317. [DOI] [PubMed] [Google Scholar]
- Eichele T, Debener S, Calhoun VD, Specht K, Engel AK, Hugdahl K, von Cramon DY, Ullsperger M ( 2008): Prediction of human errors by maladaptive changes in event‐related brain networks. Proc Natl Acad Sci USA 105: 6173–6178. [DOI] [PMC free article] [PubMed] [Google Scholar]
- Falkenstein M, Hoormann J, Hohnsbein J ( 1999): ERP components in Go/Nogo tasks and their relation to inhibition. Acta Psychol (Amst) 101: 267–291. [DOI] [PubMed] [Google Scholar]
- Fu CH, Morgan K, Suckling J, Williams SC, Andrew C, Vythelingum GN, McGuire PK ( 2002): A functional magnetic resonance imaging study of overt letter verbal fluency using a clustered acquisition sequence: Greater anterior cingulate activation with increased task demand. Neuroimage 17: 871–879. [PubMed] [Google Scholar]
- Grech R, Cassar T, Muscat J, Camilleri KP, Fabri SG, Zervakis M, Xanthopoulos P, Sakkalis V, Vanrumste B ( 2008): Review on solving the inverse problem in EEG source analysis. J Neuroeng Rehabil 5: 25. [DOI] [PMC free article] [PubMed] [Google Scholar]
- Hallez H, Vanrumste B, Grech R, Muscat J, De CW, Vergult A, D'Asseler Y, Camilleri KP, Fabri SG, Van HS, Lemahieu I ( 2007): Review on solving the forward problem in EEG source analysis. J Neuroeng Rehabil 4: 46. [DOI] [PMC free article] [PubMed] [Google Scholar]
- Hanslmayr S, Pastotter B, Bauml KH, Gruber S, Wimber M, Klimesch W ( 2008): The electrophysiological dynamics of interference during the Stroop task. J Cogn Neurosci 20: 215–225. [DOI] [PubMed] [Google Scholar]
- Huster RJ, Westerhausen R, Wittling A, Schweiger E, Wittling W: Gender differences in the functional lateralization of conflict processing and its association with midcingulate morphology. Brain and Cognition (submitted). 0000.
- Johnstone SJ, Dimoska A, Smith JL, Barry RJ, Pleffer CB, Chiswick D, Clarke AR ( 2007): The development of stop‐signal and Go/Nogo response inhibition in children aged 7–12 years: Performance and event‐related potential indices. Int J Psychophysiol 63: 25–38. [DOI] [PubMed] [Google Scholar]
- Kerns JG, Cohen JD, MacDonald AW III, Cho RY, Stenger VA, Carter CS ( 2004): Anterior cingulate conflict monitoring and adjustments in control. Science 303: 1023–1026. [DOI] [PubMed] [Google Scholar]
- Kok A, Ramautar JR, De Ruiter MB, Band GP, Ridderinkhof KR ( 2004): ERP components associated with successful and unsuccessful stopping in a stop‐signal task. Psychophysiology 41: 9–20. [DOI] [PubMed] [Google Scholar]
- Laird AR, McMillan KM, Lancaster JL, Kochunov P, Turkeltaub PE, Pardo JV, Fox PT ( 2005): A comparison of label‐based review and ALE meta‐analysis in the Stroop task. Hum Brain Mapp 25: 6–21. [DOI] [PMC free article] [PubMed] [Google Scholar]
- Lavric A, Pizzagalli DA, Forstmeier S ( 2004): When ‘go’ and ‘nogo’ are equally frequent: ERP components and cortical tomography. Eur J Neurosci 20: 2483–2488. [DOI] [PubMed] [Google Scholar]
- Lerner A, Bagic A, Hanakawa T, Boudreau EA, Pagan F, Mari Z, Bara‐Jimenez W, Aksu M, Sato S, Murphy DL, Hallett M ( 2009): Involvement of insula and cingulate cortices in control and suppression of natural urges. Cereb Cortex 19: 218–223. [DOI] [PMC free article] [PubMed] [Google Scholar]
- Lütcke H, Frahm J ( 2008): Lateralized anterior cingulate function during error processing and conflict monitoring as revealed by high‐resolution fMRI. Cereb Cortex 18: 505–518. [DOI] [PubMed] [Google Scholar]
- Matthews SC, Simmons AN, Arce E, Paulus MP ( 2005): Dissociation of inhibition from error processing using a parametric inhibitory task during functional magnetic resonance imaging. Neuroreport 16: 755–760. [DOI] [PubMed] [Google Scholar]
- Michel CM, Murray MM, Lantz G, Gonzalez S, Spinelli L, Grave dP ( 2004): EEG source imaging. Clin Neurophysiol 115: 2195–2222. [DOI] [PubMed] [Google Scholar]
- Nee DE, Wager TD, Jonides J ( 2007): Interference resolution: Insights from a meta‐analysis of neuroimaging tasks. Cogn Affect Behav Neurosci 7: 1–17. [DOI] [PubMed] [Google Scholar]
- Nieuwenhuis S, Yeung N, van den WW, Ridderinkhof KR ( 2003): Electrophysiological correlates of anterior cingulate function in a go/no‐go task: Effects of response conflict and trial type frequency. Cogn Affect Behav Neurosci 3: 17–26. [DOI] [PubMed] [Google Scholar]
- Oldfield RC ( 1971): The assessment and analysis of handedness: The Edinburgh Handedness Inventory. Neuropsychologia 9: 97–113. [DOI] [PubMed] [Google Scholar]
- Palomero‐Gallagher N, Vogt BA, Schleicher A, Mayberg H, Zilles K ( 2009): Receptor architecture of human cingulate cortex: Evaluation of the four‐region neurobiological model. Hum Brain Mapp 30: 2336–2355. [DOI] [PMC free article] [PubMed] [Google Scholar]
- Pascual‐Marqui RD ( 2002): Standardized low‐resolution brain electromagnetic tomography (sLORETA): Technical details. Methods Find Exp Clin Pharmacol 24 ( Suppl D): 5–12. [PubMed] [Google Scholar]
- Picard N, Strick PL ( 1996): Motor areas of the medial wall: A review of their location and functional activation. Cereb Cortex 6: 342–353. [DOI] [PubMed] [Google Scholar]
- Picard N, Strick PL ( 2001): Imaging the premotor areas. Curr Opin Neurobiol 11: 663–672. [DOI] [PubMed] [Google Scholar]
- Ramautar JR, Kok A, Ridderinkhof KR ( 2006): Effects of stop‐signal modality on the N2/P3 complex elicited in the stop‐signal paradigm. Biol Psychol 72: 96–109. [DOI] [PubMed] [Google Scholar]
- Rubia K, Russell T, Overmeyer S, Brammer MJ, Bullmore ET, Sharma T, Simmons A, Williams SC, Giampietro V, Andrew CM, Taylor E ( 2001): Mapping motor inhibition: Conjunctive brain activations across different versions of go/no‐go and stop tasks. Neuroimage 13: 250–261. [DOI] [PubMed] [Google Scholar]
- Smith JL, Johnstone SJ, Barry RJ ( 2007): Response priming in the Go/NoGo task: The N2 reflects neither inhibition nor conflict. Clin Neurophysiol 118: 343–355. [DOI] [PubMed] [Google Scholar]
- Sridharan D, Levitin DJ, Menon V ( 2008): A critical role for the right fronto‐insular cortex in switching between central‐executive and default‐mode networks. Proc Natl Acad Sci USA 105: 12569–12574. [DOI] [PMC free article] [PubMed] [Google Scholar]
- van den Wildenberg WP, van Boxtel GJ, van der Molen MW, Bosch DA, Speelman JD, Brunia CH ( 2006): Stimulation of the subthalamic region facilitates the selection and inhibition of motor responses in Parkinson's disease. J Cogn Neurosci 18: 626–636. [DOI] [PubMed] [Google Scholar]
- Vogt BA, Nimchinsky EA, Vogt LJ, Hof PR ( 1995): Human cingulate cortex: Surface features, flat maps, and cytoarchitecture. J Comp Neurol 359: 490–506. [DOI] [PubMed] [Google Scholar]
- Vogt BA, Berger GR, Derbyshire SW ( 2003): Structural and functional dichotomy of human midcingulate cortex. Eur J Neurosci 18: 3134–3144. [DOI] [PMC free article] [PubMed] [Google Scholar]
- Wagner M, Fuchs M, Kastner J ( 2004): Evaluation of sLORETA in the presence of noise and multiple sources. Brain Topogr 16: 277–280. [DOI] [PubMed] [Google Scholar]
- Wagner M, Fuchs M, Kastner J ( 2007): SWARM: sLORETA‐weighted accurate minimum norm inverse solutions. Int Congr Ser: 185–188. [Google Scholar]
- Zaidel E, Iacoboni M ( 2003): Poffenberger's simple reaction time paradigm for measuring interhemispheric transfer time In: Zaidel E, Iacoboni M, editors. The Parallel Brain—The Cognitive Neuroscience of the Corpus Callosum. Cambridge: MIT Press; pp 1–9. [Google Scholar]