

Abstract
In the prelingual and congenital deaf, functional reorganization is known to occur throughout brain regions normally associated with hearing. However, the anatomical correlates of these changes are not yet well understood. Here, we perform the first tensor‐based morphometric analysis of voxel‐wise volumetric differences in native signing prelingual and congenitally deaf subjects when compared with hearing controls. We obtained T1‐weighted scans for 14 native signing prelingual and congenitally deaf subjects and 16 age‐ and gender‐matched controls. We used linear and fluid registration to align each image to a common template. Using the voxel‐wise determinant of the Jacobian of the fluid deformation, significant volume increases, of up to 20%, were found in frontal lobe white matter regions including Broca's area, and adjacent regions involved in motor control and language production. A similar analysis was performed on hand‐traced corpora callosa. A strong trend for group differences was found in the area of the splenium considered to carry fibers connecting the temporal (and occipital) lobes. These anatomical differences may reflect experience‐mediated developmental differences in myelination and cortical maturation associated with prolonged monomodal sensory deprivation. Hum Brain Mapp, 2010. © 2009 Wiley‐Liss, Inc.
Keywords: deafness, brain imaging, corpus callosum, MRI, plasticity, tensor‐based morphometry
INTRODUCTION
The human brain has the ability to modify both its morphology and function to adapt to neurological damage, or to a chronic lack of input from one of the senses (Rauschecker,1997), as in the case of prelingual or congenital deafness. To help our understanding of brain plasticity in general, it is of interest to know whether morphological or specific neural differences can be detected in deaf individuals. Mapping their scope and anatomical extent may provide important data to inform models of cross‐modal reorganization.
Numerous studies have examined differences in visual processing associated with deafness. Neville and her colleagues examined functional responses from fMRI and visual evoked potentials in congenitally deaf individuals (Bavelier et al.,2000,2001; Neville,1990; Neville and Lawson,1987a; Neville et al.,1983). They found an enhanced neural response in the occipital and temporal areas in the congenitally deaf subjects during conditions of peripheral visual attention. The same research group explored several aspects of behavioral and functional visual specialization in the deaf, including motion (Armstrong et al.,2002; Bavelier et al.,2000,2001; Neville and Lawson,1987a), color (Armstrong et al.,2002), reading (Neville et al.,1982,1984) and oral and visual (sign) language (Neville and Bavelier,1998; Neville and Lawson,1987b; Neville et al.,1997,1998). So, according to these results, a wide array of cortical functions and regions in the occipital, temporal, and frontal lobes of the human brain seems to be influenced by the auditory deprivation.
Finney et al. (2001) reported visually evoked activity in the right auditory cortex of deaf individuals from fMRI, attesting to reorganization, and suggested that the hemispheric asymmetry may reflect a predisposition for motion processing in the right hemisphere. Similar results were obtained in a follow‐up paper using magnetoencephalography (MEG; Finney et al.,2003). Using fMRI, Shibata and colleagues (2001) observed activity in temporal regions that normally support auditory processing, when deaf subjects performed shape matching, mental rotation and attention to peripheral motion; the temporal cortex was also activated during speech reading (MacSweeney et al.,2001) and sign language (Fine et al.,2005; Nishimura et al.,1999; Sadato et al.,2005).
This cross‐modal plasticity, or re‐assignment of function to areas lacking normal sensory input, also extends to other senses. Brain imaging studies have shown that even in normal hearing subjects, the auditory cortex can be recruited by tactile stimulation (Schurmann et al.,2006); this effect is accompanied by enhanced tactile sensitivity in deaf individuals (Levänen and Hamdorf,2001; Levänen et al.,1998; Shibata et al.,2001).
Other studies have focused on differences in white matter fiber microstructure examined using diffusion tensor imaging (Chang et al.,2004; Nath et al.,2007). For instance, Chang et al. (2004) found a reduction in fractional anisotropy in at least one of the five regions of the auditory pathway in each of 10 deaf subjects.
One study also analyzed the cytoarchitecture of the brain in a 4‐year old deaf‐mute child (Bogolepova et al.,2002). Anomalies were found in both the gross brain structure and the cytoarchitecture of the cortical motor‐speech area of the cortex in this child.
Much work has been devoted to understanding the consequences of deafness on brain function, but few studies have analyzed the associated morphological changes. Penhune and her collaborators (2003) used voxel‐based morphometry (VBM) to evaluate structural alterations of the primary auditory cortical area, Heschl's gyrus (HG), and the planum temporale (PT) in congenitally deaf individuals. No significant differences were found between the deaf and hearing groups, suggesting either a lack of power to detect subtle abnormalities, or an absence of detectable atrophy, degeneration or neurodevelopmental abnormalities in the auditory cortices, even after complete, long‐term auditory deprivation. Even so, Emmorey et al. (2003) found significant differences in congenitally deaf individuals in the gray matter–white matter ratio in the primary auditory cortex, extending into the auditory association cortex within the superior temporal gyrus (STG). They attributed these differences to a smaller white matter volume in these areas. Both these prior studies focused on the primary auditory cortex (HG) and on the auditory association cortex (PT and STG). More recently, using VBM, Shibata (2007) found a decrease in the left STG in deaf individuals, as well as greater asymmetry in hearing versus deaf subjects in the STG.
Using a regional volumetric analysis, Kara et al. (2006) investigated corpus callosum morphometry in deaf individuals, compared to hearing controls. No statistically significant differences were detected between the two groups.
In this work, we used tensor‐based morphometry (TBM) to examine morphological differences between a set of 14 native signing prelingually or congenitally deaf but otherwise healthy individuals, and 16 matched hearing controls. An advantage of TBM and other voxel‐based mapping approaches is that they do not restrict the analysis to predetermined regions of interest, such as purely auditory structures, but can assess distributed abnormalities throughout the brain, without the need for a priori specification or manual delineation of regions of interest. Even so, because we hypothesized that there may be structural alterations in the corpus callosum at midline, we also performed a separate TBM analysis on 2D hand‐traced binary corpus callosum images from the same subjects.
TBM has been shown to be a powerful method for measuring local differences in brain volume. A few VBM studies described earlier have already examined differences between deaf and hearing individuals. However, the two analysis methods are sensitive to different quantities. While TBM focuses on volume differences, VBM is designed to pick up differences in the proportion of white or gray matter in small spherical regions around each voxel. However, these white or gray‐matter proportions can reflect differences in boundary curvature in addition to tissue content, so we preferred to use TBM and pick up purely volumetric differences. We used fluid registration, which registers boundaries with high geometric precision, and aimed to detect regional volume changes in the TBM analysis that might be missed by a VBM analysis.
Regarding the distribution and direction of the effects, we expect that the deaf subjects may exhibit subtle volumetric reductions in the lateral temporal cortices and underlying white matter bilaterally, with corresponding hypertrophy in some areas not normally associated with primary auditory processing. Because of the use of sign language, we hypothesized that Broca's speech area as well as the associated motor and language cortices may show hypertrophy, perhaps reflecting their recruitment for additional functions. Finally, Innocenti and Frost (1979) showed that the final interconnections and much of the myelinization of the corpus callosum are largely determined postnatally and were strongly influenced by environmental factors. We thus hypothesized that there may be subtle and distributed volumetric differences in cross‐modal association cortices responsible for sensory integration, although the expected direction of these effects (volumetric gain versus loss) was not clear in advance (so two‐tailed statistical testing was performed).
METHODS
Data Acquisition
Sixteen healthy volunteers and 14 deaf subjects (hearing loss >90 dB in both ears) participated in this study. We used a pure tone audiogram to assess the degree of hearing loss. We tested pure tone frequencies of 250, 500, 750, 1,000, 1,500, 2,000, 3,000, 4,000, 6,000, and 8,000 Hz. Some subjects were also tested at 125 Hz. To be included in the group, subjects had to be unable to detect any of the frequencies at a minimum of 90 dB and most were not able to do so even at 120 dB. Twelve of the subjects were congenitally deaf and two became deaf at an early age (one at 6 months, and the other at 8 months). Deaf subject ages ranged from 21 to 52 years (median age 29.5 years old, 7 men, 7 women), and control subjects were matched for age and gender (median age 24 years old, 8 men, 8 women). All subjects were right‐handed and had no history of psychiatric or neurological disorders, and the deaf subjects were native signers in LSQ. Participants gave a written informed consent prior to undergoing these experiments in accordance with the Declaration of Helsinki. The study protocol was approved by the Centre Hospitalier de l'Université de Montréal ethics committee at the Hôpital Notre‐Dame.
For each participant, a high‐resolution volumetric brain MRI scan was acquired on a Siemens 1.5 Tesla Magnetom Vision MRI scanner (Siemens Electric, Erlangen, Germany) at the Notre‐Dame Hospital (CHUM), with a gradient echo pulse sequence (MP‐RAGE). Each subject was scanned with a volumetric high‐resolution (T1‐weighted 3D) sagittally oriented MRI gradient echo sequence with TR: 1,100 ms; TE: 4.38 ms; flip angle of 15°; 256 × 256 matrix, slice thickness 1 mm and FOV: 250 mm.
Preprocessing of Data
We used the BSE software program (Brain Surface Extractor; Shattuck and Leahy,2002) and manual editing to remove extracerebral tissues from the images (scalp, meninges, and brainstem). Nine‐parameter transformations (three translations, three rotations, and three scales) were applied to linearly align the images to the ICBM‐53 brain template (International Consortium for Brain Mapping) using the ANIMAL software program (Collins et al.,1994). The corpus callosum of each subject was manually traced in the midsagittal plane using the MultiTracer program (Woods,2003), following previously published criteria with established reliability (Thompson et al.,2006). After applying radiofrequency bias field corrections to eliminate intensity drifts due to magnetic field inhomogeneities, each image volume was segmented into different tissue types (gray matter, white matter, CSF, and a background class) by classifying voxels based on their signal intensity values (Shattuck and Leahy,2002). All lobes were manually segmented on the template image.
TBM
Each linearly registered image was then nonlinearly aligned to a template (the same one for the whole dataset), based on an arbitrarily selected control subject in the standard ICBM space, using fluid registration (Christensen et al.,1996, Leporé et al.,2008b). We chose registration to a single subject rather than an average atlas template constructed from multiple subjects, as it has sharper, better resolved features, which can be beneficial for registration. In Chiang et al. (2006), we found that this method provides greater statistical power relative to using the standard mean deformation template from Kochunov et al. (2001), in which one of the control brains is adjusted using the average of the deformation fields mapping it onto all the other controls. Furthermore, in Leporé et al. (2007), we generated an average brain for TBM by minimizing the deformation tensors at each voxel from the templates to each of the controls. The results were shown to be comparable to those found from using a single control subject, and so we adopted that simpler approach here.
Computation speed was increased using a fast filter originally designed by Bro‐Nielsen and Gramkow (1996) and Gramkow and Bro‐Nielsen (1997). This solves for the deformation field by computing the Green's function of the fluid equation with sliding boundary conditions (Christensen,1994), and performing a recursive filtering operation.
In the deformation mappings deforming each subject's registered image onto the control template, the determinant of the associated Jacobian matrix J indicates local volume differences, with voxels with J > 1 and J < 1 showing respectively locally greater or lesser volumes than corresponding anatomical regions of the template.
To adjust for any effect of age and gender on the statistics, we covaried the logarithms of the determinants at each voxel with these parameters. The new adjusted morphometric statistic, J cov was found by fitting the following general linear model to the data:
where log(J) is the logarithm of the Jacobian determinant, the βi are estimated parameters, and sex and diagnosis are coded as binary dummy variables, 0 or 1, so that J cov = log(J) − β0 − β1 × age − β2 × gender. A t‐test was then performed on J cov, at each voxel, and permutation statistics (Nichols and Holmes,2001) were obtained at each voxel to assess the uncorrected significance of the changes in each of the two groups of subjects. To correct for multiple comparisons, global significance was assessed using a permutation test on the suprathreshold volume (using P = 0.05 as a threshold). Essentially, as is standard in brain mapping studies, we assessed the total volume of the brain with statistics exceeding a certain statistical threshold. Then the assignments of subjects to groups was permuted 5000 times to determine how likely it would be to find a pattern by chance with a still greater number of significant voxels than was observed in the true experiment. This probability, determined empirically on randomized null data, is the corrected significance value, P corrected. Permutation testing was used to avoid assuming a parametric distribution for the log‐transformed Jacobian statistics, which can be advantageous to avoid skew and bias in the resulting distributions (Leow et al.,2005). We also reperformed this entire analysis by removing the three scaling factors from the linear registration, in order to examine the effect of global brain scaling on the results (these are called the unscaled results).
A 2D version of this intensity‐based fluid registration algorithm was used to register the segmented and binarized images to the corpus callosum of the same control subject. The same analysis was then repeated to examine local area differences in those structures.
RESULTS
Volume Differences
Lobar volumes were computed from the local volumetric expansion factors determined in the fluid registration step. Although we expected TBM to be more sensitive to regional anatomical differences than lobar volume measures, we first performed an analysis of gray and white matter in lobar regions of interest to see if any systematic differences were apparent. Figure 1 displays the mean lobar volumes for the deaf and hearing groups. Volumes were estimated from the Jacobians determined in the fluid registration step. T‐tests were used to compare the deaf with the hearing controls. After covarying for age and gender, none of the lobes showed significantly altered overall volumes in either group, though trends were seen in the frontal and temporal lobes white matter (P = 0.073 and P = 0.065, respectively). In both cases, the lobes of the deaf subjects' brains are larger than those of the controls, but a strict Bonferroni correction for multiple testing would preclude interpreting these as trends. Thus, a more sensitive method, such as TBM, is needed to detect more localized changes.
Figure 1.
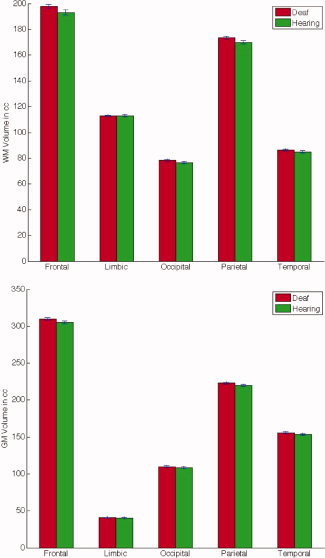
No volumetric differences are detected at the lobar level. Mean volumes of white matter (WM; top graph) and gray matter (GM; bottom graph) are shown for each lobe (in cubic centimeters) for the deaf group (red), versus the hearing controls (green). P‐values were computed on the volumes after covarying for age and gender, and none was significant. Top: white matter: from left to right: frontal lobe: P = 0.073; limbic lobe: P = 0.98; occipital lobe: P = 0.47; parietal lobe: P = 0.13; temporal lobe: P = 0.065. Bottom: gray matter: from left to right: frontal lobe: P = 0.27; limbic lobe: P = 0.75; occipital lobe: P = 0.95; parietal lobe: P = 0.20; temporal lobe: P = 0.36. [Color figure can be viewed in the online issue, which is available at www.interscience.wiley.com.]
3D Maps
In Figures 2 and 3, a voxelwise t‐test was performed for the (unscaled) regional anatomical volumes in the deaf subjects compared to those of the hearing controls, and permutation P‐values at each voxel were obtained. The scaled maps are not shown here as they were essentially the same as the unscaled ones. A list of all clusters of significant P‐values is shown in Table I. Several areas of the brain showed significant differences in deaf subjects when compared with controls. Widespread gains were observed in several subregions of the frontal lobes, including the inferior, superior, and middle frontal areas and the areas around the precentral and subcentral gyri. White matter volume in the intraparietal area was found to be greater in deaf subjects relative to controls. Finally, in the temporal lobes, some of the white matter volume surrounding the primary auditory areas was also significantly increased in both hemispheres, though the differences were more prominent in the right temporal lobe. However, we also observed a relative decrease in the HG and STG, albeit not significant, for white matter volume in both hemispheres of the deaf subjects. Broca's area was also significantly larger in the deaf. Significant increases were also found in the visual cortex, particularly on the right, perhaps reflecting compensatory mechanisms from other senses such as vision. The cerebellum was also bigger in the deaf.
Figure 2.
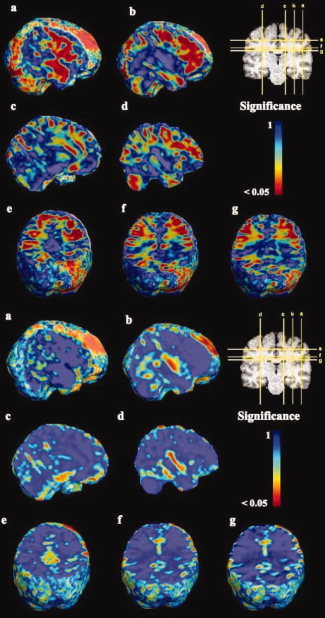
Volumetric differences between deaf and control groups. Permutation P‐values are shown, at the voxel level, from the t‐test on log10 J between deaf and hearing subjects, without brain scaling. The significance is shown on a logarithmic scale, with red regions showing voxel‐level significance at a level of P = 0.05. Top panel, a through f: map of positive effects (hypertrophy in the deaf group), with a corrected P = 0.005. Bottom panel, a through f: Map of negative effects, with a corrected P = 0.14 for a region that included the whole brain. All images are shown in the reference frame of the reader (so the left hemisphere is on the left for the reader). [Color figure can be viewed in the online issue, which is available at www.interscience.wiley.com.]
Figure 3.
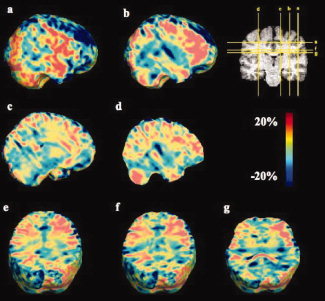
Ratio of mean regional anatomical volumes in deaf versus hearing subjects. Values in the color bar show the differences as a percentage of the normal control average volume. Clearly, there are broad regions of hypertrophy (red colors) that lie in the white matter generally, with coherent effects in the frontal lobes, but that do not affect all the tissue in any one lobe and may not therefore be detectable using conventional lobar volume analysis. [Color figure can be viewed in the online issue, which is available at www.interscience.wiley.com.]
Table I.
List of clusters of voxels with P‐values < 0.05
| Location (x, y, z) | Cluster size (voxels) | Anatomical region |
|---|---|---|
| (48 2 18) | 3,200 | Primary motor cortex/subcentral gyrus—right |
| (−42 3 25) | 240 | Primary motor cortex/subcentral gyrus—left |
| (41 14 48) | 12,000 | Precentral gyrus—right |
| (−44 −8 53) | 360 | Precentral gyrus—left |
| (39 6 −25) | 5,200 | Temporal gyrus (white matter)—right |
| (−46 6 −22) | 160 | Temporal gyrus (white matter)—left |
| (40 15 8) | 2,400 | Frontal operculum—right |
| (36 −7 48) | 7,600 | Middle frontal gyrus—right |
| (21 −8 −10) | 320 | Head of the hippocampus—right |
| (−25 −8 −10) | 160 | Head of the hippocampus—left |
| (−46 −25 40) | 280 | Primary somatosensory cortex—left |
| (−39 −44 51) | 200 | Superior temporal gyrus—left |
| (47 −7 −12) | 1,600 | Superior temporal gyrus—right |
| (−27 −68 34) | 1,600 | Intraparietal sulcus—left |
| (−55 −24 −11) | 720 | Middle temporal gyrus—left |
| (52 −23 −1) | 120 | Middle temporal gyrus—right |
| (−46 5 25) | 2,000 | Superior precentral sulcus—left |
| (44 7 24) | 720 | Superior precentral sulcus—right |
| (8 −59 −32) | 2,280 | Cerebellum |
| (−37 33 19) | 4,328 | Broca's area |
Voxels with P < 0.05 were included. Locations are in Talairach coordinates.
Corpus Callosum Maps
When corrected for multiple comparisons, none of the areas of the corpus callosum were significantly different. However, we found a strong trend in the splenium (P = 0.052 from permutations on the suprathreshold volume), where increased volumes are seen in the deaf compared to hearing controls (see Fig. 4). The volume changes detected in the genu were not statistically significant (P = 0.27).
Figure 4.
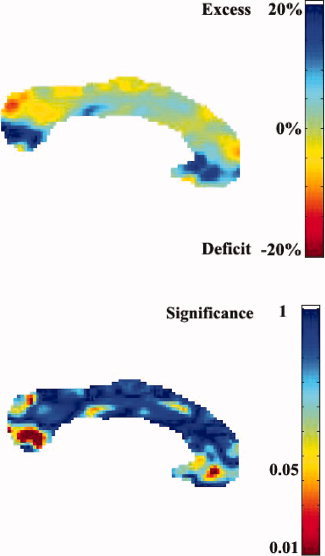
Relative differences in area (top) and associated permutation‐based P‐values, at the voxel level (bottom) for the corpus callosum of deaf versus hearing individuals. See Figures 2 and 3 for details. The red spots in the splenium and genu correspond to group differences with a 20% tissue volume excess in the deaf group. [Color figure can be viewed in the online issue, which is available at www.interscience.wiley.com.]
DISCUSSION
In this work, we mapped areas of significant morphological differences between deaf and hearing subjects, revealing a hypertrophy of white matter in diffuse nonauditory brain regions including parts of the frontal lobe. These differences reached 20% tissue excess regionally but were not detected using conventional volumetric analyses.
This study shows yet one more striking example of the brain's remarkable plasticity following sensory loss. In a related TBM study on blind individuals (Lepore et al., in press), several regions outside of the occipital regions showed significant hypertrophy. In particular, as is the case for the deaf subjects, the frontal lobes were significantly enlarged in blind subjects compared to sighted controls.
The prefrontal cortex is involved in visuomotor and perceptual functions as well as working memory (Bruce et al.,1981). Thus, increases in this area are possibly related to an increased reliance on visual working memory processes, as the deaf individuals can no longer benefit from auditory input. Romanski and collaborators (1999) have shown that both the visual and auditory modalities were represented in the frontal lobe and were organized into distinct dorsolateral, spatial and ventrolateral object‐processing regions. These afferents, one from the occipital and parietal lobe (visual) and the other from the temporal lobe (auditory), are functionally distinct but extend across modalities. In the absence of competition from auditory input in these regions, the functional visual cells may recruit auditory ones.
The intraparietal sulcus is implicated in perceptual motor coordination and visual attention. Thus, a hypothesis for future testing is that the increase in white matter in this area may be related to the greater recruitment of these sensory integration areas in deaf subjects.
Broca's area was shown to be larger in deaf subjects. This region is well known to be involved in language processing and sentence formation, which may be impaired in the deaf. FMRI (Neville et al.,1998) and Event‐Related Potentials studies (Neville et al.,1997) have shown Broca's area to be activated in American Sign Language (ASL) speakers when presented with either spoken or sign language sentences. The extensive use of sign language by deaf individuals, in addition to lip reading, may change the organization of Broca's area. We do not know the exact mechanisms underlying the processing of a visual language rather then an auditory one in Broca's area; however, our results suggest that processing a different modality implies some functional and structural modifications.
According to the Wernicke‐Geschwind model, language involves a large network comprising many cortical areas (Damasio and Geschwind,1984). Sign language is primarily analyzed by the primary visual cortex, and then the information travels to higher‐level parietal‐temporal‐occipital association cortex. Next, it is transferred to Wernicke's area, where the visual information is transformed into representation and meaning of the word, then to Broca's area for word generation and finally to the motor areas to produce the sign. So, the use of sign language in everyday life instead of a vocal one potentially affects the whole network.
Two areas of possible differences were observed in the splenium of the corpus callosum (see Fig. 4), though the results found here failed to reach significance. Pandya et al. (1971,1982), Seltzer and Pendya (1984), and Cipolloni and Pandya (1985) showed that in monkeys, the fibers that connect the auditory and visuospatial structures of the two hemispheres are located in the posterior half of the corpus callosum. Furthermore, using DTI tractography, Hofer and Frahm (2006) and Zarei et al. (2006) both showed that the affected area of the splenium is composed of fibers connecting the left and right auditory and visuospatial areas. These visuo‐spatial regions were also found to be increased in whole brain 3D maps. A larger splenium in prelingual or congenitally deaf subjects may be the result of increased myelination from compensatory plasticity effects and may reflect the increased need for the transfer of visual information in these areas.
Voxel based methods such as TBM are quite clearly needed in studies such as this one. In the ROI analysis, we observed a trend toward larger temporal lobes in the deaf, as expected from the large regions of hypertrophy seen on the TBM maps. However, these results fail to reach significance. The ROI analysis is much coarser than the TBM analysis, and the temporal lobes changes are likely averaged away in the temporal lobe analysis by considering such a large region in aggregate.
Our results are somewhat consistent with those reported in Shibata (2007), who found volume decreases in the white matter of the STG, particularly on the left. Our results do not reach significance, which may be due to the smaller sample size of our study. However, TBM found the increases in other regions that were not detected in other studies. These increases in the temporal lobes may reflect the greater recruitment of other regions for compensatory processes. Furthermore, our STG results seem rather consistent with those of Emmorey et al. (2003) and Penhune et al. (2003). They did not find any differences between the deaf and hearing groups, but did show significant gray to white matter ratio increases in the STG, which they ascribe to a reduced myelination in the auditory cortices. We did not look at the ratio, but we did find a decrease in WM in deaf subjects in that area. This decrease of volume in the deaf is in accordance with some of the results of Ptito et al. (2008) on the blind. Their work reported a significant volume decrease in the optic radiation in congenitally blind subjects. However, as cortical folds vary a lot between individuals, a minor weakness of TBM is that the fluid registration algorithm has limited success in matching cortical folds.
This study may be improved in a few ways. In particular, the HG and STG results here failed to reach significance. In Leporé et al. (2008a), we designed a new multivariate statistical method for TBM. Instead of computing statistics on the determinant of the Jacobian matrix as was done here, and therefore solely assessing volume changes, the full deformation tensors were analyzed using the log‐Euclidean formalism from Arsigny et al. (2006). Both shape and volume changes are taken into account with the multivariate approach. This method increased statistical power when compared with statistics from the volume changes alone. A future direction for this work would thus be to perform additional analysis to evaluate both shape and volume differences.
Furthermore, this study focuses solely on the neuroanatomical differences in the deaf compared to hearing subjects. However, a complete understanding of the cross‐modal reorganization seen here can only be determined by combining the results found here with functional studies of these regions.
REFERENCES
- Armstrong A, Neville HJ, Hillyard SA, Mitchell TV ( 2002): Auditory deprivation affects processing of motion, but not color. Brain Res Cog Brain Res 1: 422–434. [DOI] [PubMed] [Google Scholar]
- Arsigny V, Fillard P, Pennec X, Ayache N ( 2006): Log‐Euclidean metrics for fast and simple calculus on diffusion tensors. Mag Reson Med 56: 411–421. [DOI] [PubMed] [Google Scholar]
- Bavelier D, Tomann A, Hutton C, Mitchell T, Corina D, Liu G, Neville H ( 2000): Visual attention to the periphery is enhanced in congenitally deaf individuals. J Neurosci 20: 1–6. [DOI] [PMC free article] [PubMed] [Google Scholar]
- Bavelier D, Brozinsky C, Tomann A, Mitchell T, Neville H, Liu G ( 2001): Impact of early deafness and early exposure to sign language on the cerebral organization for motion processing. J Neurosci 21: 8931–8942. [DOI] [PMC free article] [PubMed] [Google Scholar]
- Bogolepova IN, Malofeeva LI, Belogrud TV ( 2002): [Peculiarities of the structure of the speech‐motor cortex of the brain frontal lobe in a deaf‐mute child]. Morfologiia 122: 28–31. [PubMed] [Google Scholar]
- Bro‐Nielsen M ( 1996): Medical image registration and surgery simulation, PhD Thesis, Danish Technical University, Copenhagen, Denmark.
- Bro‐Nielsen M, Gramkow C ( 1996): Fast fluid registration of medical images. Proceedings of the 4th International Conference on Visualization in Biomedical Computing, Hamburg, Germany, September 22–25. pp. 267–276.
- Bruce C, Desimone R, Gross CG ( 1981): Visual properties of neurons in a polysensory area in superior temporal sulcus of the macaque. J Neurophysiol 46: 369–384. [DOI] [PubMed] [Google Scholar]
- Chang Y, Lee SH, Lee YJ, Hwang MJ, Bae SJ, Kim MN, Lee J, Woo S, Lee H, Kang DS ( 2004): Auditory neural pathway evaluation on sensorineural hearing loss using diffusion tensor imaging. Neuroreport 15: 1699–1703. [DOI] [PubMed] [Google Scholar]
- Chiang M‐C, Dutton RA, Hayashi KM, Toga AW, Lopez OL, Aizenstein HJ, Becker JT, Thompson PM, ( 2006): Fluid registration of medical images using Jensen‐Renyi divergence reveals 3D‐profile of brain atrophy in HIV/AIDS, Proceedings of the 3rd IEEE International Symposium on Biomedical Imaging, Arlington, Virginia, USA, 6–9 April.
- Christensen GE ( 1994): Deformable shape models for anatomy. Electrical Engineering D.Sc. Dissertation, Washington University, St. Louis, Missouri.
- Christensen GE, Rabbitt RD, Miller MI ( 1996): Deformable templates using large deformation kinematics. IEEE Trans Image Process 5: 1435–1447. [DOI] [PubMed] [Google Scholar]
- Cipolloni PB, Pandya DN ( 1985): Topography and trajectories of commissural fibers of the superior temporal region in the rhesus monkey. Exp Brain Res 57: 381–389. [DOI] [PubMed] [Google Scholar]
- Collins DL, Neelin P, Peters TM, Evans AC ( 1994): Automatic 3D intersubject registration of MR volumetric data in standardized Talairach space. J Comput Assist Tomogr 18: 192–205. [PubMed] [Google Scholar]
- Damasio AR, Geschwind N ( 1984): The neural basis of language. Annu Rev Neurosci 7: 127–148. [DOI] [PubMed] [Google Scholar]
- Emmorey K, Allen JS, Bruss J, Schenker N, Damasio H ( 2003): A morphometric analysis of auditory brain regions in congenitally deaf adults. Proc Natl Acad Sci USA 100: 10049–10054. [DOI] [PMC free article] [PubMed] [Google Scholar]
- Fine I, Finney EM, Boynton GM, Dobkins KR ( 2005): Comparing the effects of auditory deprivation and sign language within the auditory and visual cortex. J Cogn Neurosci 17: 1621–1637. [DOI] [PubMed] [Google Scholar]
- Finney EM, Fine I, Dobkins KR ( 2001): Visual stimuli activate auditory cortex in the deaf. Nat Neurosci 4: 1171–1173. [DOI] [PubMed] [Google Scholar]
- Finney EM, Clementz BA, Hickok G, Dobkins KR ( 2003): Visual stimuli activate auditory cortex in deaf subjects: Evidence from MEG. Neuroreport 14: 1425–1427. [DOI] [PubMed] [Google Scholar]
- Gramkow C, Bro‐Nielsen M ( 1997): Comparison of three filters in the solution of the Navier‐Stokes equation in registration. Proceedings of the Scandinavian Conference on Image Analysis–SCIA'97, Lappeenranta, Finland, June 12–13. pp. 795–802.
- Hofer S, Frahm J ( 2006): Topography of the human corpus callosum revisited‐Comprehensive fiber tractography using diffusion tensor magnetic resonance imaging. NeuroImage 32: 989–994. [DOI] [PubMed] [Google Scholar]
- Innocenti GM, Frost DO ( 1979): Effects of visual experience on the maturation of the efferent system to the corpus callosum. Nature 200: 231–234. [DOI] [PubMed] [Google Scholar]
- Kara A, Hakan Ozturk A, Kurtoglu Z, Umit Talas D, Aktekin M, Saygili M, Kanik A ( 2006): Morphometric comparison of the human corpus callosum in deaf and hearing subjects: An MRI study. J Neuroradiol 33: 158–163. [DOI] [PubMed] [Google Scholar]
- Kochunov PK, Lancaster J, Thompson PM, Woods RP, Hardies J, Fox PT ( 2001): Regional spatial normalization: Toward an optimal target. J Comput Assist Tomogr 25: 805–816. [DOI] [PubMed] [Google Scholar]
- Leow AD, Geng A, Becker J, Davis SW, Toga AW, Thompson PM ( 2005): Inverse consistent mapping in 3D deformable image registration: Its construction and statistical properties. Proceedings of Information Processing in Medical Imaging (IPMI), Glenwood Springs, CO, USA, July 11–15. [DOI] [PubMed]
- Leporé N, Brun C, Pennec X, Chou Y‐Y, Lopez OL, Aizenstein HJ, Becker JT, Toga AW, Thompson PM ( 2007): Mean template for tensor‐based morphometry using deformation tensors. Proceedings, 10th International Conference on Medical Image Computing and Computer Assisted Intervention (MICCAI). Brisbane, Australia, Oct 29–Nov 2. [DOI] [PubMed]
- Leporé N, Brun C, Chou Y‐Y, Chiang MC, Dutton RA, Hayashi KM, Luders E, Lopez OL, Aizenstein HJ, Toga AW, Becker JT, Thompson PM ( 2008a) Generalized tensor‐based morphometry of HIV/AIDS using multivariate statistics on deformation tensors. IEEE Trans Med Imaging 27: 129–141. [DOI] [PMC free article] [PubMed] [Google Scholar]
- Leporé N, Chou Y‐Y, Lopez OL, Aizeinstein HJ, Becker JT, Toga AW, Thompson PM ( 2008b): Fast 3D fluid registration of brain magnetic resonance images. Proceedings, SPIE conference on physiology, function and structure from medical images, San Diego, CA, February 16–21. [DOI] [PMC free article] [PubMed]
- Leporé N, Voss P, Chou YY, Fortin M, Gougoux F, Lepore F, Lee AD, Brun C, Lassonde M, Madsen SK, Toga AW, Thompson PM (in press): 3D pattern of brain abnormalities in early‐ and late‐onset blind subjects visualized using tensor‐based morphometry. Neuroimage. [DOI] [PMC free article] [PubMed] [Google Scholar]
- Levänen S, Hamdorf D ( 2001): Feeling vibrations: Enhanced tactile sensitivity in congenitally deaf humans. Neurosci Lett 301: 75–77. [DOI] [PubMed] [Google Scholar]
- Levänen S, Jousmäki V, Hari R ( 1998): Vibration‐induced auditory‐cortex activation in a congenitally deaf adult. Curr Biol 8: 869–872. [DOI] [PubMed] [Google Scholar]
- MacSweeney M, Campbell R, Calvert GA, McGuire PK, David AS, Suckling J, Andrew C, Woll B, Brammer MJ ( 2001): Dispersed activation in the left temporal cortex for speech‐reading in congenitally deaf people. Proc R Soc Lond B Biol Sci 268: 451–457. [DOI] [PMC free article] [PubMed] [Google Scholar]
- Nath K, Syal R, Haris M, Goyal A, Purwar A, Rathore DK, Rathore RK, Gupta RK ( 2007): Diffusion tensor imaging of auditory neural pathway in patients with sensori‐neural hearing loss. Proc Intl Soc Mag Reson Med 15: 3513. [Google Scholar]
- Neville HJ ( 1990): Intermodal competition and compensation in development. Evidence from studies of the visual system in congenitally deaf adults. Ann NY Acad Sci 608: 71–87. [DOI] [PubMed] [Google Scholar]
- Neville HJ, Bavelier D ( 1998): Neural organization and plasticity of language. Current Opin Neurobiol 8: 254–258. [DOI] [PubMed] [Google Scholar]
- Neville HJ, Lawson D ( 1987a) Attention to central and peripheral visual space in a movement detection task: An event‐related potential and behavioral study. II. Congenitally deaf adults. Brain Res 405: 268–283. [DOI] [PubMed] [Google Scholar]
- Neville HJ, Lawson D ( 1987b) Attention to central and peripheral visual space in a movement detection task. Separate effects of auditory deprivation and acquisition of a visual language. Brain Res 405: 284–294. [DOI] [PubMed] [Google Scholar]
- Neville HJ, Kutas M, Schmidt A ( 1982): Event‐related potential studies of cerebral specialization during reading. II. Studies of congenitally deaf adults. Brain Lang 16: 316–337. [DOI] [PubMed] [Google Scholar]
- Neville HJ, Schmidt A, Kutas M ( 1983): Altered visual‐evoked potentials in congenitally deaf adults. Brain Res 266: 127–132. [DOI] [PubMed] [Google Scholar]
- Neville HJ, Kutas M, Schmidt A ( 1984): Event‐related potential studies of cerebral specialization during reading. Ann NY Acad Sci 425: 370–376. [DOI] [PubMed] [Google Scholar]
- Neville HJ, Coffee SA, Lawson DS, Fischer A, Emmorey K, Bellugi U ( 1997): Neural systems mediating American Sign Language: Effects of sensory experience and age of acquisition. Brain Lang 57: 285–308. [DOI] [PubMed] [Google Scholar]
- Neville HJ, Bavelier D, Corina D, Rauschecker J, Karni A, Lalwani A, Brun A, Clark A, Clark V, Jezzard P, Turner R ( 1998): Cerebral organization for language in deaf and hearing subjects: Biological constraints and effects of experience. Proc Natl Acad Sci USA 95: 922–929. [DOI] [PMC free article] [PubMed] [Google Scholar]
- Nichols TE, Holmes AP ( 2001): Nonparametric permutation tests for functional neuroimaging: A primer with examples. Hum Brain Mapp 15: 1–25. [DOI] [PMC free article] [PubMed] [Google Scholar]
- Nishimura H, Hashikawa K, Doi K, Iwaki T, Watanabe Y, Kusuoka H, Nishimura T, Kubo T ( 1999): Sign language “heard” in the auditory cortex. Nature 397: 116. [DOI] [PubMed] [Google Scholar]
- Pandya DN, Seltzer B ( 1982): Intrinsic connections and architectonics of posterior parietal cortex in the rhesus monkey. J Comp Neurol 228: 105–116. [DOI] [PubMed] [Google Scholar]
- Pandya DN, Karol EA, Heilbronn D ( 1971): The topographical distribution of interhemispheric projections in the corpus callosum of the rhesus monkey. Brain Res 32: 31–43. [DOI] [PubMed] [Google Scholar]
- Penhune VB, Cismaru R, Dorsaint‐Pierre R, Petitto L‐A, Zatorre RJ ( 2003): The morphometry of auditory cortex in the congenitally deaf measured using MRI. NeuroImage 20: 1215–1225. [DOI] [PubMed] [Google Scholar]
- Ptito M, Schneider FCG, Paulson OB, Kupers R ( 2008): Alterations of the visual pathways in congenital blindness. Exp Brain Res 187: 41–49. [DOI] [PubMed] [Google Scholar]
- Rauschecker JP ( 1997): Mechanism of compensatory plasticity in the cerebral cortex. Adv Neurol 73: 137–146. [PubMed] [Google Scholar]
- Romanski LM, Tian B, Fritz J, Mishkin M, Goldman‐Rakic PS, Rauschecker JP ( 1999): Dual streams of auditory afferents target multiple domains in the primate prefrontal cortex. Nat Neurosci 2: 1131–1136. [DOI] [PMC free article] [PubMed] [Google Scholar]
- Sadato N, Okada T, Honda M, Matsuki K‐I, Yoshida M, Kashikura K‐I, Takei W, Sato T, Kochiyama T, Yonekura Y ( 2005): Cross‐modal integration and plastic changes revealed by lip movement, random‐dot motion and sign languages in the hearing and deaf. Cereb Cortex 15: 1113–1122. [DOI] [PubMed] [Google Scholar]
- Schürmann M, Caetano G, Hlushchuk Y, Jousmäki V, Hari R ( 2006): Touch activates human auditory cortex. NeuroImage 30: 1325–1331. [DOI] [PubMed] [Google Scholar]
- Seltzer B, Pandya DN ( 1984): Further observation on parieto‐temporal connections in the rhesus monkey. Exp Brain Res 55: 301–312. [DOI] [PubMed] [Google Scholar]
- Shattuck DW, Leahy RM ( 2002): BrainSuite: An automated cortical surface identification tool. Med Image Anal 8: 129–141. [DOI] [PubMed] [Google Scholar]
- Shibata DK ( 2007): Differences in brain structure in deaf persons on MR imaging studied with voxel‐based morphometry. Am J Neuroradiol 28: 243–249. [PMC free article] [PubMed] [Google Scholar]
- Shibata DK, Zhong J ( 2001): Tactile vibrations are heard in auditory cortex in the deaf: Study with fMRI. Proceedings of the Annual meeting of the Radiological Society of North America (RSNA), Chicago IL, USA, Nov 25–30. p 259.
- Shibata DK, Kwok E, Zhong J, Shrier D, Numaguchi Y ( 2001): Functional MR Imaging of vision in the deaf. Acad Radiol 8: 598–604. [DOI] [PubMed] [Google Scholar]
- Thompson PM, Dutton RA, Hayashi KM, Lu A, Lee SE, Lee JY, Lopez OL, Aizenstein HJ, Toga AW, Becker JT ( 2006): 3D mapping of ventricular and corpus callosum abnormalities in HIV/AIDS. NeuroImage 31: 12–23. [DOI] [PubMed] [Google Scholar]
- Woods RP ( 2003): MultiTracer: A Java‐based tool for anatomic delineation of grayscale volumetric images. NeuroImage 19: 1829–1834. [DOI] [PubMed] [Google Scholar]
- Zarei M, Johansen‐Berg H, Smith S, Ciccarelli O, Thompson AJ, Matthews PM ( 2006): Functional anatomy of interhemispheric cortical connections in the human brain. J Anat 209: 311–320. [DOI] [PMC free article] [PubMed] [Google Scholar]