

Abstract
Previous studies on the spatio‐temporal dynamics of cortical pain processing using electroencephalography (EEG), magnetoencephalography (MEG), or intracranial recordings point towards a high degree of parallelism, e.g. parallel instead of sequential activation of primary and secondary somatosensory areas or simultaneous activation of somatosensory areas and the mid‐cingulate cortex. However, because of the inverse problem, EEG and MEG provide only limited spatial resolution and certainty about the generators of cortical pain‐induced electromagnetic activity, especially when multiple sources are simultaneously active. On the other hand, intracranial recordings are invasive and do not provide whole‐brain coverage. In this study, we thought to investigate the spatio‐temporal dynamics of cortical pain processing in 10 healthy subjects using simultaneous EEG/functional magnetic resonance imaging (fMRI). Voltages of 20 ms segments of the EEG root mean square (a global, largely reference‐free measure of event‐related EEG activity) in a time window 0–400 ms poststimulus were used to model trial‐to‐trial fluctuations in the fMRI blood oxygen level dependent (BOLD) signal. EEG‐derived regressors explained additional variance in the BOLD signal from 140 ms poststimulus onward. According to this analysis, the contralateral parietal operculum was the first cortical area to become activated upon painful laser stimulation. The activation pattern in BOLD analyses informed by subsequent EEG‐time windows suggests largely parallel signal processing in the bilateral operculo‐insular and mid‐cingulate cortices. In that regard, our data are in line with previous reports. However, the approach presented here is noninvasive and bypasses the inverse problem using only temporal information from the EEG. Hum Brain Mapp, 2010. © 2010 Wiley‐Liss, Inc.
Keywords: pain, functional magnetic resonance imaging, electroencephalography, root mean square, laser‐evoked potentials
INTRODUCTION
Aδ‐ and C‐fiber‐mediated nociceptive input to the brain activates a distributed network of cortical and subcortical areas [Apkarian et al., 2005; Tracey and Mantyh, 2007]. Key structures of this network (often referred to as the “pain matrix”) include the primary (S1) and secondary (S2) somatosensory cortices that receive input from the lateral thalamic nuclei (the “lateral pain system”) and the anterior cingulate cortex (ACC)/mid‐cingulate cortex that receives afferences from the medial thalamic nuclei (the “medial pain system”). The insula is considered part of both pain systems.
Previous studies on the spatio‐temporal dynamics of pain matrix activation have applied electroencephalography (EEG) or magnetoencephalography (MEG) source localization techniques or intracranial recordings of pain‐induced electrical brain activity. Taken together, these studies point towards a high degree of parallelism in the cortical processing of Aδ‐mediated nociceptive input. It has for instance been shown that contralateral S1 and S2 are simultaneously activated within 120–170 ms following painful laser stimulation of the hand [Ploner et al., 1999, 2009; see also Kakigi et al., 2005 for a recent review]. Furthermore, recent evidence from intracranial recordings suggest that the mid‐cingulate cortex is also activated in that early time window simultaneously with activation in sensory areas [Frot et al., 2008; Ohara et al., 2004a, b], whereas earlier studies using intracranial recordings reported ACC activation to occur later than 210 ms poststimulus following early sensory activation [Lenz et al., 1998; Rios et al., 1999]. However, there is also more recent evidence from intracranial recordings for sequential pain processing in the parietal operculum (S2) and the insula [Frot and Mauguière, 2003] with S2 activation preceding insula activation by around 50 ms. Most studies using dipole source analysis of the scalp‐recorded EEG failed to differentiate between opercular and insular sources and suggested that ACC activation is preceded by early pain processing in sensory areas [e.g. Tarkka and Treede, 1993; Valeriani et al., 1996; see also Garcia‐Larrea et al., 2003 for a recent review].
EEG and MEG are noninvasive and possess excellent temporal resolution in the range of milliseconds, but the spatial resolution and certainty of localizing brain activation is limited due to the “inverse problem.” For instance, electromagnetic source localization may fail to provide unambiguous source solutions when several sources are simultaneously active [Darvas et al., 2004; Winterer et al., 2001], whereas intracranial recordings strongly suggest that this is the case in cortical pain processing [Frot et al., 2008; Ohara et al., 2004a, b]. However, although intracranial recordings do not present the same uncertainty and are therefore considered the “gold standard” in that regard, they are invasive, reserved for small numbers of patients usually suffering from refractory epilepsy and they do not provide whole‐brain coverage.
Functional magnetic resonance imaging (fMRI) provides the opportunity to study brain activity in a noninvasive way with unprecedented spatial resolution. However, the temporal resolution is poor (> 1 s) and thus, at least one order of magnitude too low than it would be required to capture many relevant brain events in the time domain. It has now been established that it is technically possible to combine EEG and fMRI in simultaneous experiments [e.g. Huang‐Hellinger et al., 1995; Iannetti et al., 2005; Ives et al., 1993]. However, simultaneous data acquisition per se provides two distinct data sets with their inherent strength and weaknesses in the time domain (fMRI) or spatial domain (EEG). More recently, it has been shown that (single‐trial) EEG information can be used to model the fMRI blood oxygen level‐dependent (BOLD) response, thereby emphasizing certain aspects of task‐related brain activity, such as trial‐to‐trial covariation of the BOLD signal with the amplitude of evoked potentials [Benar et al., 2007; Debener et al., 2005; Mobascher et al., 2009a; Mulert et al., 2008; Warbrick et al., 2009]. For example, Eichele et al. [ 2005] showed that BOLD models informed by distinct peaks of a composite event‐related potential (ERP) can produce distinct fMRI activation maps reflecting correlations of the BOLD response with task‐related neuronal/electrical events that were only 30–150 ms apart from one another.
In this study of the cortical representation of painful laser stimulation, we sought to maximize the inferences in the temporal domain that can be made from EEG‐informed fMRI. To accomplish this, we used consecutive 20 ms segments of the root mean square (RMS) covering the time window 0–400 ms poststimulus to inform the fMRI analysis. The EEG RMS was chosen because it is a global measure of event‐related EEG activity across electrode positions that is largely independent from reference electrode selection. This way, we minimized any a priori—assumptions about spatial aspects of the scalp‐recorded EEG when using the EEG to inform the fMRI BOLD model.
It was our major objective to contribute to the clarification of the extent of parallel versus sequential stimulus processing in the pain matrix using EEG‐informed fMRI.
MATERIALS AND METHODS
Subjects
Ten healthy, right‐handed subjects (seven males) with a mean age of 32.3 years (SD: 12.7) were recruited from a larger population‐based sample. Subjects had no history of neurological or psychiatric disease and did not take any medication that could affect the experiment. All subjects had normal pain thresholds (350–500 mJ) as determined in a series of laser stimuli increasing in steps of 50 mJ from 200 to 600 mJ (and backwards) prior to the main experiment. Subjects gave written informed consent to participate in the study. The study was conducted in compliance with the declaration of Helsinki and was approved by the local ethics committee.
Paradigm
Sixty laser stimuli were applied to the dorsum of the left hand using a Thulium: YAG laser (Baasel Lasertech) with a wavelength of 2,000 nm as described previously by several groups including our own [e.g. Bingel et al., 2007; Mobascher et al., 2009a; Ploner et al., 2004]. Pulse duration was 1 ms, stimuli were spots of 6 mm in diameter. Stimulus intensity was 600 mJ. Stimuli were applied from a distance of 3 cm in a 90° angle. The site of the stimulation was manually moved after each trial to avoid tissue damage. The interval between stimuli was pseudorandomized between 8 and 12 s. Every third laser‐stimulus in the sequence was skipped to allow the hemodynamic response to return to baseline. Subjects were instructed to attend to the painful stimuli. At the end of the experiment, subjects were asked to rate verbally the perceived sensation on a numerical rating scale ranging from 0 to 100 where 0 was “no pain” and 100 “pain as bad as it could be” [Jensen and Karoly, 2001].
EEG Data Acquisition
Continuous EEG data were recorded simultaneously with MR‐image acquisition using a 32 channel MR compatible EEG system (Brain Products, Gilching, Germany). The EEG cap (BrainCap MR, EasyCap GmbH, Breitbrunn, Germany) consisted of 30 scalp electrodes distributed according to the 10–20 system and two additional electrodes, one of which was attached to the subjects' back for recording the electrocardiogram (ECG), while the other was attached on the outer canthi of the left eye for detection of ocular artifacts. Data was recorded relative to an FCz reference and a ground electrode was located at Iz [10‐5 electrode system, Oostenveld and Praamstra, 2001]. Data were sampled at 5,000 Hz, with a bandpass of 0.016–250 Hz. Impedance at all recording electrodes was less than 10 kΩ.
EEG Analysis
Raw EEG data were processed offline using BrainVision Analyzer version 1.05 (Brain Products, Gilching, Germany). Gradient artifact correction was performed using modified versions of the algorithms proposed by Allen et al. [ 2000], where a gradient artifact template is subtracted from the EEG using a baseline corrected sliding average of 20 MR‐volumes. Data were then down‐sampled to 250 Hz. Following gradient artifact correction, the data were corrected for cardioballistic artifacts. An average artefact subtraction method [Allen et al., 1998] was implemented in Brain Vision Analyzer. This method involves subtracting the artifact on a second by second basis using heartbeat events (R peaks) detected in the previous 10 s. As such, it requires accurate detection of R peaks which is aided by the employment of a moving average low‐pass filter and a finite impulse response high‐pass filter [for details, see Allen et al., 1998]. In this study, the R peaks were detected semiautomatically, with manual adjustment for peaks misidentified by the software. To average the artifact in the EEG channels, the R peaks are transferred from the ECG to the EEG over a selectable time delay. The average artifact was then subtracted from the EEG. Furthermore, infomax independent component analysis (ICA) [Bell and Sejnowski, 1995; Makeig et al., 1997] was performed on continuous EEG data. Components related to artifacts were rejected. The EEG signal was then reconstructed using inverse ICA.
Once gradient and cardioballistic artifacts had been removed, the data were segmented into 1,000 ms epochs (−200 to 800 ms). The baseline‐corrected RMS amplitudes (μV) across 30 electrode positions were calculated for a total of 20 consecutive 20 ms time windows from 0–20 ms(i=1) poststimulus to 380–400 ms(i=20) poststimulus on a single‐trial basis and subsequently used for single‐trial EEG‐informed BOLD modeling.
For each point in time (t), the root is calculated from the average of the squares of the number (N) of individual electrode values (e).
fMRI Data Acquisition
Functional MR‐images were acquired using a 3T scanner (Trio, Siemens, Erlangen, Germany). To avoid head movements, the head of each subject was tightly fixated during the scanning procedure using vacuum cushions and sponge pads. Using echo planar imaging (EPI), 350 volumes were obtained applying the following EPI parameters: 44 slices, no gap, slice thickness 3 mm, FOV 192 mm × 192 mm, matrix 64 × 64, repetition time (TR) 2,670 ms, echo time (TE) 30 ms, and flip angle 90°. To facilitate localization and co‐registration of functional data, structural scans were acquired using T1‐weighted MRI sequences (Magnetization prepared rapid gradient echo (MP‐RAGE)): TR/TE = 1,700/3.5 ms, flip angle = 9°, 208 sagittal slices, FOV 240 mm × 195 mm, matrix 320 × 260, voxel size 0.75 mm × 0.75 mm × 0.75 mm.
fMRI Analysis
fMRI‐analysis was performed with FSL (FMRIB's Software Library, http://www.fmrib.ox.ac.uk/fsl). The following preprocessing procedure was applied: Employing different modules of the FSL‐software package, we conducted motion correction using MCFLIRT [Jenkinson et al., 2002], nonbrain removal using BET [Smith, 2002], spatial smoothing using a Gaussian kernel of FWHM = 6 mm, mean‐based intensity normalization of all volumes by the same factor, and highpass temporal filtering (sigma = 30 s). Whole brain general linear model (GLM) time‐series statistical analysis of individual data sets was carried out using FILM (FMRIB's Improved Linear Model) with local autocorrelation correction [Woolrich et al., 2001]. Registration of functional images to high‐resolution structural images was done with FLIRT [Forman et al., 1995; Jenkinson et al., 2002]. For the initial standard analysis of the functional data, we used the time course of laser stimuli as the main explanatory variable (EV‐A) convolved with a Double‐Gamma hemodynamic response function. The Double‐Gamma function is a mixture of two Gamma functions—a standard positive function and a small delayed, inverted Gamma to model the late undershoot.
RMS amplitudes of 20 ms time windows from 0–20 ms to 380–400 ms poststimulus (see EEG analysis) were used as additional regressors (EV‐B1‐20), each containing quantitative information about single‐trial electrical brain activity in a specific 20 ms time window poststimulus. The time course of that second regressor was identical to that of the standard model (time course of laser stimulation). A total of 20 EEG‐informed models were applied to each individuals fMRI time series each model containing EV‐A (standard model with no EEG‐derived single‐trial information) and one of the 20 EEG‐informed EV‐Bs (EV‐B1‐20). EV‐B was always orthogonalized to EV‐A to specifically determine the variance in the data that is explained by the model containing the quantitative single‐trial EEG information but not by the standard model [Eichele et al., 2005; Mulert et al., 2008; Mobascher et al., 2009a].
Thus, EEG‐information contributed in two ways to the fMRI analysis. First, EEG single‐trial information were used to reveal trial‐to‐trial variations in the BOLD response that are not captured by EV‐A. Second, the temporal dynamics of stimulus‐induced EEG‐activity (as measured by changes in the RMS from 0 to 400 ms poststimulus) were used to model the dynamic part of brain activation with high‐temporal resolution.
Subsequently, the resulting 20 fMRI activation maps were ordered in the time domain for each individual subject.
We then conducted group level mixed effect analyses—again, one for each 20 ms time window poststimulus—using FMRIB's Local Analysis of Mixed Effects (FLAME) [Behrens et al., 2003] with spatial normalization to Montreal Neurological Institute (MNI) space. A cluster significance threshold of Z > 2.3 was applied for single subject as well as for group‐level results [Forman et al., 1995; Friston et al., 1994; Worsley et al., 1992]. For visual display of the group results, Z‐maps of the functional data were imported to MRIcron [Rorden et al., 2007].
RESULTS
Subjective Pain Ratings
Laser stimuli elicited a clear pinprick sensation in all 10 subjects. The post‐hoc average pain rating to the laser stimuli was 44.7 (SD 20.3) points out of 100.
Laser‐Evoked EEG Activity
The time course of the RMS—a global measure of event‐related EEG activity—is shown in Figure 1. For comparison with the previous literature on laser‐evoked potentials (LEPs), the time windows for the main LEP peaks N1, N2, and P2 as well as the grand average of the LEP obtained from electrode position Cz are also provided in Figure 1. The first peak had a mean amplitude of 4.04 μV (SD: 1.85 μV) and a mean latency of 176 ms (SD: 17.0 ms). It peaked between the time windows typically found for the N1 and N2 components of the LEP. The second peak had a mean amplitude of 4.97 μV (SD: 1.72 μV) and a mean latency of 305 ms (SD: 42.0 ms). This latency was in the range typically found for the LEP P2 peak.
Figure 1.
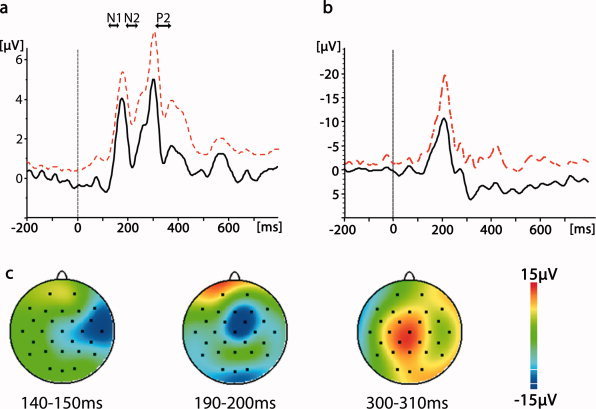
Averaged EEG response to laser stimulation. (a) RMS (root mean square) grand average. The arrows reflect the time windows typically reported for the N1, N2, and P2 peaks of the scalp‐recorded laser‐evoked potential [e.g. Kakigi et al., 2005]. Black line = grand average. Dashed red line = standard deviation. (b) Grand average of the laser‐evoked potential obtained from electrode position Cz. Black line = grand average. Dashed red line = standard deviation. (c) Field maps of three selected time windows.
Pain‐Induced BOLD Signal
Standard analysis of functional MR‐images (modeled on the basis of the time course of laser stimulation only) revealed significant stimulus‐induced BOLD responses in cortical and subcortical areas that have been identified as components of the pain matrix in numerous previous studies such as the contralateral primary somatosensory cortex (S1), bilateral secondary somatosensory cortex (S2), bilateral Insula, ACC, (pre)frontal areas, thalamus, and brainstem (see Table I and Fig. 2 for detailed information).
Table I.
Brain regions with BOLD activation in response to laser stimulation
| Anatomical regiona | MNI coordinates | Z value | ||
|---|---|---|---|---|
| x | y | z | ||
| R. postcentral gyrus (S1) | 64 | −18 | 40 | 2.51 |
| R. parietal operculum (S2) | 54 | −26 | 20 | 3.26 |
| R. insula | 40 | 12 | −10 | 3.71 |
| R. superior frontal gyrus | 6 | 22 | 52 | 4.16 |
| R. mid‐cingulate cortex | 4 | 18 | 32 | 3.86 |
| R. precentral gyrus | 8 | −18 | 48 | 4.14 |
| R. amygdala | 24 | 0 | −22 | 2.61 |
| L. parietal operculum (S2) | −56 | −38 | 24 | 3.86 |
| L. insula | −34 | 18 | −10 | 3.87 |
| L. mid‐cingulate | −2 | 14 | 24 | 3.94 |
| L. cerebellum | −4 | −62 | −44 | 3.52 |
| R. thalamus | 16 | −12 | 2 | 3.59 |
| L. thalamus | −6 | −12 | 12 | 2.94 |
| Midbrain | 0 | −28 | −10 | 3.24 |
| Brainstem | 8 | −34 | −42 | 3.52 |
According to Harvard‐Oxford structural atlas; S1, primary somatosensory cortex; S2, secondary somatosensory cortex; R, right; L, left.
Figure 2.
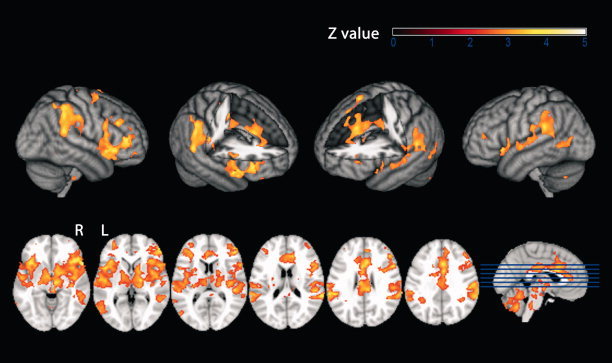
BOLD response to laser stimulation, standard model. Second‐level mixed‐effects FLAME. N = 10 subjects. Cluster‐corrected threshold Z = 2.3, P = 0.01. Upper row: surface projection. Lower row: axial slices. R = right. L = left.
Figure 3.
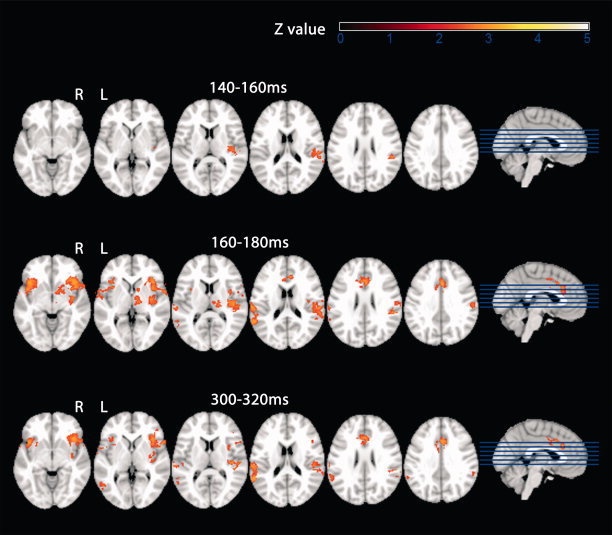
BOLD response to laser stimulation, EEG RMS‐informed model. Second‐level mixed‐effects FLAME. N = 10 subjects. Cluster‐corrected threshold Z = 2.3, P = 0.01. The additional activation that was specific for the regressor containing single‐trial EEG information is given for three EEG time windows poststimulus: from top to bottom 140−160 ms, 160−180 ms, and 300−320 ms poststimulus. R = right. L = left.
Time Course of RMS‐Informed BOLD Activation
A total of 20 segments of the RMS covering the time window 0 to 400 ms poststimulus (each 20 ms long) were used to inform the fMRI BOLD model on a trial‐to‐trial basis. Because of the orthogonalization of the EEG‐derived regressor with respect to the standard model this resulted in 20 fMRI images of group level activation, each reflecting the BOLD correlate of trial‐to‐trial fluctuations in that specific time window post stimulus that was not captured by the standard model. A movie showing the concatenated activation images 0 to 400 ms poststimulus is provided in the Supporting Information (Supp. Info. 1). An overview on the EEG‐informed dynamics of BOLD brain activation is also given in Table II. In Fig. 3 BOLD activation patterns of three selected 20 ms time windows post stimulus are shown.
Table II.
Time course of RMS‐informed BOLD activation
| Time (ms) | Z value | MNI coordinates | Anatomical regiona | ||
|---|---|---|---|---|---|
| x | y | z | |||
| 0–140 | <2.3 | − | − | − | No activation |
| 140–160 | 2.83 | 60 | −24 | 18 | R. S2 |
| 160–180 | 3.12 | 60 | −24 | 18 | R. S2 |
| 2.96 | −64 | −24 | 18 | L. S2 | |
| 3.15 | 40 | 22 | −4 | R. insulab | |
| 2.96 | −42 | 8 | −2 | L. insula | |
| 3.16 | 4 | 14 | 36 | R. MCC | |
| 2.84 | −6 | 24 | 24 | L. MCC | |
| 2.85 | 16 | −16 | 6 | R. thalamus | |
| 180–200 | 3.00 | 66 | −20 | 28 | R. S2 |
| −64 | −24 | 20 | L. S2 | ||
| 2.97 | 38 | 22 | 2 | R. insula | |
| 2.83 | −44 | 8 | −2 | L. insula | |
| 200–220 | 2.90 | 60 | −24 | 18 | R. S2 |
| 220–240 | <2.3 | No activation | |||
| 240–260 | 2.95 | 52 | −22 | 14 | R. S2 |
| 2.8 | −58 | −28 | 16 | L. S2 | |
| 3.06 | 42 | 22 | −6 | R. insula | |
| 2.64 | −34 | 10 | 6 | L. insula | |
| 260–280 | 2.96 | 66 | −20 | 28 | R. S2 |
| 2.83 | −58 | −28 | 18 | L. S2 | |
| 3.15 | 38 | 22 | −4 | R. insula | |
| 2.8 | −42 | 8 | −2 | L. insula | |
| 3.09 | 6 | 16 | 38 | R. MCC | |
| 2.81 | −4 | 14 | 38 | L. MCC | |
| 280–300 | 3.01 | 64 | −38 | 24 | R. S2 |
| 3.02 | −64 | −24 | 20 | L. S2 | |
| 3.19 | 38 | 24 | −4 | R. insula | |
| 2.77 | −42 | 8 | −2 | L. insula | |
| 3.05 | 6 | 16 | 38 | R. MCC | |
| 2.79 | −4 | 14 | 40 | L. MCC | |
| 3.03 | −8 | −18 | 6 | L. thalamus | |
| 300–320 | 2.94 | 50 | −30 | 14 | R. S2 |
| 2.94 | −64 | −26 | 18 | L. S2 | |
| 3.16 | 38 | 24 | −4 | R. insula | |
| 2.99 | −42 | 20 | −8 | L. insula | |
| 3.02 | 2 | 16 | 36 | R. MCC | |
| 320–340 | 2.68 | 36 | 14 | 4 | R. insula |
| 3 | 2 | 16 | 34 | R. MCC | |
| 340–360 | 2.91 | 52 | −22 | 14 | R. S2 |
| 2.9 | 42 | 24 | −8 | R. frontal orbital cortex | |
| 360–380 | 2.9 | 50 | −28 | 20 | R. S2 |
| 2.68 | 36 | 8 | 4 | R. insula | |
| 380–400 | 2.93 | 56 | −32 | 22 | R. S2 |
| 2.70 | −34 | 12 | 4 | L. insula | |
| 2.92 | 16 | −22 | 8 | R. thalamus | |
According to Harvard‐Oxford structural atlas; S2, secondary somatosensory cortex (parietal operculum; activation extended into supramarginal gyrus)
In both hemispheres anterior insula activation extended into frontal orbital cortex; MCC, mid‐cingulate cortex; R, right; L, left.
Consistent with no stimulus‐induced EEG activity in the first 140 ms post stimulus the RMS‐informed BOLD model did not explain additional variance in the pain matrix up to 140 ms poststimulus. The EEG‐derived regressor reflecting the time‐window 140–160 ms poststimulus explained activation in the contralateral parietal opercular cortex comprising secondary sensory cortex (S2). In the subsequent time window (160–180 ms poststimulus), BOLD activity specific to RMS single‐trial variability was found in bilateral S2, bilateral insula, and the anterior cingulate cortex (ACC)/mid‐cingulate cortex. According to this model, bilateral insula remained active until 200 ms poststimulus and bilateral S2 until 220 ms poststimulus. Consistent with a RMS minimum at 220–240 ms poststimulus no (EEG‐informed) BOLD activation was found in this time window. Insula and S2 and sensory association areas were again active in the remaining time windows 260–400ms poststimulus. A second time window of ACC/mid‐cingulate cortex activation was also found between 280 and 340 ms poststimulus. In this EEG‐informed analysis, no contralateral S1 activation was found throughout the entire time window 0–400 ms poststimulus. See Table II and Supporting Information for further details.
DISCUSSION
The main purpose of this study was to investigate the spatio‐temporal dynamics of cortical pain processing with EEG‐informed fMRI. To fully exploit the temporal resolution of EEG, we used consecutive 20 ms segments (0–400 ms post‐laser stimulation) of single‐trial event‐related responses to inform the fMRI BOLD model. At the same time, we sought to minimize any a priori assumptions about the spatial aspects of the scalp‐recorded EEG. Therefore, we used the RMS which is a global measure of event‐related EEG activity that—unlike amplitudes obtained from individual electrodes—is largely independent from reference electrode selection.
In the standard analysis of the fMRI BOLD signal, in which no EEG‐derived single‐trial variability was modeled, the expected pattern of laser‐induced activation of the pain matrix was found [Bornhövd et al., 2002; Büchel et al., 2002; Derbyshire et al., 2002; Iannetti et al., 2005; Mobascher et al., 2009b; see also Apkarian et al., 2005; Tracey and Mantyh, 2007 for recent reviews]. RMS exhibited a biphasic time course. The first peak had an average latency that was somewhat shorter than the latency typically found for the N2 peak [200–240 ms; Kakigi et al., 2005] of the LEP recorded from vertex electrodes but longer than the latency of the earlier N1 peak [140–160 ms; Garcia‐Larrea et al., 2003]. This suggests that generators of both the N1 and N2 components contributed to the first RMS peak. The second peak had an average latency compatible with that of the LEP P2 [300–360 ms, Kakigi et al., 2005].
EEG RMS‐informed BOLD modeling revealed single‐trial covariation of the fMRI BOLD and the EEG RMS signals for EEG data obtained in two time windows from 140 to 220 poststimulus and from 240 to 400 ms poststimulus. Compared to the activation pattern according to the conventional BOLD model, EEG‐informed BOLD activation was generally more restricted to known generators of LEPs, namely the secondary somatosensory cortex (S2), the insula, the ACC/mid‐cingulate cortex and to the thalamus that provides direct input to these cortical structures. This is consistent with previous studies using EEG data to inform the fMRI BOLD model that also found the EEG‐informed models to be more task/stimulus specific [e.g. Debener et al., 2005; Warbrick et al., 2009]. EEG‐RMS single‐trial information did not explain additional variance in the BOLD signal in the contralateral primary somatosensory cortex (S1). This is probably due to the fact that S1 generator activity contributes little to scalp‐recorded LEPs compared to sources in S2, the insula, and the ACC [Garcia‐Larrea et al., 2003]. Furthermore, in the conventional fMRI analysis (not informed by the EEG), contralateral S1 activation was just above threshold and substantially lower than in S2, the insula, and the ACC.
Obviously, EEG‐informed fMRI—as it was applied in our study—does not change the fundamental physical and physiological features of fMRI that restrict the temporal resolution of the method which are as follows: (a) the limited number of time points per experiment/trial and (b) with respect to the underlying neuronal activity, the delayed and blurred hemodynamic response that gives rise to the BOLD signal. Thus, the EEG‐informed fMRI activation maps do not capture neuronal events 0–400 ms poststimulus with a temporal resolution of 20 ms. They only reveal single‐trial correlations of an electrophysiological signal (reflecting neuronal activity) a few hundred milliseconds poststimulus with the BOLD response a few seconds later. Therefore, two preconditions/limitations apply. First, there must be a certain degree of single‐trial variability in the underlying neuronal activity that gives rise to the EEG and fMRI BOLD signals. This variability must be captured by EEG and fMRI. Otherwise, EEG single‐trial variability cannot explain additional variance in the BOLD signal. Second, the EEG voltage changes from trial to trial measured at different time points poststimulus (e.g. two peaks of a composite evoked potential) must differ to a certain degree for the fMRI to show generator activity in different brain areas. Otherwise, they will inform the BOLD model in a similar way and will therefore give rise to the same BOLD activation pattern.
However, some of the temporal resolution of EEG may be transferred to fMRI in this way [Eichele et al., 2005; Debener et al., 2006]. Keeping this conceptual framework in mind, one may consider the BOLD activation images(i=1–20) showing correlations with the EEG single‐trial variability in the 20 time windows from 0–20 ms(i=1) to 380–400 ms poststimulus(i = 20) as proxies for the brain activation pattern in that particular 20 ms time window.
To our knowledge, the fMRI BOLD response to painful stimuli has never been investigated with a “temporal resolution” of this kind. Therefore, the fMRI “time course” reflecting neuronal activity from 0 to 400 ms poststimulus must be discussed in the context of existing literature that used EEG and MEG source localization and foremost intracranial recordings that addressed the spatio‐temporal dynamics of brain matrix activation. The absence of BOLD activation in the EEG‐informed model in the first 140 ms poststimulus is consistent with the averaged RMS time course in our experiment that does not show meaningful stimulus‐related EEG activity up to that point. It is also consistent with the existing electrophysiological literature, at least with regard to painful stimulation of the hand [Garcia‐Larrea et al., 2003; Perchet et al., 2008].
According to our EEG‐informed BOLD analyses, activation of the pain matrix starts with contralateral S2 in the time window 140–160ms poststimulus which is also consistent with previous EEG‐, MEG, and intracortical findings [Forss et al., 2005; Frot et al., 2008; Garcia‐Larrea et al., 2003, Ohara et al., 2004a, b; Ploner et al., 2002]. When scalp‐recorded event‐related EEG potentials in response to laser stimulation (LEPs) are used to study the temporal dynamics of pain processing, the first detectable LEP is the N1 component that is often reported to peak 140–160 ms poststimulus for hand stimulation [Garcia‐Larrea et al., 2003 and references therein]. MEG [Forss et al., 2005; Ploner et al., 2002] and EEG [Tarkka and Treede, 1993; Valeriani et al., 1996] studies as well as intracranial recordings [Frot and Mauguière, 2003; Frot et al., 2008] have located the generator of this signal in the parietal‐opercular cortex (S2) contralateral to the stimulated side, which is exactly what we find in the EEG‐informed fMRI. Subsequent time frames showed activation of bilateral S2 and insula up to 200 to 220 ms poststimulus. Ipsilateral S2 has often been reported to become active within 20ms after contralateral activation [see Garcia‐Larrea et al., 2003; for a review]. Source‐localization studies have often described “operculo‐insular” generators, not further specifying the source of the potential [Garcia‐Larrea et al., 2003]. In fact, bilateral insula activation has sometimes been reported to occur concomitantly with sensory processing as early as the N1 time window [Perchet et al., 2008]. However, in a study by Frot and Mauguiere [ 2003] that used intracranial recordings the opercular response to laser stimulation preceded activation of the insula by 50 ms. Our data are in line with the notion of initial activation in contralateral S2 followed by largely parallel activation in bilateral S2 and insula that extends beyond the classical N1 time window. With regard to the EEG literature on generators of LEPs, our finding of ACC/mid‐cingulate activation as early as 160–180 poststimulus is somewhat striking. Most studies reported the ACC/mid‐cingulate source to peak 220–340ms post stimulus corresponding to the N2/P2 peaks of the LEP [Garcia‐Larrea et al., 2003]. Interestingly, using intracranial recordings directly from the mid‐cingulate cortex and SII, Frot et al. [ 2008] showed mid‐cingulate activation parallel to the earliest sensory processing in S2 119 ms poststimulus. An earlier MEG study by Ploner et al. [ 2002] also found ACC activation in response to laser stimulation as early as 188 ms poststimulus which was only 20–30 ms later than the earliest sensory response that was located in the contralateral S2. However, in this study, a more anterior portion of the ACC was found to be activated.
In the time window, 240–400 ms poststimulus, in which the EEG‐derived regressor explained additional variance in the fMRI, RMS‐informed fMRI activation was found again in ACC/mid‐cingulate cortex, insula, S2, and sensory association cortex/supramarginal gyrus. The ACC has been shown to be the major generator of the P2 component of the LEP that peaks between 250 and 380 ms poststimulus [Truini et al., 2005]. Thus, our data are in line with the emerging notion of a biphasic ACC/mid‐cingulate activation with the earlier component peaking at latencies similar to those of early sensory activation [Frot et al., 2008]. The sustained activation of the insula, S2 and sensory association cortex is somewhat harder to interpret. Operculo‐insular sources may remain active for more than 100ms beyond the N1 time window [Garcia‐Larrea et al., 2003]. But at least S2 is not considered an important generator of the scalp‐recorded P2 peak. However, in a number of recent studies that applied intracranial recordings, evoked potentials in the P2 time window induced by painful laser or electrical nerve stimulation were recorded from somatosensory cortical areas [Dowman et al., 2007; Ohara et al., 2004a, b]. In their EEG study, Perchet et al. [ 2008] also found source maxima of the LEP P2 peak (310–410 ms post stimulus) in the insula and even in sensory areas (S1, Brodmann area 40). One possible explanation for our results is that the EEG‐informed fMRI activation pattern in the later time window may reflect some residual more “tonic” activation in sensory areas and the insula that outlasts the actual more “phasic” peak activity but covaries with it on a trial‐to‐trial level. C‐fiber‐mediated “second” pain seems an unlikely explanation because the latencies of these late responses have been reported to be several hundred milliseconds longer [Forss et al., 2005; Ploner et al., 2002].
Mouraux and Iannetti [ 2009] recently showed that even though brief radiant laser pulses activate Aδ and C nociceptors selectively, LEPs do not reflect nociceptive‐specific neural activity. Instead, they seem to reflect multimodal and somatosensory‐specific neural activities. Furthermore, our paradigm did not include a control condition with innoxious unattended stimuli. Therefore, we provide data on the time course of cortical processing of nociceptive input to the brain but not necessarily nociceptive‐specific brain activity per se.
Taken together, our data support the notion of parallel signal processing in sensory areas of the pain matrix (the lateral pain system) and the ACC (the medial pain system) [Frot et al., 2008]. However, according to our data, contralateral S2 activation may precede activation of the ipsilateral S2 and the ACC in the range of 20 ms. Our approach has two strengths compared to EEG/MEG studies and intracranial recordings. With regard to the former, we solely used temporal information from the EEG to inform the fMRI BOLD model thereby minimizing assumptions about the spatial information contained in the EEG. With regard to the latter, EEG‐informed fMRI is a noninvasive research tool.
However, our approach of using RMS to inform the BOLD model is only one of several ways of EEG‐fMRI data fusion. Other approaches that have been taken include using single‐trial amplitudes from certain electrodes to inform the BOLD model, using the amplitude of individual components after ICA‐decomposition of the ERP, or parallel or joint ICA of EEG and fMRI signals [Debener et al., 2006; Eichele et al., 2009]. Although the limitations of fMRI with regard to the temporal resolution of the method apply to all these approaches, they may have their particular merits and disadvantages. On one hand, global measures of event‐related EEG activity such as RMS are intriguing as they minimize assumptions about the spatial aspects of EEG and are in that regard “unbiased”. On the other hand, many stimuli and tasks elicit wide‐spread event‐related responses that are spatially and temporally mixed [Baudena et al., 1995; Halgren et al., 1995a, b]. In the case of RMS, these sources overlapping in time are pooled into one single‐time course that is used to inform the BOLD model. Therefore, the fMRI output could in theory be less specific in the spatial domain compared to models where other measures such as individual ICs of the decomposed EEG are used. In fact, while the RMS‐informed BOLD model applied in this study explained additional variance in the BOLD signal in a wide time window poststimulus, the LEP P2 peak (defined by the amplitude of an individual component after ICA decomposition) revealed fMRI activation that was more specific for the medial pain system [Mobascher et al., 2009a].
In that regard, new strategies to fuse simultaneously acquired EEG and fMRI data like parallel ICA or joint ICA [Eichele et al., 2008, 2009; Moosmann et al., 2008], symmetrical EEG/fMRI data fusion using a Bayesian framework [Daunizeau et al., 2007] or estimation of the hemodynamic response function from the concurrent EEG‐fMRI data [de Munck et al., 2007, 2008] provide a promising avenue for future research. They allow a more symmetric, data‐driven approach to simultaneous EEG‐fMRI analysis and do not rely on specific assumptions about the spatial aspects of the EEG while at the same time potential (over‐)reduction of the EEG data is avoided.
Nonetheless, to our knowledge, this is the first study using fMRI to visualize the spatio‐temporal dynamics of pain matrix activation with a temporal resolution of 20 milliseconds.
Supporting information
Additional Supporting Information may be found in the online version of this article.
Supplementary Movie
Acknowledgements
This work was supported by an internal grant of the Research Committee of the Medical Faculty of the Heinrich‐Heine‐University (9772325). We thank Daria Orzechowski and Birgitta Sasse for technical assistance.
REFERENCES
- Allen P, Polizzi G, Krakow K, Fish DR, Lemieux L ( 1998): Identification of EEG Events in the MR scanner: The problem of pulse artifact and a method for its subtraction. NeuroImage 8: 229–239. [DOI] [PubMed] [Google Scholar]
- Allen P, Josephs O, Turner R ( 2000): A method for removing imaging artifact from continuous EEG recorded during functional MRI. NeuroImage 1: 230–239. [DOI] [PubMed] [Google Scholar]
- Apkarian AV, Bushnell MC, Treede RD, Zubieta JK ( 2005): Human brain mechanisms of pain perception and regulation in health and disease. Eur J Pain 9: 463–484. [DOI] [PubMed] [Google Scholar]
- Baudena P, Halgren E, Heit G, Clarke JM ( 1995): Intracerebral potentials to rare target and distractor auditory and visual stimuli. III. Frontal cortex. Electroencephalogr Clin Neurophysiol 94: 251–264. [DOI] [PubMed] [Google Scholar]
- Behrens T, Woolrich MW, Smith S ( 2003): Multi‐Testing Using a Fully Subject Null Hypothesis Bayesian Framework: Theory. New York: Human Brain Mapping Meeting. [Google Scholar]
- Bell AJ, Sejnowski TJ ( 1995): An information‐maximation approach to blind separation and blind deconvolution. Neural Comput 7: 1129–1159. [DOI] [PubMed] [Google Scholar]
- Benar C‐G, Schön D, Grimault S, Nazarian B, Burle B, Roth M, Badier J‐M, Marquis P, Liegeois‐Chauvel C, Anton J‐C ( 2007): Single‐trial analysis of oddball event‐related potentials in simultaneous EEG‐fMRI. Hum Bain Mapp 28: 602–613. [DOI] [PubMed] [Google Scholar]
- Bingel U, Rose M, Gläscher J, Büchel C ( 2007): fMRI reveals how pain modulates visual object processing in the ventral visual stream. Neuron 55: 157–167. [DOI] [PubMed] [Google Scholar]
- Bornhövd K, Quante M, Glauche V, Bromm B, Weiller C, Büchel C ( 2002): Painful stimuli evoke different stimulus‐response functions in the amygdala, prefrontal cortex, insula and somatosensory cortex: A single‐trial fMRI study. Brain 2002: 1326–1336. [DOI] [PubMed] [Google Scholar]
- Büchel C, Bornhövd K, Quante M, Glauche V, Bromm B, Weiller C ( 2002): Dissociable neural responses related to pain intensity, stimulus intensity, and stimulus awareness within the anterior cingulate cortex: A parametric single‐trial laser functional magnetic resonance study. J Neurosci 22: 970–976. [DOI] [PMC free article] [PubMed] [Google Scholar]
- Darvas F, Pantazis D, Kucukaltun‐Yildirim E, Leahy RM ( 2004): Mapping human brain function with MEG and EEG: Methods and validation. NeuroImage 23: S289–S299. [DOI] [PubMed] [Google Scholar]
- Daunizeau J, Grova C, Marrelec G, Mattout J, Jbabdi S, Pélégrini‐Issac M, Lina JM, Benali H ( 2007): Symmetrical event‐related EEG/fMRI information fusion in a variational Bayesian framework. Neuroimage 36: 69–87. [DOI] [PubMed] [Google Scholar]
- Debener S, Ullsperger M, Siegel M, Fiehler K, von Cramon DY, Engels AK ( 2005): Trial‐by‐trial coupling of concurrent electroencephalogram and functional magnetic resonance imaging identifies the dynamics of performance monitoring. J Neurosci 25: 11730–11737. [DOI] [PMC free article] [PubMed] [Google Scholar]
- Debener S, Ullsperger M, Siegel M, Engel AK ( 2006): Single‐trial EEG‐fMRI reveals the dynamics of cognitive function. Trends Cogn Sci 10: 558–563. [DOI] [PubMed] [Google Scholar]
- de Munck JC, Goncalves SI, Huijboom L, Kuijer JP, Pouwels PJ, Heethaar RM, Lopes da Silva FH ( 2007): The hemodynamic response of the alpha rhythm: an EEG/fMRI study. NeuroImage 35: 1142–1151. [DOI] [PubMed] [Google Scholar]
- de Munck JC, Goncalves SI, Faes TJ, Kuijer JP, Pouwels PJ, Heethaar RM, Lopes da Silva FH ( 2008): A study of the brain's resting state based on alpha band power, heart rate and fMRI. NeuroImage 42: 112–121. [DOI] [PubMed] [Google Scholar]
- Derbyshire SWG, Nichols TE, Firestone L, Townsend DW, Jones AKP ( 2002): Gender differences in patterns of cerebral activation during equal experience of painful laser stimulation. J Pain 3: 401–411. [DOI] [PubMed] [Google Scholar]
- Dowman R, Darcey T, Barkan H, Thadani V, Roberts D ( 2007): Human intracranially‐recorded cortical responses evoked by painful electrical stimulation of the sural nerve. NeuroImage 34: 743–763. [DOI] [PubMed] [Google Scholar]
- Eichele T, Specht K, Moosmann M, Jongsma ML, Quiroga RQ, Nordby H, Hugdahl K ( 2005): Assessing the spatiotemporal evolution of neuronal activation with single trial event‐related potentials and functional MRI. Proc Natl Acad Sci USA 102: 17798–17803. [DOI] [PMC free article] [PubMed] [Google Scholar]
- Eichele T, Calhoun V, Moosmann M, Specht K, Jongsma ML, Quiroga RQ, Nordby H, Hugdahl K ( 2008): Unmixing concurrent EEG‐fMRI with parallel independent component analysis. Int J Psychophysiol 67: 222–234. [DOI] [PMC free article] [PubMed] [Google Scholar]
- Eichele T, Calhoun VD, Debener S ( 2009): Mining EEG‐fMRI using independent component analysis. Int J Psychophysiol 73: 53–61. [DOI] [PMC free article] [PubMed] [Google Scholar]
- Forman SD, Cohen JD, Fitzgerald M, Eddy WF, Mintun MA, Noll DC ( 1995): Improved assessment of significant activation in functional magnetic resonance imaging (fMRI): Use of a cluster‐size threshold. Magn Reson Med 33: 636–647. [DOI] [PubMed] [Google Scholar]
- Forss N, Raji TT, Seppä M, Hari R ( 2005): Common cortical network for first and second pain. NeuroImage 24: 132–142. [DOI] [PubMed] [Google Scholar]
- Friston KJ, Worsley KJ, Frackowiak RSJ, Mazziotta JC, Evans AC ( 1994): Assessing the significance of focal activations using their spatial extent. Hum Brain Mapp 1: 214–220. [DOI] [PubMed] [Google Scholar]
- Frot M, Mauguière F ( 2003): Dual representation of pain in the operculo‐insular cortex in humans. Brain 126: 438–450. [DOI] [PubMed] [Google Scholar]
- Frot M, Mauguière F, Magnin F, Garcia‐Larrea L ( 2008): Parallel processing of nociceptive A‐δ inputs in SII and midcingulate cortex in humans. J Neurosci 28: 944–952. [DOI] [PMC free article] [PubMed] [Google Scholar]
- Garcia‐Larrea L, Frot M, Valeriani M ( 2003): Brain generators of laser‐evoked potentials: From dipoles to functional significance. Neurophysiol Clin 33: 279–292. [DOI] [PubMed] [Google Scholar]
- Halgren E, Baudena P, Clarke JM, Heit G, Liegeois C, Chauvel P, Musolino A ( 1995a): Intracerebral potentials to rare target and distractor auditory and visual stimuli. I. Superior temporal plane and parietal lobe. Electroencephalogr Clin Neurophysiol 94: 191–220. [DOI] [PubMed] [Google Scholar]
- Halgren E, Baudena P, Clarke JM, Heit G, Marinkovic K, Devaux B, Vignal JP, Biraben A ( 1995b): Intracerebral potentials to rare target and distractor auditory and visual stimuli. II. Medial, lateral and posterior temporal lobe. Electroencephalogr Clin Neurophysiol 94: 229–250. [DOI] [PubMed] [Google Scholar]
- Huang‐Hellinger FR, Breiter HC, McCormack G, Cohen MS, Kwong KK, Sutton JP, Savoy RL, Weisskoff RM, Davis TL, Baker JR, Belliveau JW, Rosen BR ( 1995): Simultaneous functional magnetic resonance imaging and electrophysiological recording. Hum Brain Mapp 3: 13–23. [Google Scholar]
- Iannetti GD, Niazy RK, Wise RG, Jezzard P, Brooks JCW, Zambreanu L, Vennart W, Matthews PM, Tracey I ( 2005): Simultaneous recording of laser‐evoked potentials and continuous, high‐field functional magnetic resonance imaging in humans. NeuroImage 28: 708–719. [DOI] [PubMed] [Google Scholar]
- Ives JR, Warach S, Schmitt F, Edelman RR, Schomer DL ( 1993): Monitoring the patient's EEG during echo planar MRI. Electroencephalogr Clin Neurophysiol 87: 417–420. [DOI] [PubMed] [Google Scholar]
- Jenkinson M, Bannister P, Brady J, Smith S ( 2002): Improved optimization for the robust and accurate linear registration and motion correction of brain images. NeuroImage 17: 825–841. [DOI] [PubMed] [Google Scholar]
- Jensen MP, Karoly P ( 2001): Self‐report scales and procedures for assessing pain in adults In: Turk DC, Melzack R, editors. Handbook of Pain Assessment, 2nd ed New York: The Guilford Press; pp 15–34. [Google Scholar]
- Kakigi R, Inui K, Tamura Y ( 2005): Electrophysiological studies on human pain perception. Clin Neurophysiol 166: 743–763. [DOI] [PubMed] [Google Scholar]
- Lenz FA, Rios M, Zirh A, Chau D, Krauss G, Lesser RP ( 1998): Painful stimuli evoke potentials recorded over the human anterior cingulate gyrus. J Neurophysiol 79: 2231–2234. [DOI] [PubMed] [Google Scholar]
- Makeig S, Bell AJ, Jung T‐P, Ghahremani D, Sejnowski TJ ( 1997): Blind separation of auditory event‐related brain responses into independent components. Proc Natl Acad Sci USA 94: 10979–10984. [DOI] [PMC free article] [PubMed] [Google Scholar]
- Mobascher A, Brinkmeyer J, Warbrick T, Musso F, Wittsack HJ, Saleh A, Schnitzler A, Winterer G ( 2009a): Laser‐evoked potential P2 single‐trial amplitudes covary with the fMRI BOLD response in the medial pain system and interconnected subcortical structures. NeuroImage 45: 917–926. [DOI] [PubMed] [Google Scholar]
- Mobascher A, Brinkmeyer J, Warbrick T, Musso F, Wittsack HJ, Stoermer R, Saleh A, Schnitzler A, Winterer G ( 2009b): Fluctuations in electrodermal activity reveal variations in single trial brain responses to painful laser stimulation—A fMRI/EEG study. NeuroImage 44: 1081–1092. [DOI] [PubMed] [Google Scholar]
- Moosmann M, Eichele T, Nordby H, Hugdahl K, Calhoun VD ( 2008): Joint independent component analysis for simultaneous EEG‐fMRI: Principle and simulation. Int J Psychophysiol 67: 212–221. [DOI] [PMC free article] [PubMed] [Google Scholar]
- Mouraux A, Iannetti GD ( 2009): Nociceptive laser‐evoked brain potentials do not reflect nociceptive‐specific neural activity. J Neurophysiol 101: 3258–3269. [DOI] [PubMed] [Google Scholar]
- Mulert C, Seifert C, Leicht G, Kirsch V, Ertl M, Karch S, Moosmann M, Lutz J, Möller HJ, Hegerl U, Pogarell O, Jäger L ( 2008): Single‐trial coupling of EEG and fMRI reveals the involvement of early anterior cingulate cortex activation in effortful decision making. NeuroImage 42: 158–168. [DOI] [PubMed] [Google Scholar]
- Ohara S, Crone NE, Weiss N, Treede RD, Lenz FA ( 2004a): Amplitudes of laser evoked potential recorded from primary somatosensory, parasylvian and medial frontal cortex are graded with stimulus intensity. Pain 110: 318–328. [DOI] [PubMed] [Google Scholar]
- Ohara S, Crone NE, Weiss N, Treede RD, Lenz FA ( 2004b): Cutaneous painful laser stimuli evoke responses recorded directly from primary somatosensory cortex in awake humans. J Neurophysiol 91: 2734–2746. [DOI] [PubMed] [Google Scholar]
- Oostenveld R, Praamstra P ( 2001): The five percent electrode system for high resolution EEG and ERP measurement. Clin Neurophysiol 112: 713–719. [DOI] [PubMed] [Google Scholar]
- Perchet C, Godinho F, Mazza S, Frot M, Legrain V, Magnin M, Garcia‐Larrea L ( 2008): Evoked potentials to nociceptive stimuli delivered by CO2 or Nd:YAP lasers. Clin Neurophysiol 119: 2615–2622. [DOI] [PubMed] [Google Scholar]
- Ploner M, Schmitz F, Freund HJ, Schnitzler A ( 1999): Parallel activation of primary and secondary somatosensory cortices in human pain processing. J Neurophysiol 81: 3100–3104. [DOI] [PubMed] [Google Scholar]
- Ploner M, Gross J, Timmermann L, Schnitzler A ( 2002): Cortical representation of first and second pain sensation in humans. Proc Natl Acad Sci USA 99: 12444–12448. [DOI] [PMC free article] [PubMed] [Google Scholar]
- Ploner M, Pollok B, Schnitzler A ( 2004): Pain facilitates tactile processing in human somatosensory cortices. J Neurophysiol 92: 1825–1829. [DOI] [PubMed] [Google Scholar]
- Ploner M, Schoffelen JM, Schnitzler A, Gross J ( 2009): Functional integration within the human pain system as revealed by Granger causality. Hum Brain Mapp 30: 4025–4032. [DOI] [PMC free article] [PubMed] [Google Scholar]
- Rios M, Treede R, Lee J, Lenz FA ( 1999): Direct evidence of nociceptive input to human anterior cingulate gyrus and parasylvian cortex. Curr Rev Pain 3: 256–264. [DOI] [PubMed] [Google Scholar]
- Rorden C, Karnath HO, Bonilha L ( 2007): Improving lesion‐symptom mapping. J Cogn Neurosci 19: 1081–1088. [DOI] [PubMed] [Google Scholar]
- Smith S ( 2002): Fast robust automated brain extraction. Hum Brain Mapp 17: 143–155. [DOI] [PMC free article] [PubMed] [Google Scholar]
- Tarkka IM, Treede RD ( 1993): Equivalent electrical source analysis of pain‐related somatosensory evoked potentials elicited by a CO2 laser. J Clin Neurophysiol 10: 513–519. [DOI] [PubMed] [Google Scholar]
- Tracey I, Mantyh PW ( 2007): The cerebral signature for pain perception and its modulation. Neuron 55: 377–391. [DOI] [PubMed] [Google Scholar]
- Truini A, Galeotti F, Romaniello A, Virtuoso M, Iannetti GD, Cruccu G ( 2005): Laser‐evoked potentials: Normative values. Clin Neurophysiol 116: 821–826. [DOI] [PubMed] [Google Scholar]
- Valeriani M, Rambaud L, Mauguiere F ( 1996): Scalp topography and dipolar source modelling of potentials evoked by CO2 laser stimulation of the hand. Electroenceph Clin Neurophysiol 100: 343–353. [DOI] [PubMed] [Google Scholar]
- Warbrick T, Mobascher A, Brinkmeyer J, Musso F, Richter N, Stoecker T, Fink GR, Shah NJ, Winterer G ( 2009): Single‐trial P3 amplitude and latency informed event‐related fMRI models yield different BOLD response patterns to a target detection task. NeuroImage 47: 1532–1544. [DOI] [PubMed] [Google Scholar]
- Winterer G, Mulert C, Mientus S, Gallinat J, Schlattmann P, Dorn H, Herrmann WM ( 2001): P300 and LORETA: Comparison of normal subjects and schizophrenic patients. Brain Topogr 13: 299–313. [DOI] [PubMed] [Google Scholar]
- Woolrich MW, Ripley BD, Brady M, Smith SM ( 2001): Temporal autocorrelation in univariate linear modelling of fMRI data. NeuroImage 14: 1370–1386. [DOI] [PubMed] [Google Scholar]
- Worsley KJ, Evans AC, Marrett S, Neelin P ( 1992): A three‐dimensional statistical analysis for CBF activation studies in human brain. J Cereb Blood Flow Metab 12: 900–918. [DOI] [PubMed] [Google Scholar]
Associated Data
This section collects any data citations, data availability statements, or supplementary materials included in this article.
Supplementary Materials
Additional Supporting Information may be found in the online version of this article.
Supplementary Movie