

Abstract
Regions of the primary motor network are known to show a high level of spontaneous functional connectivity during rest. Resting‐state functional magnetic resonance imaging (fMRI) studies have reported the left and right motor cortex to form a single resting‐state network, without examining the specific organization of the functional connections between subregions of the primary motor network. The primary motor cortex has a somatotopic organization, clearly separating regions that control our feet from regions that control our fingers and other body parts. In this study, 3 T resting‐state fMRI time‐series of 46 healthy subjects were acquired; and for all subregions along the precentral gyrus, the location of the maximum level of functional connectivity within the contralateral primary motor cortex was computed, together with whole brain functional connectivity maps, to examine a possible somatotopic organization of the functional connections of the motor network. Subregions of the primary motor cortex were found to be most strongly functionally linked to regions in the contralateral hemisphere with a similar spatial location along the contralateral primary motor cortex as the selected seed regions. On the basis of the knowledge of a somatopic organization of the primary motor network, these findings suggest that functional subregions of the motor network are one‐on‐one linked to their functional homolog in the contralateral hemisphere and organized in a somatotopic fashion. Examining the specific organization of the functional connections within the primary motor network could enhance our overall understanding of the organization of resting‐state functional communication within the brain. Hum Brain Mapp, 2010. © 2009 Wiley‐Liss, Inc.
Keywords: connectivity, fMRI, functional connectivity, homunculus, primary motor cortex, resting‐state fMRI, resting‐state connectivity, somatotopic organization
INTRODUCTION
The pioneering neuroscience work of Penfield demonstrated that the motor regions along the precentral gyrus are organized in a somatotopic fashion, clearly separating motor regions that control our feet from motor regions that control our fingers or other parts of our body [Penfield and Boldrey,1937; Penfield and Rasmussen,1968; Rasmussen,1977]. A large number of studies have shown that the specific motor subregions of the right and left hemispheres of our brain are one‐on‐one structurally interconnected by cortico‐cortical white matter pathways of the corpus callosum tract [Doron and Gazzaniga,2008; Pandya et al.,1971; Schmahmann and Pandya,2006; Wahl et al.,2007; Wakana et al.,2004]. These structural connections have been suggested to play an important role in interhemispheric communication between the primary motor regions in the coordination of skills that involve bilateral motor regions, for example complex movements that involve both our right hand and left hand [Eliassen et al.,1999,2000; Wiesendanger and Serrien2004]. Primate studies have shown that the structural connections of the motor network are organized in a somatotopic organization, and the existence of direct structural connections between left and right primary motor regions that are involved in the same motor function [Liu et al.,2002; Pandya et al.,1971; Rouiller et al.,1994]. In addition, recent combined work has shown that such a somatotopic organization of the motor callosal fibers also exists in humans, as studied with fiber tractography using diffusion tensor imaging [Wahl et al.,2007]. Interestingly, these structurally connected bilateral motor regions have also been reported to show a high level of functional connectivity during rest [Biswal et al.,1995; Beckmann et al.,2005; Cordes et al.,2000; Damoiseaux et al.,2006; Van den Heuvel et al.,2008b], suggesting that bilateral primary motor regions are not idle in the absence of performing a motor task, but rather show a vast amount of spontaneous neuronal activity that is highly synchronized between left and right hemispheric motor regions. This suggests a high level of ongoing interhemispheric communication during rest between primary motor regions [Biswal et al.,1995; Cordes et al.,2000]. Although studies have demonstrated the existence of direct structural callosal connections between the subregions of left and right primary motor cortices, the organization of the functional connections between subregions of the primary motor network remains unknown.
Functional connectivity is known as the temporal dependence of neuronal activation between anatomically separate brain regions [Aertsen et al.,1989; Friston et al.,1993] and has been extensively investigated by measuring the coherence between resting‐state functional magnetic resonance imaging (fMRI) time‐series [Biswal et al.,1995; Cordes et al.,2000; De Luca et al.,2005; Xiong et al.,1999]. Of special interest are the low frequency oscillations (<0.1 Hz) of resting‐state time‐series. These slow oscillations show a high level of coherence between multiple anatomically separate brain regions and are believed to reflect the existence of functional connections between these areas [Fox and Raichle,2007; Greicius et al.,2003]. These correlating resting‐state patterns have been consistently found between regions of well‐known functional networks, such as regions of the motor, visual, and auditory network [Beckmann et al.,2005; Damoiseaux et al.,2006; De Luca et al.,2006; Salvador et al.,2005a; Van den Heuvel et al.,2008a]. Further support for a neuronal basis of resting‐state signals comes from recent studies indicating that spontaneous fMRI signals strongly correlate with concurrent fluctuations in neuronal spiking [Nir et al.,2008; Shmuel et al.,2006; Shmuel and Leopold,2008].
The bilateral primary motor cortices have been consistently reported to show a high level of ongoing functional connectivity during rest [Beckmann et al.,2005; Calhoun et al.,2001; Damoiseaux et al.,2006; De Luca et al.,2006; van de Ven et al.,2004; Van den Heuvel et al.,2008b]. However, group resting‐state studies have mostly reported all primary motor regions to form a single resting‐state network, but the existence of specific functional connections between subregions of the motor cortex have not yet been studied. Focusing on a high detailed mapping of the interhemispheric functional connections between these subregions could provide new insight about the specificity of the functional connections within the motor network and enhance our understanding of functional communication within the primary motor network during rest.
In this study, 3‐T resting‐state fMRI time‐series of 46 healthy participants was acquired to examine the topographic arrangement of the functional connections between the left and right primary motor subregions. First, for all seed regions in the left primary motor cortex the location of their strongest functional connection within the right motor cortex was computed, as an indicator of a possible somatotopic organization of the functional connections between the subregions of the motor network. Second, for all different motor subregions, a voxel‐wise functional connectivity map (fcMap) was computed to examine whole brain functional connectivity patterns.
METHODS
Participants
Forty‐six healthy participants with no psychiatric history were included in this study (age mean/std : 27.7/9.1; gender: 26 male, 20 female, all right handed) after given written informed consent as approved by the medical ethics committee for research in humans (METC) of the University Medical Center Utrecht, The Netherlands. During the resting experiment the scanner room was darkened and participants were instructed to relax with their eyes closed and to think of nothing in particular. Participants were asked not to fall asleep during the experiment, which was verified directly afterwards. Participants who had fallen asleep or reported to be close to falling asleep were excluded from the study, resulting in the described group of 46 participants.
Data Acquisition and Preprocessing
Resting‐state fMRI time‐series were acquired on a 3 T Philips Achieva Medical scanner (Philips Medical Systems, Best, The Netherlands) at the University Medical Center Utrecht, The Netherlands. Resting‐state blood oxygenation level dependent (BOLD) signals were recorded during a period of 8 min using a fast fMRI sequence (3D‐PRESTO pulse sequence with parallel imaging [Golay et al.,2000; Neggers et al.,2008]. Acquisition parameters: TR, 21.75 ms, effective TE, 32.4 ms (using a shifted echo); SENSE p‐reduction/s‐reduction, 2/2; flip‐angle, 9°; 1,000 timeframes; FOV, 256 mm × 256 mm, voxel size 4 mm × 4 mm × 4 mm isotropic, 32 slices covering whole brain; total acquisition time per volume 0.5 s). The high temporal acquisition sampling rate was used to prevent the backfolding of higher frequencies of possible confounding cardiac (∼0.8–1.0 Hz) and respiratory (∼0.3 Hz) oscillation patterns into the lower resting‐state frequencies of interest (0.01–0.1 Hz). Directly after the functional resting‐state time‐series, an additional PRESTO scan with better anatomical contrast using an increased flip angle of 25° was acquired for coregistration purposes. In addition, a T1 weighted image was acquired for anatomical reference (3D FFE pulse sequence; acquisition parameters: TR = 9.87 ms, TE = 4.6 ms; SENSE reduction 1.7/1.4; flip‐angle, 8°; FOV, 240 mm × 240 mm; voxel size, 0.75 mm × 0.75 mm × 0.8 mm, 180 slices).
Preprocessing
All preprocessing steps were done with the SPM2 software package (http://www.fil.ion.ucl.ac.uk). Functional time‐series were corrected for small head movements by realigning all scans to the last functional scan. Registration to the last functional scan was used to maximize overlap with the high‐contrast functional scan. The functional time‐series were coregistered to the high contrast functional image, by taking the last functional scan as a source. Next, the T1 image was coregistered to the high contrast functional image, to spatially match the resting‐state fMRI time‐series. A cortical segmentation was performed on the T1 image using the Freesurfer software package (http://surfer.nmr.mgh.harvard.edu/), providing an individual cortical segmentation and automatic parcellation of each hemisphere in 34 areas, including an individual segmentation of the left and right hemispheric precentral gyrus [Fischl et al.,2004]. Normalization parameters were estimated by nonlinear registration of the T1 image to standard space, matching the T1 MNI‐152 template brain. Next, all functional scans were normalized to match standard space to enable cross‐subject comparison, by using the T1 normalization parameters. The functional images were spatially filtered with a full width half max smoothing kernel of 8 mm. Next, resting‐state time‐series were bandpass filtered with a finite impulse response bandpass filter (bandwidth 0.01–0.1 Hz). Filtering was performed to select the low resting‐state frequencies of interest (0.01–0.1 Hz) [Biswal et al.,1995; Cordes et al.,2001] and to eliminate low frequency noise (including slow scanner drifts of <0.01 Hz) and influences of higher frequencies (>0.1–1 Hz) reflecting possible cardiac or respiratory oscillations [Cordes et al.,2001]. The individual cortical segmentation maps were normalized and resliced to a 4 mm × 4 mm × 4 mm resolution to spatially overlap the resting‐state fMRI time‐series.
Correlation Analysis I: Organization of Interhemispheric Functional Motor Connections at Group Level
A somatotopic organization of the functional connections of the primary motor regions was examined by computing the topographic arrangement of the regions that showed the maximum level of functional connectivity between all left and right primary motor voxels. For each seed voxel in the left primary motor cortex, the location (i.e. voxel) with the highest level of functional connectivity within the right motor cortex was computed and averaged over the group of subjects. This was done in a three‐step analysis.
Step 1: Selection of seed voxels
From each of the individual normalized cortical segmentation maps, the voxels in the left precentral gyrus were selected from the cortical segmentation map. Individual motor cortex segmentation maps were averaged over the group of subjects. Voxels that were assigned to the primary motor anatomical map in five or more subjects were included in the group map of the primary motor cortex, resulting in a wide group map containing all seed regions (i.e. voxels) of the left primary motor cortex (>1,000 seed voxels) and the voxels of the right primary motor cortex.
Step 2: Computing seed‐based functional correlations with contralateral precentral gyrus
For each individual dataset, the resting‐state time‐series of each selected left motor seed voxel was correlated with the time‐series of all voxels in the right primary motor cortex. This was repeated for all seed voxels in the left motor cortex.
Step 3: Group analysis: Selection of location of highest functional connectivity at group level
For each individual dataset and for each seed voxel, the voxel in the right motor cortex that showed the highest level of functional connectivity (i.e. highest correlation) with the seed voxel in the left motor cortex was selected (Fig. 1a, magenta filled circle). This resulted in 46 flagged voxels in the right motor cortex for each left motor seed voxel over the group of subjects. The 46 flagged voxels indicated the individual locations that showed the strongest level of functional connectivity in the right motor cortex with the selected seed voxel in the left motor cortex (Fig. 1a unfilled circles). From these 46 voxels in the right motor cortex the average location over the group of subjects was computed (Fig. 1b, yellow +). This computed average location in the right motor cortex reflected the region that showed the strongest functional connection with the selected seed voxel in the left primary motor cortex averaged over the group of subjects.
Figure 1.

Computation of the group averaged location of the strongest functional connection in the right motor cortex of a seed region located in the left primary motor cortex. For all left motor seed regions (i.e. voxels) the location with the strongest functional connection (i.e highest correlation) was computed in all subjects. (a) Panel a illustrates for four exemplary individual subjects the location of the seed voxel indicated by the magenta filled circle and the individual locations of the individual voxels in the right motor cortex that showed the highest level of functional connectivity with this seed voxel, indicated by a colored unfilled circle. Next, these individual locations were averaged over the group of subjects (b), marking the location in the right motor cortex that showed the highest functional connection with the seed voxel averaged over the group of subjects. In addition, for each seed voxel (yellow +), a mirrored location in the right hemisphere was computed (magenta +), by mirroring the location of the seed voxel in the midline that separates the two hemispheres (dotted line). For each left‐right connectivity pair, the distance between the mirrored location in the right motor cortex of the seed and the group averaged location with the strongest functionally connection was computed, as an indication of how close the computed location was located near a region in the right motor cortex with a similar motor function as the selected seed region. This procedure was repeated for all seed voxels along the left and right motor cortex. [Color figure can be viewed in the online issue, which is available at www.interscience.wiley.com.]
This three‐step procedure resulted in a group‐wise voxel‐by‐voxel mapping of the functional connections between the primary left and right motor cortex. Every seed voxel in the left motor cortex formed a matching pair with a corresponding location (i.e. voxel) in the right motor cortex that showed over the group of subjects the strongest functional connection (i.e. highest correlation between their resting‐state time‐series).
Next, for each left‐right connectivity pair, a corresponding “mirrored location” of the selected seed voxel in the right primary motor cortex was computed, as an indicator of how the strong the left‐right functional connections would link regions with a similar motor function, for example left and right primary motor regions that respectively control our right and left hand. This mirrored location was computed by mirroring the coordinates of the left motor seed voxel in the midline plane that divides the two hemispheres (Fig. 1b, mirrored location indicated by magenta +). As the left and right motor regions follow a rather similar somatotopic mapping, the mirrored location would provide a proper estimation of a region in the contralateral right motor cortex with a similar motor function as the selected seed voxel located in the left primary motor cortex. For each of the left‐right connectivity pairs, the Euclidian distance between the mirrored seed voxel and the group‐averaged region that showed the highest level of functional connectivity was computed, as a measure of how the region with the strongest functional connection in the right motor cortex was located near the same functional region as the seed voxel in the left motor cortex (Fig. 1b). In addition, also at the individual level, the distance between the mirrored seed and the voxel that showed the highest level of functional connectivity was computed. Over all seed‐voxels, this resulted in an individual distribution of distances for each subject. To asses inter‐subject variance, these individual distributions were then averaged over the group of subjects.
In addition, to verify the interhemispheric functional connections between left and right primary motor regions, the correlation analysis (analysis I) was repeated in an exact same manner, but now for all seed voxels in the right primary motor cortex. For all voxels in the right motor cortex (>1,000 seed voxels along the right motor cortex), this resulted in the identification of the location in the left motor cortex with the strongest functional connection with the selected right motor seed voxels.
To further test the statistical significance of the left‐right connectivity pairs, a Monte Carlo simulation was performed to obtain the null‐distribution of distances that could occur under the null‐hypothesis. For each seed‐voxel, the seed‐specific null‐distribution of each left‐right connectivity pair was obtained by selecting 46 random location in the contralateral hemisphere (as if the individual left‐right connections would be completely random) and the distance between the group‐averaged location of these 46 locations and the mirrored seed was computed. This was repeated for 10,000 iterations. Next, the real data was tested against the resulting null‐distribution of random occurring distances, by assigning an overall adjusted P‐value to each found real‐data distance between the mirrored seed and the strongest functionally connected location in the contralateral hemisphere.
Correlation Analysis II: Group‐Based Voxel‐Wise Seed Connectivity Maps of Primary Motor Cortex
Analysis I provided information about the organization of the maximum level of functional connectivity between subregions of the left and right hemispheric primary motor cortices. To further examine the overall functional connectivity patterns of the primary motor regions and to provide additional information about the specificity of the functional connections, a second correlation analysis was performed in which for each seed voxel in the left motor cortex a group averaged functional connectivity map (fcMap) was computed. These fcMaps were computed in a three‐step procedure.
Step 1: Selection of seed voxels
The seed voxels in the left motor cortex were selected in a similar manner as in correlation analysis I, by averaging the individual cortical segmentation maps over the group of subjects. This resulted in a group map of the seed voxels in the left primary motor cortex. As such, the collection of seed voxels was identical to the collection of analysis I (>1,000 seed voxels).
Step 2: Computation of the seed‐based fcMaps
For each of the group selected seed voxels of the left primary motor cortex, a matching fcMap was computed by correlating the resting‐state fMRI time‐series of the selected seed voxel with all other voxels in the brain. For each individual dataset, this resulted in a collection of seed based fcMaps, showing all functional connections of the multiple subregions of the left motor cortex.
Step 3: Group analysis: Formation of group seed based fcMap
For each of the left primary motor seed voxels, the individual seed‐based fcMaps were averaged over the group of subjects. This resulted in a whole brain group fcMap for each of the seed regions (i.e. seed voxels) in the left hemispheric motor cortex.
To determine the statistical significance of the resulting seed based group fcMaps over the seed voxels and over the group of subjects, a nonparametric multiple comparisons procedure was conducted [Cordes et al.,2000] in a Monte Carlo simulation approach, holding strong control over type I errors (i.e. false positives). To compute the null statistic for the resting‐state data, the time‐series of a seed‐voxel was randomized, by randomization of the phase of its complex Fourier components, not affecting the power spectrum of the time‐series. Next, the seed specific null distribution of the correlation coefficients was computed by using a Monte Carlo (MC) simulation, in which all possible cross‐correlations between the seed time‐series after phase randomization and all other gray matter voxels were computed over a number of 10,000 MC iterations. This procedure defined a α = 0.05 threshold (corrected for multiple comparisons) of those correlations that occurred with a P < 0.05 (Bonferroni corrected). Finally, the computed individual significant thresholds were averaged over all seed voxels and over all subjects. This Monte Carlo procedure resulted in a group threshold of α = 0.05 (Bonferroni corrected) and all correlations of the group fcMap of the original seed time‐series with all other voxels in the brain map were then tested against this threshold, marking supra‐threshold seed‐voxel resting‐state fMRI correlations as significantly different from the null distribution with an α = 0.05 (Bonferroni corrected).
RESULTS
Correlation Analysis I: Organization of Interhemispheric Functional Motor Connections at Group Level
Figure 2 shows the selected seed voxels in the left hemispheric primary motor cortex (yellow boxes) and the paired location in the right motor cortex (orange boxes) that showed the highest level of functional connectivity averaged over the group of 46 subjects. The left‐right voxel pairs are displayed on an 3D rendering of the anatomical T1 image. The left panel of Figure 2a shows a coronal view of the 3D rendering, the right panel shows an axial view of the rendering. The left panel of Figure 2b shows a zoomed in version of the coronal view with the location of the seed voxels (yellow boxes) and their matching group averaged location in the right motor cortex (orange boxes) that showed the highest level of functional connectivity with the seed voxels. Figure 2 shows one on every 20 of the total number of computed connection pairs to prevent cluttering (evenly distributed over the total collection of seed regions). Each matching left‐right pair is connected by a blue connection to clearly indicate the location of the matching voxel‐pairs. In addition, the right panel of Figure 2b shows the axial view of the matching left‐right voxel pairs and the right panel. Note that the computed locations in the right motor cortex appear to be more “packed together,” i.e. tend to be clustered towards the center line of the cortex. This is likely to result from the fact that the maximum functionally connected location in the right motor cortex was computed as the average location of the maximally connected voxels over the group of 46 subjects. Individual voxel locations were restricted to be within the motor cortex and as a result the group averaged location, indicating the average location of the 46 individual locations, becomes slightly more located near the center‐line of the cortex. The left‐right connections of nine exemplary individual datasets are shown in Supporting Information Figure 1.
Figure 2.

Connectivity pairs of left motor seed regions and their group averaged functionally linked regions in the contralateral motor cortex. (a) A coronal and axial view of a 3D rendering of the anatomical scan. The dotted square marks the region shown in (b). Left and right panel of (b) show the voxel‐by‐voxel seed regions in the left motor cortex (yellow squares) and the location of the region in the right motor cortex that showed the strongest level of functional connectivity (i.e. highest correlation between their resting‐state time‐series) averaged over the group of 46 subjects (orange squares). Each matching left‐right connectivity pair is connected by a blue line. This figure shows one on every 20 left‐right pairs (evenly distributed) to prevent cluttering of the image. Supporting Information Figure 3 shows a more detailed version of one on every 10 connections. This figure clearly demonstrates that the seed regions are most strongly functionally linked to their direct functional homolog in the right motor cortex. [Color figure can be viewed in the online issue, which is available at www.interscience.wiley.com.]
Figure 3a shows the distribution of the distance between the computed location of the highest connected region and the mirrored location of the seed voxel. Figure 3a shows that the mean distance between the computed group averaged location and the mirrored location in the right motor cortex was around 13.9 mm (SD: 7.6) as indicated by the mean of the distribution. This indicated that, on average, the distance between the region in the right motor cortex that showed the strongest functional connection over the group of subjects with a specific seed region in the left motor cortex and the region that reflected the right hemispheric functional homolog of the left motor seed region (i.e. the mirrored location) was on average only 3.5 fMRI voxels. As the group distribution does not follow a Gaussian function, the modus of the distribution is likely to be a better estimation of the average distance, indicating an even shorter average distance of ∼8 mm (2–3 fMRI voxels). Furthermore, as an indication of intersubject variance, also the distance between the mirrored seed and strongest functional location at the individual level was computed. These individual distributions were then averaged, resulting in a group averaged distribution, indicating the variance over the group of subjects, depicted by Figure 3b. Interestingly, Figure 3b shows that also at the individual level the distance between the mirrored seed and strongest functionally linked location was on average relatively short, with a mean of 25.6 mm (SD: 19). As the distribution is clearly not Gaussian, the average distance is likely better described by the modus, which indicates a short distance between the mirrored seed and strongest functionally linked region of ∼12 mm (3–4 fMRI voxels), which overlaps with the short group distance as indicated by the modus of the group distribution of ∼8 mm (∼2–3 fMRI voxels) in Figure 3a.
Figure 3.
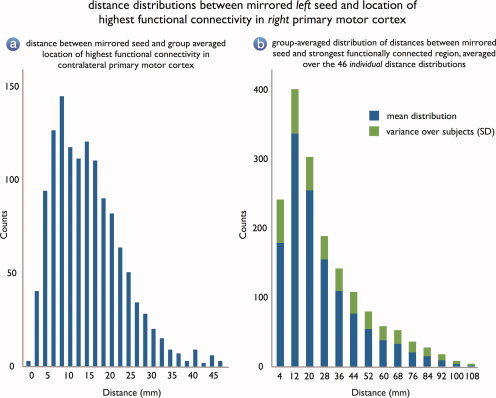
(a) The distribution of the distance between the mirrored seed locations and the group averaged location of the region in the right motor cortex that showed the highest level of functional connectivity with the left motor seed regions. The short mean distance of 13.9 mm (SD: 7.6, modus: 8 mm) indicates that on average the distance between the computed location of the seed region and the region in the right motor cortex that showed the strongest level of functional connectivity with the left motor seed was around only 3.5 fMRI voxels. (b) The group‐averaged distribution, resulting from averaging the 46 individual distance distributions. Because of more signal variance at the individual level, at the individual level the average distance is larger than compared to the average distance to the group averaged location (a), but it is still relatively short. The mean distance at the individual level was around 25.6 mm (SD: 19), but as the distributions are clearly not Gaussian, the modus may be a better estimation of the mean distance, indicating a average distance between the mirrored seed and strongest functional location of only 12 mm (∼3–4 fMRI voxels). Together, (a) and (b) suggest that the regions of the motor cortex are strongly functionally linked to their direct functional homolog in the contralateral hemisphere. [Color figure can be viewed in the online issue, which is available at www.interscience.wiley.com.]
The statistical significance of the observed left‐right connectivity pairs was examined by testing the found mirrored‐seed distances against the null‐distribution of mirrored‐seed distances, obtained using a MC simulation (see Materials and Methods, Analysis I). On basis of this null‐distribution, each left‐right connection was assigned an overall adjusted P‐value. Supporting Information Figure 2 shows the P‐values of the left‐right connectivity pairs of Figure 2. This analysis indicated that almost all connectivity pairs (>92% of all tested connectivity pairs) were below the α = 0.05 threshold. Moreover, even after applying strict Bonferroni correction to correct for multiple comparisons the majority of unique connectivity pairs (>72%) still showed a left‐right orientation that was significantly different from random [P < 0.05, Bonferroni corrected].
Furthermore, to verify the examined topology of interhemispheric left‐right connections, the functional connections of all seed voxels in the right motor cortex were also computed, in the same way as the functional connections of the left motor regions were examined. The location of the maximum functionally connected regions in the left motor cortex and their matching right hemispheric seed regions are shown in Figure 4. The right‐left connectivity pairs showed strong overlapping results with the left‐right connectivity pairs of the seed regions in the left primary motor cortex (Fig. 2).
Figure 4.

Connectivity pairs of right hemispheric motor seed regions and their matching group averaged functional connections in the left primary motor cortex. To verify the organization of the functional connections between left and right primary motor regions (see Fig. 2), the correlation analysis (analysis I) was repeated in the exact same manner, but now for all seed voxels in the right primary motor cortex. (a) A coronal (left panel) and axial view (right panel) of a 3D rendering of the anatomical scan. Dotted square marks the region shown in (b). The left and right panel of (b) show the examined seed voxels along the right primary motor cortex (yellow boxes) and their matching location in the left primary motor cortex that showed the highest level of functional connectivity averaged over the group of 46 subjects (orange boxes). Matching right‐left voxel pairs are connected by a blue connection. This figure shows one on every 20 right‐left pairs (evenly distributed). Supporting Information Figure 4 shows a more detailed version of one on every 10 connections. This figure illustrates that subregions along the right motor cortex with a distinct motor function are strongly functionally connected to their direct functional homolog in the contralateral left primary motor cortex. The right‐left matching voxel pairs show large similarity with the left‐right voxel pairs shown in Figure 2. [Color figure can be viewed in the online issue, which is available at www.interscience.wiley.com.]
Correlation Analysis II: Group‐Based Voxel‐Wise Seed Connectivity Maps of Primary Motor Cortex
A second analysis was performed in which for each seed voxel in the left motor cortex a whole brain group averaged fcMap was computed (by averaging the individual seed‐based fcMaps) completely mapping the functional connections of the primary motor cortex in high detail (i.e. voxel resolution). Figure 5 shows for nine seed regions located along key areas of the left motor homonculus their matching computed group averaged fcMap. Figure 5 shows for each of these nine seed regions their functional connections along the left and right hemispheres. For each of these nine key regions, the seed location in the left motor cortex is marked with a filled black colored circle. The location of the region in the right hemisphere that showed the highest level of functional connectivity with the seed region is marked with a black colored arrow. To test for possible functional correlation map outliers, it was tested for each seed voxel, whether the average correlation of an individual fcMap was different from the average correlation over the group of subjects by more than three standard deviations. As expected, the number of outlier situations was very low, occurring at only 0.1% of all evaluated situations (over all seed voxels and all subjects). A post‐hoc analysis indicated that removing these small number of outliers out of the group analysis had no effect on the nature of the results.
Figure 5.

Group averaged functional connectivity maps of key regions along the left primary motor cortex. Figure shows the group‐averaged fcMaps of nine seed regions located along key regions of the primary motor cortex. For each of the seed voxels in the left primary motor cortex and for each individual dataset, a matching fcMap was computed by correlating the individual resting‐state fMRI time‐series of the seed voxel with all other cortical voxels. For each seed voxel, the group‐averaged fcMap was computed by averaging the 46 individual seed‐based fcMaps. This resulted in a group fcMap for each of all seed voxels (>1,000) in the left primary motor cortex. This figure shows the fcMaps of nine key regions on an inflated 3D rendering of the group averaged T1 image (the inflated rendering was created with the freesurfer software package). For each of the nine maps, the location of the seed region is marked with a filled black circle and the location on the group‐averaged fcMap that showed the highest level of functional connectivity with the seed voxel is marked with a black arrow. Using a nonparametric multiple comparisons Monte Carlo simulation a α = 0.05 (Bonferroni corrected) statistical threshold of 0.66 was determined (see Materials and Methods section). This figure demonstrates a high level of specificity of the functional connections of the somatotopic organized motor regions.
To determine the statistical significance of the group fcMaps, a nonparametric multiple comparisons Monte Carlo procedure was used, determining the mean null distribution of the correlation coefficients over the group of subjects, strongly controlling for type I. This nonparametric multiple comparison Monte Carlo procedure determined a robust significance correlation threshold of 0.66 (SD: 0.068) with a P < 0.05 (Bonferroni corrected). Seed‐specific fcMap correlations above this threshold were significantly different from the null‐distribution and marked as statistically significant at a α = 0.05 (Bonferroni corrected).
DISCUSSION
The main finding from this study is the existence of a specific somatotopic organization of the functional connections of the primary motor cortex during resting‐state. Examination of the specific organization of the functional connections within the primary motor network by measuring the level of synchronization between the spontaneous fMRI signals of a large number of subregions of the primary motor network suggests that the spontaneous resting‐state fMRI signals of the subregions of the primary motor cortex are most strongly correlated with the time‐series of specific subregions in the contralateral motor cortex that are located near the same spatial orientation as the selected seed subregions. As the primary motor network is well known to have a somatotopic organization, these findings strongly suggest that the subregions of the primary motor cortex are one‐on‐one functionally linked to their direct functional homolog in the contralateral motor cortex. As such, our finding suggests the possible formation of functionally linked subnetworks within the motor resting‐state network.
Spontaneous brain activity was measured with 3 T resting‐state fMRI recordings in a group of 46 healthy subjects. The functional connections between all left and right primary motor regions were examined by correlating the resting‐state time‐series of all possible voxel‐pairs located in the left and right motor precentral gyrus. For all subregions of the left motor cortex (>1,000 seed voxels), the location in the right primary motor cortex with the highest level of functional connectivity was computed (analysis I) as well as matching whole‐brain functional connectivity maps (fcMaps) (analysis II). The matching left‐right connectivity pairs of analysis I are shown in Figure 2, suggesting that the functional connections between the subregions of the primary motor cortex follow a specific somatotopic organization. As the left and right hemispheric motor regions are assumed to follow a similar somatotopic mapping along the primary motor cortex, the mirrored locations of the seed regions provides proper estimation of the regions in the contralateral hemisphere with a similar motor function as the seed voxels. The short average distance of around 14 mm (∼3.5 voxels) between the mirrored seed and its group averaged functionally connected location suggests that the regions located along the precentral gyrus are strongly functionally connected to their direct functional homolog in the contralateral primary motor cortex (Fig. 3). In addition, all computed right‐left connections (taking all right motor voxel as seeds, see Method section) showed highly overlapping results with the computed left‐right connectivity pairs (Fig. 4). Furthermore, the voxel‐wise whole‐brain fcMaps (analysis II) indicated that these functional connections are relative region specific. Panels 1–9 of Figure 5 illustrate for nine key seed regions located along the left motor cortex their matching group‐averaged fcMAP. These fcMaps suggest a high level of specific interhemispheric functional connectivity between bilateral primary motor regions. Indeed, the fcMaps do not show other large group‐averaged connectivity hotspots in the contralateral motor cortex besides the regions located near the mirrored seed regions. Taken together, our results suggest that the cortical regions of the motor homunculus are one‐on‐one functionally connected to their direct functional homolog in the contralateral motor homunculus during rest. This means that interhemispheric functional connections between primary motor regions are highly ordered according to their motor function, functionally linking motor regions that control our right foot directly with regions that control our left foot and linking motor regions that control our right hand directly to motor regions that control our left hand.
The focus of our study was on the high detailed voxel‐vise mapping of the functional connections of the bilateral somatotopic organized primary motor regions during rest. Task‐dependent fMRI studies have extensively verified the results of Penfield, showing that distinct motor regions of our primary motor cortex become specifically activated when we perform a motor task, for example moving our fingers or other body parts [Kell et al.,2005; Newton et al.,2008; Wahl et al.,2007]. Several group resting‐state fMRI studies have demonstrated that the regions of the primary motor network also show a vast amount of spontaneous neuronal activity in the absence of performing a task (i.e. during resting‐state) that is highly coherent between left and right hemispheric motor regions [Beckmann et al.,2005; Damoiseaux et al.,2006; De Luca et al.,2006; Van den Heuvel et al.,2008a,b]. These group resting‐state studies have focused on the selection of global resting‐state networks and have reported all motor regions to form a single resting‐state network. However, these studies have not examined the functional connections between subregions of the motor cortex with distinct motor functions. The results of this study suggest that all motor regions do not just form a single large resting‐state network. Instead, our results suggest that during rest distinct regions of the primary motor network with a specific motor function, like the regions that control our feet, hand, or lips, form functionally linked interhemispheric subnetworks within the full resting‐state motor network.
In this study, we used the relative traditional methodology of seed‐based fcMaps [Biswal et al.,1995; Cordes et al.,2000; Xiong et al.,1999]. Combining this fcMap methodology with a voxel‐by‐voxel mapping enabled a systematic mapping of the functional connections of a large number of seed regions (i.e. voxels) along the precentral gyrus. Most other resting‐state studies have used a single seed or a small number of seed regions to examine interregional connectivity [Biswal et al.,1995,1997; Cordes et al.,2000,2001; Fox and Raichle,2007; Fox et al.,2005; Fransson,2005; Greicius et al.,2003; Lowe et al.,1998,2000; Xiong et al.,1999]. Of course, the proposed systematic voxel‐based mapping allows for the examination of the functional connections of other cortical regions besides the primary motor regions. It potentially allows for a systematic mapping of the full functional connectivity architecture of the human brain. New methods like independent component analysis (ICA) [Beckmann et al.,2005; Damoiseaux et al.,2006; De Luca et al.,2006] and clustering‐based methods [Cordes et al.,2002; Van den Heuvel et al.,2008a] have shown the potential of examining whole brain voxel‐wise functional connectivity patterns. In addition, the overall organization of whole‐brain functional connectivity has been examined with resting‐state electroencephalogram and magnetoencephalographam recordings [Breakspear et al.,2003; Stam,2004; Stam et al.,2003], and with resting‐state fMRI recordings on both a regional scale [Achard and Bullmore,2007; Achard et al.,2006; Salvador et al.,2005b] as well as on a whole brain voxel‐wise scale (Buckner et al.,2009; Eguiluz et al.,2005; Van den Heuvel et al.,2008c]. Interestingly, these studies have shown that the functional brain as a whole is likely to be organized in small‐world fashion (Achard et al.,2006; Bullmore and Sporns2009; Van den Heuvel et al.,2008c], indicating that local and global functional connections are organized in a highly efficient manner (Achard and Bullmore2007; Bullmore and Sporns2009; Latora and Marchiori2001]. Examining these efficiently organized functional connections with a voxel‐wise fcMap approach could provide a high detailed mapping of the functionally connected brain network.
Novel neuroimaging techniques can enable the examination of both the structural and functional connections of our brain. Diffusion tensor imaging (DTI) is a technique to determine the main diffusion direction of water molecules in brain tissue [Basser et al.,2000; Beaulieu and Allen,1994] and allows for the reconstruction of the white matter pathways of the brain [Hagmann et al.,2008; Mori and van Zijl,2002; Schmahmann and Pandya,2006; Wahl et al.,2007; Wakana et al.,2004]. A large number of studies have shown that the primary motor regions in the left and right hemispheres of our brain are structurally interconnected by the cortio‐cortical white matter pathways of the corpus callosum [Doron and Gazzaniga,2008; Pandya et al.,1971; Schmahmann and Pandya,2006; Wahl et al.,2007; Wakana et al.,2004]. These studies have demonstrated that left and right primary motor regions are one‐on‐one structurally connected in both humans [Wahl et al.,2007] and primates [Schmahmann and Pandya,2006]. The results of our current study, showing the existence of a somatotopic organization of the interhemispheric functional connections between left and right motor regions are in support of these findings. Together, they suggest a direct relationship between the structural and functional connections between left and right primary motor regions of our brain. Indeed, structural corpus callosal tracts have been suggested to play an important role in interhemispheric communication, needed for the coordination of skills that involve both motor regions [Eliassen et al.,1999,2000; Wiesendanger and Serrien,2004]. Moreover, recent studies combining DTI and resting‐state fMRI have suggested a direct link between the structural and functional connections of our brain [Andrews‐Hanna et al.,2007; Greicius et al.,2008; Hagmann et al.,2008; Koch et al.,2002; Van den Heuvel et al.,2008b, in press]. For example, complete section of the corpus callosum has been reported to lead to loss of interhemispheric functional connectivity [Johnston et al.,2008]. Furthermore, the microstructural organization of the white matter cingulum tract has been directly related to the level of functional connectivity between key regions of the so‐called ‘default mode network’ [Van den Heuvel et al.,2008b]. Concerning specific structural interhemisperic connections between primary motor regions, the microstructural organization of corpus callosal tracts has been related to task‐induced transcranial magnetic stimulation (TMS) inhibition effects between contralateral motor regions [Wahl et al.,2007]. In addition, decreased levels of interhemispheric motor functional connectivity have been associated with the integrity measures of corpus callosal tracts in patients with multiple sclerosis [Lowe et al.,2008]. The results of our current study suggest that the interhemispheric functional connections between bilateral motor regions are highly region specific. Therefore, it is of special interest to examine how the strength of these functional connections relate to the microstructural organization of specific white matter structural connections that connect these bilateral motor regions.
Some points have to be considered when interpreting our results. First, the exact neurophysiological underlying of resting‐state fMRI BOLD signals is not fully understood. An increasing number of studies have suggested that the observed coherency between resting‐state fMRI time‐series of anatomically separate cortical regions is reflecting synchronization of the underlying neuronal activation patterns of these regions [Biswal et al.,1995; Buckner and Vincent,2007; Greicius et al.,2003]. This is supported by the notion that spontaneous BOLD fluctuations have been found to correlate with concurrent fluctuations in neuronal spiking, suggesting a direct link between resting‐state BOLD signals and neuronal activity [Shmuel and Leopold,2008]. However, it has also been suggested that physiological signals like low‐frequency respiratory oscillations (∼0.3 Hz) or more higher frequent cardiac oscillations (0.8–1.0 Hz) could confound the BOLD time‐series [Shmueli et al.,2007; Wise et al.,2004]. In addition, possible slow patterns like variations in heart rate and interactions between cardiac and respiratory signals may affect the low resting‐state frequencies of interest [Birn et al.,2006], making the resting‐state correlations less specific. In this study, a high temporal fMRI acquisition protocol was used to minimize the possible backfolding of higher frequencies (0.3–1 Hz) into the resting‐state frequencies of interest (0.01–0.1 Hz) [Cordes et al.,2001]. Second, in this study, we focused on the examination of functional connections between the subregions of the primary motor cortex. The average distance between the mirrored seed region and the strongest connected target region turned out to be on average very short (on average they were only 3.5 voxels separation, Fig. 3), indicating that functional subregions are most strongly functionally linked to a region with the same spatial location along the precentral gyrus in the contralateral hemisphere. As mentioned earlier, it is well known that the left and right precentral gyrus have a somatotopic organization [Penfield and Boldrey,1937; Penfield and Rasmussen,1968; Rasmussen,1977]. Assuming that the left and right precentral gyrus in low spatial detail follow a similar somatotopic organization, our results suggest that the subregions of the primary motor cortex are most strongly connected to their direct functional homolog in the contralateral motor cortex. However, as all seed areas and best connected target voxels in the other hemisphere were defined on anatomical and not on functional grounds, we cannot be completely sure about whether the seed and target did indeed have the exact same motor function. The topographical representation of motor cortex is known to be slightly variable between the left and right motor cortex due to for example handedness, resulting in a somewhat asymmetric representation of the functional subregions [Amunts et al.,1996,2000). Examining the specific location of each motor function using task related fMRI and selecting the seed voxels based on their function rather than on their anatomical location, could provide additional information about the organization of functional connections between subregions that share the exact similar motor function along the left and right motor cortex. However, unfortunately, using task‐related fMRI one is limited to the localization of only a minimal number of motor functions, as every function would require its own specific task and would require a separate fMRI experiment. Therefore, to map the overall organization of the functional connections between all subregions of the motor network, we selected the seed voxels based on their anatomical location. To minimize the possible asymmetric variation in functional representation, the resting‐state fMRI images were spatially smoothed to lessen local anatomical variation. Future studies of our lab are aimed to zoom in on key functional subregions along the primary motor cortex, using high‐resolution task‐related fMRI acquired with high field MR to determine their exact location, and to map out the functional connections between these subregions in high detail.
Third, as can be clearly seen from Figures 2 and 4 and briefly mentioned in the results section, the computed strongest functionally connected locations in the contralateral motor cortex appear to be more “packed together,” i.e. are slightly more localized near the center line of the cortex (Figs. 2 and 4). Although the seed voxels in the left primary motor cortex are clearly uniformly distributed along the left precentral gyrus, their matching group averaged strongest functionally connected regions in the right motor cortex tend to be more clustered towards the midline of the precentral gyrus. This effect was believed to result from the grouping of the strongest functionally linked locations across the individual datasets, following the procedure as depicted in Figure 1. As a seed voxel is always linked to a voxel in the contralateral precentral gyrus, as the strongest functional connections in an individual dataset was restricted to be in the precentral gyrus, the computation of the average strongest functionally linked location (Fig. 1) would always be more orientated near the center line of the group averaged precentral gyrus. However, as the effect appears to be systematic along the precentral sulcus an alternative explanation might include the existence of a possible mismatch between the neuronal and vascular signal, indicating a more fundamental issue of the (resting‐state) fMRI measurement method. However, in our study, this is not likely to be the case. First, due to the nature of the PRESTO technique a small diffusion weighting is included in the acquisition, reducing the contribution of signals coming from fast moving material, making the PRESTO fMRI signal to be more related to signals coming from smaller vessels and the capillaries than to signals coming from the larger vessels of the brain [Neggers et al.,2008]. Second, more importantly, the clustering effect as seen in the group analysis was not shown in the individual data. Supporting Information Figure 1 shows individual left‐right connectivity pairs, showing for nine exemplary individual datasets the distribution of the seed voxels in left primary motor cortex with their matching strongest functional connected location in the contralateral hemisphere on the individual level. This suggest that the “packing together” of the strongest functionally linked regions along the midline of the precentral gyrus is more likely to be a side‐effect of the group averaging, rather than to a possible mismatch between the neuronal and vascular signals. Interestingly, Supporting Information Figure 1 also marks that on the individual level the existence of a specific organization of the functional connections in the primary motor network can be observed, suggesting that the found group‐averaged organization has a robust character.
Fourth, as with all cross‐correlation methods, the functional connections between left and right motor regions were based on linear effects between their resting‐state time‐series, missing possible temporal nonlinear effects between these regions. Other coupling measures like synchronization likelihood have been successfully introduced to examine nonlinear synchronization of brain signals [Stam et al.,2003] and could potentially make a valuable contribution to the field of resting‐state fMRI research.
We report on a voxel‐wise mapping of the interhemispheric functional connections of subregions within the primary motor network. Resting‐State fMRI recordings of 46 healthy subjects were analyzed with a high detailed voxel‐by‐voxel fcMap approach, suggesting that the somatotopic organized regions of the primary motor cortex are strongly linked to their direct functional homolog in the contralateral hemisphere. Our results suggest the existence of a specific somatotopic organization of functional connections of primary motor regions during rest.
Supporting information
Additional Supporting Information may be found in the online version of this article.
Supplementary Figure 1. Individual connectivity pairs of left primary motor seeds and strongest functionally connected connected voxels in the contralateral right primary motor regions. Figure shows of 9 examplary subjects from the total group of 46 subjects their individual organization of the functional connections of the primary motor network. For each of the seed voxels evenly distributed along the left primary motor cortex, the individual time‐series of the seed was correlated with all voxels along the contralateral primary motor cortex and the voxel with the strongest functional connection was selected, forming a left‐right connectivity pair. Figure shows for 9 examplary subjects their matching left‐right connectivity pairs, with the seed voxels along the left primary motor cortex depicted by yellow squares, their matching strongest functional connected location in the contralateral hemisphere as a orange square, with a green connection between each matching left‐right pair. Every 1 on 25 seed voxels and their matching strongest functional connection are showed in the figures to prevent cluttering. Figure illustrates that also in the individual data a specific organization between the left and right primary motor regions is present, suggesting a somatopic organiztion of the funtional connections within the primary motor network. Please note that these individual datasets also provide important information about the observed clustering of the group locations along the mid‐line of the contralateral motor cortex, as can be observed in Figure 2 and 4 in the main text. As supplementary figure 1 shows, the effect of the clustering of the group‐averaged location of the strongest functionally connected region with the selected left seed voxel towards the mid‐line of the contralateral primary motor cortex, is not present in the individual data. This suggest that the clustering‐effect in the group data is more a side effect of averaging of individual locations over the group of subjects, rather than a possible mismatch between neuronal and vascular signals.
Supplementary Figure 2. Figure shows the p‐values of the null‐hypothesis that the group averaged strongest functional connected left‐right pair could emerge from random. In analysis I, in a Monte Carlo simulation, for each computed left‐right strongest functionally connected voxel‐pair it was tested whether this voxel‐pair could also emerge from when the strongest functionally connected locations in the individual datasets were random placed over the contralateral primary motor cortex, rather than following a specific organization. For this, for each left‐right seed ‐ strongest functionally connected group location, 46 random locations were selected along the contralateral precentral gyrus, as if the individual functionally connected regions would have no specific organization. Next, a group average location of these 46 non‐specific locations were computed, similar as the procedure followed in Figure 1. For each seed‐voxel, the selection of 46 random locations and the group averaging was repeated 10000 times and for each simulation the distance between the group‐averaged non‐specific location and the mirrored location of the seed was computed (similar as depicted in Figure 1). For each seed‐voxel, this Monte Carlo simulation resulted in a null‐distribution of possible distances that could occur just by chance. Next, the real data, i.e. the distance between the matching left‐right connectivity pair and the mirrored seed location (as shown in Figure 3) was tested against this distribution, testing whether the found distance could occur with a certainly probability under the null‐hypothesis (i.e. no specific organization). This resulted in an adjusted p‐value for each of the left‐right connectivity pairs. Supplementary Figure 2 shows for the left‐right connectivity pairs their p‐value. Panel b shows 1 on every 10 connections. Figure shows that far most all connections have a p‐value < 0.05 (uncorrected). Moreover, even after applying strict Bonferroni correction to correct for multiple comparisons the majority of unique connectivity pairs (>72%) still showed a left‐right orientation that was significantly different from random [p<0.05, Bonferroni corrected]. Please not that only a small number of connections in the central part of the primary motor cortex showed a p‐value > 0.05, i.e. a non‐significant left‐right connectivity pair. However, the high p‐value of these pairs is likely to result form the fact that their mirrored location was close to the average group‐averaged random location. Averaging 46 random locations often result in a location in this direction, making it very difficult to make the matching left‐right connectivity pairs in these locations to obtain a low p‐value. Indeed, examining the distance between the mirrored seed and strongest functional location of these seeds, showed that also these strongly functionally connected locations were also only 8‐12 mm off from their mirrored seed location, similar to all other left‐right voxel pairs in the superior and inferior part of the primary motor cortex.
Supplementary Figure 3. Detailed presentation of connectivity pairs of left motor seed regions and their group averaged functionally linked regions in the contralateral motor cortex. Supplementary Figure 3 is a more detailed version of Figure 2 of the main text, showing 1 on every 10 left‐right connectivity pairs.
Supplementary Figure 4. Detailed presentation of connectivity pairs of right motor seed regions and the matching group averaged functionally linked regions in the contralateral left motor cortex. Supplementary Figure 4 is a more detailed version of Figure 4 of the main text, showing 1 on every 10 right‐left connectivity pairs.
REFERENCES
- Achard S, Salvador R, Whitcher B, Suckling J, Bullmore E ( 2006): A resilient, low‐frequency, small‐world human brain functional network with highly connected association cortical hubs. J Neurosci 26: 63–72. [DOI] [PMC free article] [PubMed] [Google Scholar]
- Achard S, Bullmore E ( 2007): Efficiency and cost of economical brain functional networks. PLoS Comput Biol 3: e17. [DOI] [PMC free article] [PubMed] [Google Scholar]
- Aertsen AM, Gerstein GL, Habib MK, Palm G ( 1989): Dynamics of neuronal firing correlation: Modulation of “effective connectivity”. J Neurophysiol 61: 900–917. [DOI] [PubMed] [Google Scholar]
- Amunts K, Schlaug G, Schleicher A, Steinmetz H, Dabringhaus A, Roland PE, Zilles K ( 1996): Asymmetry in the human motor cortex and handedness. Neuroimage 4: 216–222. [DOI] [PubMed] [Google Scholar]
- Amunts K, Jancke L, Mohlberg H, Steinmetz H, Zilles K ( 2000): Interhemispheric asymmetry of the human motor cortex related to handedness and gender. Neuropsychologia 38: 304–312. [DOI] [PubMed] [Google Scholar]
- Andrews‐Hanna JR, Snyder AZ, Vincent JL, Lustig C, Head D, Raichle ME, Buckner RL ( 2007): Disruption of large‐scale brain systems in advanced aging. Neuron 56: 924–935. [DOI] [PMC free article] [PubMed] [Google Scholar]
- Basser PJ, Pajevic S, Pierpaoli C, Duda J, Aldroubi A ( 2000): In vivo fiber tractography using DT‐MRI data. Magn Reson Med 44: 625–632. [DOI] [PubMed] [Google Scholar]
- Beaulieu C, Allen PS ( 1994): Determinants of anisotropic water diffusion in nerves. Magn Reson Med 31: 394–400. [DOI] [PubMed] [Google Scholar]
- Beckmann CF, DeLuca M, Devlin JT, Smith SM ( 2005): Investigations into resting‐state connectivity using independent component analysis. Philos Trans R Soc Lond B Biol Sci 360: 1001–1013. [DOI] [PMC free article] [PubMed] [Google Scholar]
- Birn RM, Diamond JB, Smith MA, Bandettini PA ( 2006): Separating respiratory‐variation‐related fluctuations from neuronal‐activity‐related fluctuations in fMRI. Neuroimage 31: 1536–1548. [DOI] [PubMed] [Google Scholar]
- Biswal B, Yetkin FZ, Haughton VM, Hyde JS ( 1995): Functional connectivity in the motor cortex of resting human brain using echo‐planar MRI. Magn Reson Med 34: 537–541. [DOI] [PubMed] [Google Scholar]
- Biswal BB, Van Kylen J, Hyde JS ( 1997): Simultaneous assessment of flow and BOLD signals in resting‐state functional connectivity maps. NMR Biomed 10: 165–170. [DOI] [PubMed] [Google Scholar]
- Breakspear M, Terry JR, Friston KJ, Harris AW, Williams LM, Brown K, Brennan J, Gordon E ( 2003): A disturbance of nonlinear interdependence in scalp EEG of subjects with first episode schizophrenia. Neuroimage 20: 466–478. [DOI] [PubMed] [Google Scholar]
- Buckner RL, Vincent JL ( 2007): Unrest at rest: Default activity and spontaneous network correlations. Neuroimage 37: 1091–1096. [DOI] [PubMed] [Google Scholar]
- Buckner RL, Sepulcre J, Talukdar T, Krienen FM, Liu H, Hedden T, Andrews‐Hanna JR, Sperling RA, Johnson KA ( 2009): Cortical hubs revealed by intrinsic functional connectivity: Mapping, assessment of stability, and relation to Alzheimer's disease. J Neurosci 29: 1860–1873. [DOI] [PMC free article] [PubMed] [Google Scholar]
- Bullmore E, Sporns O ( 2009): Complex brain networks: Graph theoretical analysis of structural and functional systems. Nat Rev Neurosci 10: 186–198. [DOI] [PubMed] [Google Scholar]
- Calhoun VD, Adali T, Pearlson GD, Pekar JJ ( 2001): A method for making group inferences from functional MRI data using independent component analysis. Hum Brain Mapp 14: 140–151. [DOI] [PMC free article] [PubMed] [Google Scholar]
- Cordes D, Haughton VM, Arfanakis K, Wendt GJ, Turski PA, Moritz CH, Quigley MA, Meyerand ME ( 2000): Mapping functionally related regions of brain with functional connectivity MR imaging. AJNR Am J Neuroradiol 21: 1636–1644. [PMC free article] [PubMed] [Google Scholar]
- Cordes D, Haughton VM, Arfanakis K, Carew JD, Turski PA, Moritz CH, Quigley MA, Meyerand ME ( 2001): Frequencies contributing to functional connectivity in the cerebral cortex in “resting‐state” data. Am J Neuroradiol 22: 1326–1333. [PMC free article] [PubMed] [Google Scholar]
- Cordes D, Haughton V, Carew JD, Arfanakis K, Maravilla K ( 2002): Hierarchical clustering to measure connectivity in fMRI resting‐state data. Magn Reson Imaging 20: 305–317. [DOI] [PubMed] [Google Scholar]
- Damoiseaux JS, Rombouts SA, Barkhof F, Scheltens P, Stam CJ, Smith SM, Beckmann CF ( 2006): Consistent resting‐state networks across healthy subjects. Proc Natl Acad Sci USA 103: 13848–13853. [DOI] [PMC free article] [PubMed] [Google Scholar]
- De Luca M, Smith S, De Stefano N, Federico A, Matthews PM ( 2005): Blood oxygenation level dependent contrast resting state networks are relevant to functional activity in the neocortical sensorimotor system. Exp Brain Res 167: 587–594. [DOI] [PubMed] [Google Scholar]
- De Luca M, Beckmann CF, De Stefano N, Matthews PM, Smith SM ( 2006): fMRI resting state networks define distinct modes of long‐distance interactions in the human brain. Neuroimage 29: 1359–1367. [DOI] [PubMed] [Google Scholar]
- Doron KW, Gazzaniga MS ( 2008): Neuroimaging techniques offer new perspectives on callosal transfer and interhemispheric communication. Cortex 44: 1023–1029. [DOI] [PubMed] [Google Scholar]
- Eguiluz VM, Chialvo DR, Cecchi GA, Baliki M, Apkarian AV ( 2005): Scale‐free brain functional networks. Phys Rev Lett 94: 018102. [DOI] [PubMed] [Google Scholar]
- Eliassen JC, Baynes K, Gazzaniga MS ( 1999): Direction information coordinated via the posterior third of the corpus callosum during bimanual movements. Exp Brain Res 128: 573–577. [DOI] [PubMed] [Google Scholar]
- Eliassen JC, Baynes K, Gazzaniga MS ( 2000): Anterior and posterior callosal contributions to simultaneous bimanual movements of the hands and fingers. Brain 123: 2501–2511. [DOI] [PubMed] [Google Scholar]
- Fischl B, van der Kouwe A, Destrieux C, Halgren E, Segonne F, Salat DH, Busa E, Seidman LJ, Goldstein J, Kennedy D, et al. ( 2004): Automatically parcellating the human cerebral cortex. Cereb Cortex 14: 11–22. [DOI] [PubMed] [Google Scholar]
- Fox MD, Raichle ME ( 2007): Spontaneous fluctuations in brain activity observed with functional magnetic resonance imaging. Nat Rev Neurosci 8: 700–711. [DOI] [PubMed] [Google Scholar]
- Fox MD, Snyder AZ, Vincent JL, Corbetta M, Van Essen DC, Raichle ME ( 2005): The human brain is intrinsically organized into dynamic, anticorrelated functional networks. Proc Natl Acad Sci USA 102: 9673–9678. [DOI] [PMC free article] [PubMed] [Google Scholar]
- Fransson P ( 2005): Spontaneous low‐frequency BOLD signal fluctuations: An fMRI investigation of the resting‐state default mode of brain function hypothesis. Hum Brain Mapp 26: 15–29. [DOI] [PMC free article] [PubMed] [Google Scholar]
- Friston KJ, Frith CD, Liddle PF, Frackowiak RS ( 1993): Functional connectivity: The principal‐component analysis of large (PET) data sets. J Cereb Blood Flow Metab 13: 5–14. [DOI] [PubMed] [Google Scholar]
- Golay X, Pruessmann KP, Weiger M, Crelier GR, Folkers PJ, Kollias SS, Boesiger P ( 2000): PRESTO‐SENSE: An ultrafast whole‐brain fMRI technique. Magn Reson Med 43: 779–786. [DOI] [PubMed] [Google Scholar]
- Greicius MD, Krasnow B, Reiss AL, Menon V ( 2003): Functional connectivity in the resting brain: A network analysis of the default mode hypothesis. Proc Natl Acad Sci USA 100: 253–258. [DOI] [PMC free article] [PubMed] [Google Scholar]
- Greicius MD, Supekar K, Menon V, Dougherty RF ( 2008): Resting‐state functional connectivity reflects structural connectivity in the default mode network. Cereb Cortex 19: 72–78. [DOI] [PMC free article] [PubMed] [Google Scholar]
- Hagmann P, Cammoun L, Gigandet X, Meuli R, Honey CJ, Wedeen VJ, Sporns O ( 2008): Mapping the structural core of human cerebral cortex. PLoS Biol 6: e159. [DOI] [PMC free article] [PubMed] [Google Scholar]
- Johnston JM, Vaishnavi SN, Smyth MD, Zhang D, He BJ, Zempel JM, Shimony JS, Snyder AZ, Raichle ME ( 2008): Loss of resting interhemispheric functional connectivity after complete section of the corpus callosum. J Neurosci 28: 6453–6458. [DOI] [PMC free article] [PubMed] [Google Scholar]
- Kell CA, von Kriegstein K, Rosler A, Kleinschmidt A, Laufs H ( 2005): The sensory cortical representation of the human penis: Revisiting somatotopy in the male homunculus. J Neurosci 25: 5984–5987. [DOI] [PMC free article] [PubMed] [Google Scholar]
- Koch MA, Norris DG, Hund‐Georgiadis M ( 2002): An investigation of functional and anatomical connectivity using magnetic resonance imaging. Neuroimage 16: 241–250. [DOI] [PubMed] [Google Scholar]
- Latora V, Marchiori M ( 2001): Efficient behavior of small‐world networks. Phys Rev Lett 87: 198701. [DOI] [PubMed] [Google Scholar]
- Liu J, Morel A, Wannier T, Rouiller EM ( 2002): Origins of callosal projections to the supplementary motor area (SMA): A direct comparison between pre‐SMA and SMA‐proper in macaque monkeys. J Comp Neurol 443: 71–85. [DOI] [PubMed] [Google Scholar]
- Lowe MJ, Mock BJ, Sorenson JA ( 1998): Functional connectivity in single and multislice echoplanar imaging using resting‐state fluctuations. Neuroimage 7: 119–132. [DOI] [PubMed] [Google Scholar]
- Lowe MJ, Dzemidzic M, Lurito JT, Mathews VP, Phillips MD ( 2000): Correlations in low‐frequency BOLD fluctuations reflect cortico‐cortical connections. Neuroimage 12: 582–587. [DOI] [PubMed] [Google Scholar]
- Lowe MJ, Beall EB, Sakaie KE, Koenig KA, Stone L, Marrie RA, Phillips MD ( 2008): Resting state sensorimotor functional connectivity in multiple sclerosis inversely correlates with transcallosal motor pathway transverse diffusivity. Hum Brain Mapp 29: 818–827. [DOI] [PMC free article] [PubMed] [Google Scholar]
- Mori S, van Zijl PC ( 2002): Fiber tracking: Principles and strategies—A technical review. NMR Biomed 15: 468–480. [DOI] [PubMed] [Google Scholar]
- Neggers SF, Hermans EJ, Ramsey NF ( 2008): Enhanced sensitivity with fast three‐dimensional blood‐oxygen‐level‐dependent functional MRI: Comparison of SENSE‐PRESTO and 2D‐EPI at 3 T. NMR Biomed 21: 663–676. [DOI] [PubMed] [Google Scholar]
- Newton JM, Dong Y, Hidler J, Plummer‐D'Amato P, Marehbian J, Albistegui‐Dubois RM, Woods RP, Dobkin BH ( 2008): Reliable assessment of lower limb motor representations with fMRI: Use of a novel MR compatible device for real‐time monitoring of ankle, knee and hip torques. Neuroimage 43: 136–146. [DOI] [PMC free article] [PubMed] [Google Scholar]
- Nir Y, Mukamel R, Dinstein I, Privman E, Harel M, Fisch L, Gelbard‐Sagiv H, Kipervasser S, Andelman F, Neufeld MY, et al. ( 2008): Interhemispheric correlations of slow spontaneous neuronal fluctuations revealed in human sensory cortex. Nat Neurosci 11: 1100–1108. [DOI] [PMC free article] [PubMed] [Google Scholar]
- Pandya DN, Karol EA, Heilbronn D ( 1971): The topographical distribution of interhemispheric projections in the corpus callosum of the rhesus monkey. Brain Res 32: 31–43. [DOI] [PubMed] [Google Scholar]
- Penfield W, Boldrey E ( 1937): Somatic motor and sensory representation in the cerebral cortex of man as studied by electrical stimulation. Brain 60: 54. [Google Scholar]
- Penfield W, Rasmussen T ( 1968): The cerebral cortex of man: A clinical study of localization of function. Macmillan. [Google Scholar]
- Rasmussen TB ( 1977): Wilder Penfield: His legacy to neurology. Surgical treatment of epilepsy. Can Med Assoc J 116: 1369–1370. [PMC free article] [PubMed] [Google Scholar]
- Rouiller EM, Babalian A, Kazennikov O, Moret V, Yu XH, Wiesendanger M ( 1994): Transcallosal connections of the distal forelimb representations of the primary and supplementary motor cortical areas in macaque monkeys. Exp Brain Res 102: 227–243. [DOI] [PubMed] [Google Scholar]
- Salvador R, Suckling J, Coleman MR, Pickard JD, Menon D, Bullmore E ( 2005a): Neurophysiological architecture of functional magnetic resonance images of human brain. Cereb Cortex 15: 1332–1342. [DOI] [PubMed] [Google Scholar]
- Salvador R, Suckling J, Schwarzbauer C, Bullmore E ( 2005b): Undirected graphs of frequency‐dependent functional connectivity in whole brain networks. Philos Trans R Soc Lond B Biol Sci 360: 937–946. [DOI] [PMC free article] [PubMed] [Google Scholar]
- Schmahmann JD, Pandya DN ( 2006): Fiber Pathways of the Brain. Oxford University Press; pp 485–496. [Google Scholar]
- Shmuel A, Leopold DA ( 2008): Neuronal correlates of spontaneous fluctuations in fMRI signals in monkey visual cortex: Implications for functional connectivity at rest. Hum Brain Mapp 29: 751–761. [DOI] [PMC free article] [PubMed] [Google Scholar]
- Shmuel A, Augath M, Oeltermann A, Logothetis NK ( 2006): Negative functional MRI response correlates with decreases in neuronal activity in monkey visual area V1. Nat Neurosci 9: 569–577. [DOI] [PubMed] [Google Scholar]
- Shmueli K, van Gelderen P, de Zwart JA, Horovitz SG, Fukunaga M, Jansma JM, Duyn JH ( 2007): Low‐frequency fluctuations in the cardiac rate as a source of variance in the resting‐state fMRI BOLD signal. Neuroimage 38: 306–320. [DOI] [PMC free article] [PubMed] [Google Scholar]
- Stam CJ ( 2004): Functional connectivity patterns of human magnetoencephalographic recordings: A ‘small‐world’ network? Neurosci Lett 355: 25–28. [DOI] [PubMed] [Google Scholar]
- Stam CJ, Breakspear M, van Cappellen van Walsum AM, van Dijk BW ( 2003): Nonlinear synchronization in EEG and whole‐head MEG recordings of healthy subjects. Hum Brain Mapp 19: 63–78. [DOI] [PMC free article] [PubMed] [Google Scholar]
- van de Ven VG, Formisano E, Prvulovic D, Roeder CH, Linden DE ( 2004): Functional connectivity as revealed by spatial independent component analysis of fMRI measurements during rest. Hum Brain Mapp 22: 165–178. [DOI] [PMC free article] [PubMed] [Google Scholar]
- Van den Heuvel MP, Mandl RC, Hulshoff Pol HE ( 2008a): Normalized group clustering of resting‐state fMRI data. PLoS ONE 3: e2001. [DOI] [PMC free article] [PubMed] [Google Scholar]
- Van den Heuvel MP, Mandl RC, Luigjes J, Hulshoff Pol HE ( 2008b): Microstructural organization of the cingulum tract and the level of default mode functional connectivity. J Neurosci 28: 7. [DOI] [PMC free article] [PubMed] [Google Scholar]
- Van den Heuvel MP, Stam CJ, Boersma M, Hulshoff Pol HE ( 2008c): Small‐world and scale‐free organization of voxel based resting‐state functional connectivity in the human brain. Neuroimage 43: 11. [DOI] [PubMed] [Google Scholar]
- Van den Heuvel MP, Mandl RCW, Kahn RS, Hulshoff Pol HE: Functionally linked resting state networks reflect the underlying structural connectivity architecture of the human brain (in press). [DOI] [PMC free article] [PubMed]
- Wahl M, Lauterbach‐Soon B, Hattingen E, Jung P, Singer O, Volz S, Klein JC, Steinmetz H, Ziemann U ( 2007): Human motor corpus callosum: Topography, somatotopy, and link between microstructure and function. J Neurosci 27: 12132–12138. [DOI] [PMC free article] [PubMed] [Google Scholar]
- Wakana S, Jiang H, Nagae‐Poetscher LM, van Zijl PC, Mori S ( 2004): Fiber tract‐based atlas of human white matter anatomy. Radiology 230: 77–87. [DOI] [PubMed] [Google Scholar]
- Wiesendanger M, Serrien DJ ( 2004): The quest to understand bimanual coordination. Prog Brain Res 143: 491–505. [DOI] [PubMed] [Google Scholar]
- Wise RG, Ide K, Poulin MJ, Tracey I ( 2004): Resting fluctuations in arterial carbon dioxide induce significant low frequency variations in BOLD signal. Neuroimage 21: 1652–1664. [DOI] [PubMed] [Google Scholar]
- Xiong J, Parsons LM, Gao JH, Fox PT ( 1999): Interregional connectivity to primary motor cortex revealed using MRI resting state images. Hum Brain Mapp 8: 151–156. [DOI] [PMC free article] [PubMed] [Google Scholar]
Associated Data
This section collects any data citations, data availability statements, or supplementary materials included in this article.
Supplementary Materials
Additional Supporting Information may be found in the online version of this article.
Supplementary Figure 1. Individual connectivity pairs of left primary motor seeds and strongest functionally connected connected voxels in the contralateral right primary motor regions. Figure shows of 9 examplary subjects from the total group of 46 subjects their individual organization of the functional connections of the primary motor network. For each of the seed voxels evenly distributed along the left primary motor cortex, the individual time‐series of the seed was correlated with all voxels along the contralateral primary motor cortex and the voxel with the strongest functional connection was selected, forming a left‐right connectivity pair. Figure shows for 9 examplary subjects their matching left‐right connectivity pairs, with the seed voxels along the left primary motor cortex depicted by yellow squares, their matching strongest functional connected location in the contralateral hemisphere as a orange square, with a green connection between each matching left‐right pair. Every 1 on 25 seed voxels and their matching strongest functional connection are showed in the figures to prevent cluttering. Figure illustrates that also in the individual data a specific organization between the left and right primary motor regions is present, suggesting a somatopic organiztion of the funtional connections within the primary motor network. Please note that these individual datasets also provide important information about the observed clustering of the group locations along the mid‐line of the contralateral motor cortex, as can be observed in Figure 2 and 4 in the main text. As supplementary figure 1 shows, the effect of the clustering of the group‐averaged location of the strongest functionally connected region with the selected left seed voxel towards the mid‐line of the contralateral primary motor cortex, is not present in the individual data. This suggest that the clustering‐effect in the group data is more a side effect of averaging of individual locations over the group of subjects, rather than a possible mismatch between neuronal and vascular signals.
Supplementary Figure 2. Figure shows the p‐values of the null‐hypothesis that the group averaged strongest functional connected left‐right pair could emerge from random. In analysis I, in a Monte Carlo simulation, for each computed left‐right strongest functionally connected voxel‐pair it was tested whether this voxel‐pair could also emerge from when the strongest functionally connected locations in the individual datasets were random placed over the contralateral primary motor cortex, rather than following a specific organization. For this, for each left‐right seed ‐ strongest functionally connected group location, 46 random locations were selected along the contralateral precentral gyrus, as if the individual functionally connected regions would have no specific organization. Next, a group average location of these 46 non‐specific locations were computed, similar as the procedure followed in Figure 1. For each seed‐voxel, the selection of 46 random locations and the group averaging was repeated 10000 times and for each simulation the distance between the group‐averaged non‐specific location and the mirrored location of the seed was computed (similar as depicted in Figure 1). For each seed‐voxel, this Monte Carlo simulation resulted in a null‐distribution of possible distances that could occur just by chance. Next, the real data, i.e. the distance between the matching left‐right connectivity pair and the mirrored seed location (as shown in Figure 3) was tested against this distribution, testing whether the found distance could occur with a certainly probability under the null‐hypothesis (i.e. no specific organization). This resulted in an adjusted p‐value for each of the left‐right connectivity pairs. Supplementary Figure 2 shows for the left‐right connectivity pairs their p‐value. Panel b shows 1 on every 10 connections. Figure shows that far most all connections have a p‐value < 0.05 (uncorrected). Moreover, even after applying strict Bonferroni correction to correct for multiple comparisons the majority of unique connectivity pairs (>72%) still showed a left‐right orientation that was significantly different from random [p<0.05, Bonferroni corrected]. Please not that only a small number of connections in the central part of the primary motor cortex showed a p‐value > 0.05, i.e. a non‐significant left‐right connectivity pair. However, the high p‐value of these pairs is likely to result form the fact that their mirrored location was close to the average group‐averaged random location. Averaging 46 random locations often result in a location in this direction, making it very difficult to make the matching left‐right connectivity pairs in these locations to obtain a low p‐value. Indeed, examining the distance between the mirrored seed and strongest functional location of these seeds, showed that also these strongly functionally connected locations were also only 8‐12 mm off from their mirrored seed location, similar to all other left‐right voxel pairs in the superior and inferior part of the primary motor cortex.
Supplementary Figure 3. Detailed presentation of connectivity pairs of left motor seed regions and their group averaged functionally linked regions in the contralateral motor cortex. Supplementary Figure 3 is a more detailed version of Figure 2 of the main text, showing 1 on every 10 left‐right connectivity pairs.
Supplementary Figure 4. Detailed presentation of connectivity pairs of right motor seed regions and the matching group averaged functionally linked regions in the contralateral left motor cortex. Supplementary Figure 4 is a more detailed version of Figure 4 of the main text, showing 1 on every 10 right‐left connectivity pairs.