

Abstract
Higher‐order cognitive functions are supported by distributed networks of multiple interconnected cortical and subcortical regions. Efficient cognitive processing depends on fast communication between these regions, so the integrity of the connections between them is of great importance. It is known that white matter (WM) development is a slow process, continuing into adulthood. While the significance of cortical maturation for intellectual development is described, less is known about the relationships between cognitive functions and maturation of WM connectivity. In this cross‐sectional study, we investigated the associations between intellectual abilities and development of diffusion tensor imaging (DTI) derived measures of WM microstructure in 168 right‐handed participants aged 8–30 years. Independently of age and sex, both verbal and performance abilities were positively related to fractional anisotropy (FA) and negatively related to mean diffusivity (MD) and radial diffusivity (RD), predominantly in the left hemisphere. Further, verbal, but not performance abilities, were associated with developmental differences in DTI indices in widespread regions in both hemispheres. Regional analyses showed relations with both FA and RD bilaterally in the anterior thalamic radiation and the cortico‐spinal tract and in the right superior longitudinal fasciculus. In these regions, our results suggest that participants with high verbal abilities may show accelerated WM development in late childhood and a subsequent earlier developmental plateau, in contrast to a steadier and prolonged development in participants with average verbal abilities. Longitudinal data are needed to validate these interpretations. The results provide insight into the neurobiological underpinnings of intellectual development. Hum Brain Mapp, 2010. © 2010 Wiley‐Liss, Inc.
Keywords: adolescence, brain, cognition, DTI, FA, intelligence, maturation, TBSS
INTRODUCTION
Higher‐order cognitive functions undergo dramatic development from early childhood throughout adolescence. At the same time, the brain shows rapid structural maturation [Casey et al., 2005]. Neuroimaging studies show sustained development of the cerebral cortex, subcortical structures, and WM from early childhood, throughout adolescence and well into adulthood [Giedd, 2004; Giorgio et al., 2010; Gogtay et al., 2004; Lebel et al., 2008; Shaw et al., 2008; Tamnes et al., in press Østby et al., 2009]. The structural maturation of cerebral cortex has been related to intellectual abilities [Shaw et al., 2006], and brain regions supporting sensory and motor processes mature earlier than regions associated with higher‐order and more complex cognitive functions [Lebel et al., 2008; Shaw et al., 2008; Tamnes et al., in press]. Regional brain mapping suggests that intellectual abilities are supported by multiple interconnected cortical regions [Choi et al., 2008; Colom et al., 2006; Shaw, 2007]. Among the regions associated with general intellectual abilities are prefrontal, anterior cingulate, posterior parietal, and smaller areas of the temporal and occipital cortices [Frangou et al., 2004; Haier et al., 2004; Karama et al., 2009; Luders et al., 2009; Narr et al., 2007; Shaw, 2007; Wilke et al., 2003].
Shaw et al. [ 2006] showed that children at different levels of intellectual abilities had different developmental trajectories of cortical thickness, primarily in frontal regions. Children with high intelligence scores were characterized by an accelerated and prolonged phase of increase in cortical thickness in early childhood, and a more rapid cortical thinning in adolescence. Sowell et al. [ 2004] demonstrated that gain in verbal intelligence was correlated with cortical thinning in the left hemisphere in lateral dorsofrontal and lateral parietal regions, while a similar expected right hemisphere association with gain in performance intelligence was not found. General intellectual abilities have also been linked to correlations between different cortical areas [Lerch et al., 2006] and to functional connectivity within the frontal lobe and between the frontal lobe and posterior brain regions [Song et al., 2008].
Cognitive functions are supported by a large number of anatomically separated brain regions, and this functional distribution demands fast and efficient exchange of information. However, no studies have investigated in detail the relationships between maturation of the brain's WM, mainly consisting of myelinated long‐distance axonal projections, and development of cognitive functions. DTI is a neuroimaging technique sensitive to degree and direction of water molecule permeability [Beaulieu, 2002], which are related to WM microstructure. FA is a frequently used intra‐voxel metric characterizing degree of diffusion directionality sensitive to several neurobiological features, e.g., axon size, density and organization as well as degree of myelination [Beaulieu, 2002]. In addition to FA, average magnitude of water diffusion, MD, as well as axial diffusivity (AD, parallel diffusivity) and RD (perpendicular diffusivity) can be measured. FA has been shown to correlate with an electrophysiological marker of error‐processing, suggesting an association between WM structural properties and synchronization of large‐scale brain networks indicative of higher‐order cognitive processing [Westlye et al., 2009]. Associations between DTI indices and measures of intelligence have been investigated in samples with various neurological abnormalities, genetic disorders, and developmental disorders [Barnea‐Goraly et al., 2003; Nakamura et al., 2005; Peng et al., 2004; Rovaris et al., 2002; Skranes et al., 2007; Yu et al., 2008], but there are limited data available on healthy participants and particularly on children and adolescents. In adults, FA has been shown to be associated with intellectual abilities in the right uncinate fasciculus [Yu et al., 2008], in the prefrontal lobe and the hippocampal formation [Li et al., 2009] and with both full‐scale and performance intelligence in distributed regions [Chiang et al., 2009]. In children, Schmithorst et al. [ 2005] have demonstrated positive associations between FA and intellectual abilities bilaterally in WM association areas, including frontal and occipito‐parietal areas. Though the literature is limited, these studies suggest a relationship between WM microstructure as revealed by DTI and general cognitive functions in late childhood, adolescence, and adulthood.
In the present study, we assessed verbal and performance intellectual abilities and DTI indices of WM microstructure in 168 healthy participants aged 8–30 years. The main aim was to test how general cognitive abilities relate to the maturation of WM microstructure. The results showed that, independently of age, both verbal and performance abilities were related to WM microstructure, predominantly in the left hemisphere. Further, level of verbal abilities was related to developmental differences in neuroanatomical connectivity in distributed regions of the brain.
METHODS
Participants
The sample was drawn from the first wave of two ongoing longitudinal research projects at the Center for the Study of Human Cognition at the University of Oslo (Neurocognitive Development/Cognition and Plasticity through the Life‐Span). The studies were approved by the Regional Ethical Committee of South Norway (REK‐Sør). Written informed consent was obtained from all participants older than 12 years of age and from parent/guardian of volunteers under 18 years of age. Oral informed consent was given by participants under 12 years of age. Volunteers were recruited by newspaper advertisements and through local schools and work places. Screening interviews were conducted with all participants aged 16–30 years and with parent/guardian of participants aged 8–19 years. Participants were required to be right handed native Norwegian speakers in the age range 8–30 years, have normal or corrected to normal vision and hearing, not be under psychiatric treatment, not use medicines known to affect central nervous system (CNS) functioning, including psychoactive drugs, and not have injury or disease known to affect CNS function, including neurological or psychiatric illness, or serious head injury. One hundred and seventy six participants satisfied these criteria. Seven participants were excluded due to lacking or incomplete magnetic resonance imaging (MRI) data because of technical issues or that the participant did not complete the scanning session. All subjects' MR scans were examined by a specialist in neuroradiology and required to be deemed free of significant anomalies. One participant was excluded on this basis. For the remaining 168 participants (87 female/81 male), mean age was 17.7 years (8.2–30.8 years, SD = 6.1). There was no significant correlation between age and sex (r = 0.05, P = 0.513, males coded as 0 and females coded as 1).
Cognitive Assessment
General cognitive abilities were assessed by Wechsler Abbreviated Scale of Intelligence (WASI) [Wechsler, 1999]. Verbal IQ was estimated from the subtests vocabulary and similarities and performance IQ was estimated from the subtests matrix reasoning and block design. Full scale IQ was estimated from all four subtests. As there are no Norwegian norms available for WASI, the original U.S. material was used. Demographic and intellectual characteristics of the sample classified in subgroups according to age and total are reported in Table I. Mean full‐scale IQ for the entire sample was 110.4 (SD = 9.9). A discrepancy was observed between verbal IQ and performance IQ, indicating a recruitment bias or that the norms are not accurate for Norwegian samples since a similar discrepancy has been also found previously in adults [Westlye et al., 2009]. For all further analyses, z‐transformed raw scores not adjusted for age were used. Verbal abilities, performance abilities, and full scale intellectual abilities scores were created by averaging the relevant z‐transformed raw scores. There was a strong correlation between verbal abilities and performance abilities (r = 0.76, P < 0.001), while a medium correlation was observed after controlling for the effects of age (r = 0.56, P < 0.001). This is in general agreement with previous intercorrelation studies [Wechsler, 1999] and supports the notion of a g factor, but also the usefulness of distinguishing between verbal and performance abilities. There were no significant correlations between sex and neither the age‐standardized nor the raw intellectual abilities scores.
Table I.
Sample descriptives by age group and total
| Age group (years) | Total (n) | Females [n (%)] | Full IQ [mean (SD, range)] | Verbal IQ [mean (SD, range)] | Performance IQ [mean (SD, range)] |
|---|---|---|---|---|---|
| 08–11 | 36 | 17 (47) | 106.5 (11.0, 82–127) | 98.3 (9.0, 76–114) | 114.6 (15.5, 86–142) |
| 12–15 | 37 | 19 (51) | 108.2 (10.7, 91–141) | 104.0 (12.3, 81–129) | 110.4 (9.6, 91–143) |
| 16–19 | 35 | 19 (54) | 112.1 (10.5, 91–132) | 110.1 (10.9, 80–132) | 111.2 (9.9, 89–128) |
| 20–23 | 33 | 17 (52) | 113.1 (7.5, 100–126) | 105.2 (9.3, 90–123) | 118.8 (8.5, 99–132) |
| 24–30 | 27 | 15 (56) | 112.9 (6.5, 100–125) | 104.5 (6.1, 95–118) | 119.8 (9.0, 98–137) |
| Total | 168 | 87 (52) | 110.4 (9.9, 82–141) | 104.4 (10.5, 76–132) | 114.6 (11.4, 86–143) |
Demographic and intellectual characteristics of the sample classified in subgroups according to age. For all IQ variables, age‐standardized scores are shown.
MRI Data Acquisition
All imaging data were collected using a 12 channel head coil on the same 1.5‐Tesla Siemens Avanto scanner (Siemens Medical Solutions, Erlangen, Germany) at Rikshospitalet University Hospital, Oslo. For diffusion weighted imaging (DWI) a single‐shot twice‐refocused spin echo echo planar imaging (EPI) pulse sequence with 30 diffusion sensitized gradient directions and the following parameters was used: repetition time (TR)/echo time (TE) = 8200 ms/82 ms, b‐value = 700 s/mm2, voxel size = 2.0 × 2.0 × 2.0 mm. This sequence is optimized to minimize eddy‐current‐induced image distortions [Reese et al., 2003]. The sequence was repeated in two successive runs with 10 non diffusion‐weighted images (b = 0) in addition to 30 diffusion weighted images collected per acquisition. Each volume consisted of 64 axial slices. Total scanning time was 11 min, 21 s. The two acquisitions were averaged during post‐processing to increase signal‐to‐noise ratio (SNR). In addition, a T2‐weighted fluid‐attenuated inversion recovery (FLAIR) sequence was used to aid the neuroradiological examination.
DTI Analysis
All datasets were processed and analyzed at the Center for the Study of Human Cognition, University of Oslo, with additional use of computing resources from the Titan High Performance Computing facilities (http://hpc.uio.no/index.php/Titan). Image analyses and tensor calculations were done using FSL (http://www.fmrib.ox.ac.uk/fsl/index.html) [Smith et al., 2004] and tract‐based spatial statistics (TBSS) [Smith et al., 2006], a method aimed to solve issues of cross‐subject data alignment. Another advantage of TBSS is that no spatial smoothing is necessary in the image processing, and thus the arbitrariness of the choice of smoothing extent is avoided [Smith et al., 2006].
Initially, each DTI volume was affine registered to the T2‐weighted b = 0 volume using FLIRT [Jenkinson and Smith, 2001]. This corrected for motion between scans and residual eddy‐current distortions present in the diffusion weighted images. After averaging of the two acquisitions general linear modeling was used to fit the tensors to the data and create the FA, eigenvector and eigenvalue maps. MD was computed as the mean of all three eigenvalues ((λ1 + λ2 + λ3)/3), RD as the mean of the second and third eigenvalues ((λ2 + λ3)/2), and AD was defined as the principal diffusion eigenvalue (λ1). Next, all individuals' FA volumes were skeletonised and transformed into a common space [Smith et al., 2006]. Briefly, all volumes were nonlinearly warped by use of local deformation procedures performed by FNIRT (http://www.fmrib.ox.ac.uk/fsl/fnirt/index.html), a nonlinear registration toolkit using a b‐spline representation of the registration warp field [Rueckert et al., 1999]. The FMRIB58 FA standard‐space image provided with FSL, a high‐resolution average of 58 well‐aligned good quality FA images from healthy male and female subjects, was used as target. All warped FA volumes were visually inspected for accuracy, which is especially pertinent when analyzing datasets with broad age ranges with large inter‐individual variability in brain size and architecture. In our experience, FNIRT performed the native‐to‐standard warping excellently across all included age groups. Next, a mean FA volume of all subjects was generated and thinned to create a mean FA skeleton representing the centers of all common tracts. The mean skeleton was thresholded at FA > 0.25 to reduce the likelihood of partial voluming in the borders between tissue classes, yielding a mask of 108.005 WM voxels. Individual FA values were warped onto this mean skeleton mask by searching perpendicular from the skeleton for maximum FA values. Using maximum FA values from the centers of the tracts further minimizes confounding effects due to partial voluming [Smith et al., 2006]. The resulting tract invariant skeletons for each participant were fed into voxel‐wise permutation based cross‐subject statistics. Similar warping and analyses were employed on MD, RD, and AD skeletons sampled from voxels with FA > 0.25. Figure 1 shows DTI data from two participants, as well as the mean FA skeleton for the entire sample. Further, binary masks based on a probabilistic tractography atlas (the Johns Hopkins University (JHU) white‐matter tractography atlas) [Mori et al., 2005] provided with FSL were created with a probability threshold of 5%. The relatively liberal threshold was chosen to accommodate inter‐subject variation in gross WM fiber architecture. Seven major WM tracts in each hemisphere (anterior thalamic radiation, cingulum‐cingulate gyrus, cingulum‐hippocampus gyrus, cortico‐spinal tract, inferior and superior longitudinal fasciculus, and uncinate fasciculus) and two commissural tracts (forceps minor and forceps major) were chosen as tracts of interest (TOIs). Voxels intersecting both the skeleton and the TOIs were used in subsequent regional analyses.
Figure 1.
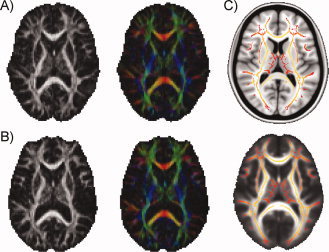
Horizontal slices of DTI data from two participants. (A) FA map and color‐coded vectormap from a representative 10‐year‐old male. Images are shown in original resolution to give a sense of data quality. (B) The same maps from a representative 29‐year‐old male. (C) The TBSS mean FA skeleton for the entire sample, overlaid on the standard MNI152 T1 template (top) and on the mean FA map of the entire sample (bottom). The skeleton is thresholded at FA > 0.25. All images are shown in radiological convention.
Statistical Analysis
Initially, z‐transformed raw verbal and performance abilities scores and average DTI measures from all the skeleton voxels were plotted as a function of age. Both linear and exponential models were fitted. To test for possible sex differences in the DTI measures and the DTI‐age relationships, we performed independent samples t‐tests on the average DTI measures and voxel‐based global DTI analyses, respectively.
Voxel‐based global DTI analyses were carried out using permutation‐based inference [Nichols and Holmes, 2002] as implemented in the randomize tool within FSL. Five thousand permutations were performed for each analysis. Effects of verbal and performance abilities, respectively, on FA, MD, RD, and AD across the WM skeleton were tested with GLMs while regressing out the effects of age and sex. Additionally, possible sex differences were tested with GLMs directly contrasting the relationships between verbal abilities and DTI indices in females versus males. Next, interaction effects between age and verbal and performance abilities, respectively, on DTI indices were tested using interaction terms while regressing out the effects of age, sex, and verbal or performance abilities. Threshold free cluster enhancement (TFCE) [Smith and Nichols, 2009] was used to avoid the arbitrariness involved in setting smoothing levels and thresholding parameters for cluster size inference. Statistical P‐maps were thresholded at P < 0.05 corrected for multiple comparisons across space. As the results showed distributed associations, 3D‐renderings of the statistical P‐maps were created for visualization purposes. The figures were made by the use of 3D slicer software (http://www.slicer.org).
Next, regional DTI analyses on the TOIs were performed with multiple regressions on FA, MD, RD, and AD with age, sex, and verbal and performance abilities, respectively, as independent variables. Regional analyses of the interaction effects were then performed with multiple regressions on the DTI indices with age, sex, and verbal/performance abilities and verbal/performance abilities × age as independent variables. As there were few effects on AD and the effects on MD to a substantial degree overlapped with those on RD, only results for FA and RD are reported for the regional analyses. Both uncorrected and Bonferroni‐corrected P‐values for the number of tracts investigated are presented for the regional analyses. Because the regional analyses are considered follow‐up analyses that are intended to aid in interpreting the results from the global analyses where corrections for multiple comparisons were applied, the discussion was focused on the uncorrected TOI results.
Finally, for those TOIs where the interaction term yielded a significant contribution, FA and RD were plotted as a function of age. Here, the sample was split in two equally large groups based on raw verbal abilities scores. Group assignment was done for each year separately in the age range 8–20 and for each 2 years in the age range 21–30 and by splitting by the median within these brackets. Thus, for each of these age brackets, the sample was split into equally large groups with no overlap in raw verbal abilities scores. Across all ages, each group consisted of 84 participants. Mean verbal abilities score (z‐score) for the average verbal abilities group was −0.31 (SD = 0.92, range = −2.78–0.78), while mean score for the high verbal abilities group was 0.31 (SD = 0.92, range = −2.01–1.52). There was a significant difference between the two groups (t(166) = 4.31, P < 0.001). These plots were included to explore the relationships between verbal abilities and age differences in FA and RD in those TOIs where the continuous interaction term yielded a significant linear contribution. Exponential curves were calculated for both groups. As quadratic fits generally seemed to introduce nonmonotonicity in the age‐relationships, exponential fits yielded more plausible descriptions of the developmental trajectories. However, no formal statistics were performed to confirm this. We used exponential fitting equations of the form x = b 1 + b 2 × e (−age/t), where b 1 is the estimated value at the asymptote, b 2 is the difference between the b 1 value and the estimated value at age zero, and t is a time constant indicating rate of development. Upon visual inspection, the exponential fits were deemed to represent the data well. However, more complex models could also have been investigated.
RESULTS
Age‐Related Changes
Figure 2 shows verbal and performance abilities and DTI indices averaged across the skeleton voxels plotted as a function of age. Both linear and exponential models were fitted and R 2 for both models are reported in the figure. Marked age‐related increases in both verbal and performance abilities were observed and the exponential models showed most pronounced improvement in late childhood and early adolescence. Age‐related increases in FA and decreases in MD, RD, and AD were also observed. Independent samples t‐tests showed no significant sex differences in any of the average DTI measures from the entire skeleton. Possible sex differences in the DTI‐age relationships were tested on a voxel‐by‐voxel basis with general linear models (GLMs) contrasting the effects of age on DTI indices in females versus males. No significant sex differences in the relationships between age and FA, MD, RD, or AD were found. Pearson correlations between DTI indices in the TOIs and age, sex, and intellectual abilities are shown in Supporting Information Table I.
Figure 2.
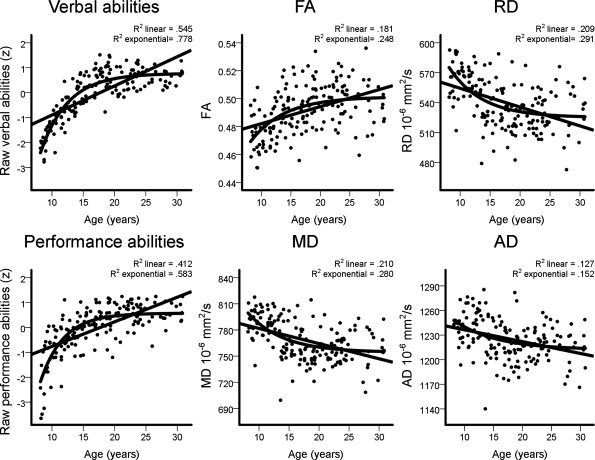
Age‐related changes in intellectual abilities and WM microstructure. Z‐transformed raw verbal and performance abilities scores and average fractional anisotropy (FA), mean diffusivity (MD), radial diffusivity (RD), and axial diffusivity (AD) from the skeleton voxels plotted as a function of age. Both linear and exponential models were fitted and explained variance of both models is shown in the figure.
Global Analyses
Relationships between intellectual abilities and WM microstructure
The relationships between verbal and performance abilities, respectively, and DTI indices, were tested on a voxel‐by‐voxel basis with GLMs. The effects of age and sex were controlled by including these measures as explanatory variables in the models. Statistical inference was done with permutation‐based corrections for multiple comparisons (see Methods for further details). Figure 3 shows 3D‐renderings of the results from the analyses with verbal abilities. Two clusters of voxels showing positive correlations between FA and verbal abilities were found. The largest cluster encompassed frontoparietal regions and areas extending into the brain stem in the left hemisphere. The other cluster was located around the anterior thalamic radiation in the right hemisphere. In total 4.6% of the skeleton voxels showed a positive relationship between FA and verbal abilities. MD was negatively related to verbal abilities in large parts of the skeleton in the left hemisphere, including regions within the frontal, parietal, superior temporal, and occipital lobes, as well as in parietal regions in the right hemisphere and in regions around the body of corpus callosum. A negative association between MD and verbal abilities was shown in 18.2% of the skeleton. RD showed similar negative relationships with verbal abilities as did MD in the left hemisphere with the addition of associations extending into the brain stem, but no relations in the parietal lobe in the right hemisphere. In total, RD was negatively related to verbal abilities in 15.0% of the skeleton. No significant relationships were observed in the opposite directions for FA, MD, or RD. For AD, only two small bilateral clusters around the mid‐anterior region of the body of corpus callosum were negatively related to verbal abilities (0.5% of the skeleton voxels). The analyses were repeated for each of the five age groups in Table I. No relationships between verbal abilities and DTI parameters were found for these smaller groups, except in the next oldest group aged 20–23 years, where a negative relationship with FA in a very small cluster (<0.1%), and positive relationships with MD (3.3%), RD (4.0%), and AD (0.4%) were found. To explore possible sex differences, we performed GLMs contrasting the effects of verbal abilities on DTI indices in females versus males. No sex differences in the relationships between verbal abilities and FA, MD, or RD were found. Males showed a stronger relationship between verbal abilities and AD in a small cluster around the cortico‐spinal tract in the right hemisphere (1.1% of the skeleton).
Figure 3.
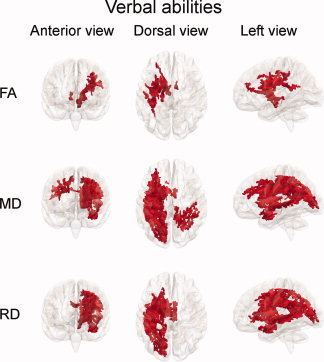
Relationships between verbal abilities and WM microstructure. Results from GLMs testing linear effects of verbal abilities on fractional anisotropy (FA), mean diffusivity (MD), and radial diffusivity (RD), while regressing out the effects of age and sex. Results are shown as 3D‐renderings in anterior, dorsal, and left views of the statistical P‐maps of the TBSS skeleton, displayed on a semitransparent template brain from FreeSurfer (fsaverage). Red areas indicate voxels with positive significant relationships between verbal abilities and FA and negative significant relationships between verbal abilities and MD and RD (P < 0.05, corrected for multiple comparisons across space). In total, FA, MD, and RD were correlated with verbal abilities in 4.6, 18.2, and 15.0% of the skeleton voxels, respectively.
The analyses were repeated with performance abilities, and the results are shown in Figure 4. FA was positively related to performance abilities in the left hemisphere in frontoparietal regions and in regions extending into the brain stem, and in total in 1.6% of the skeleton voxels. MD was negatively related to performance abilities in large parts of the skeleton in the left hemisphere, with relations seen within the frontal, parietal, superior temporal, and occipital lobes, as well as around the anterior thalamic radiation and the cortico‐spinal tract, in total in 9.5% of the skeleton voxels. RD showed similar results as MD with additional associations extending further into the temporal lobe and the brain stem, and in total in 11.0% of the skeleton. No significant relationships with performance abilities were observed in the right hemisphere for any of the DTI indices. Further, no significant relations were observed in the opposite directions for FA, MD, or RD or in any direction for AD. The analyses were repeated for each of the five age groups in Table I. No relationships between performance abilities and DTI parameters were found for these smaller groups. GLMs contrasting the effects of performance abilities on DTI indices in females versus males showed no sex differences in the relationships between performance abilities and FA, MD, or RD. As for verbal abilities, males showed a stronger relationship between performance abilities and AD in a small cluster around the cortico‐spinal tract in the right hemisphere (0.4% of the skeleton voxels).
Figure 4.
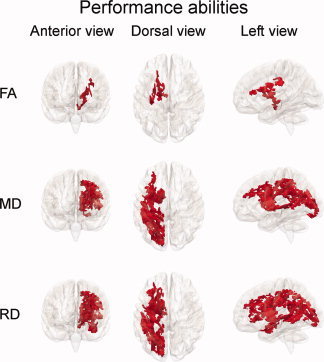
Relationships between performance abilities and WM microstructure. Results from GLMs testing linear effects of performance abilities on fractional anisotropy (FA), mean diffusivity (MD), and radial diffusivity (RD), while regressing out the effects of age and sex. Red areas indicate voxels with positive significant relationships between performance abilities and FA and negative significant relationships between performance abilities and MD and RD (P < 0.05, corrected for multiple comparisons across space). In total, FA, MD, and RD were correlated with performance abilities in 1.6, 9.5, and 11.0% of the skeleton voxels, respectively.
Relationships between intellectual abilities and development of WM microstructure
To investigate the relationships between intellectual abilities and development of WM microstructure, an interaction term of abilities × age was added to the GLMs. Figure 5 shows the results from the GLMs testing unique linear effects of the interaction term verbal abilities × age on DTI indices, while regressing out the effects of age, sex, and verbal abilities. The interaction‐term was negatively related to FA bilaterally in the frontal and parietal lobes and in regions around the anterior thalamic radiation and the cortico‐spinal tract, and in the right occipital lobe, in total in 18.8% of the skeleton voxels. MD showed widespread positive relationships with the interaction term bilaterally in the frontal, parietal, and occipital lobes, bilaterally in regions around the anterior thalamic radiation and the cortico‐spinal tract and in the left superior temporal lobe, in total in 32.3% of the skeleton. RD showed similar results as MD, with associations in total in 31.9% of the skeleton voxels. In contrast to MD, RD showed associations in the superior temporal lobe bilaterally and in the right cerebellum, while the associations in the occipital lobe were restricted to the right hemisphere. For these three DTI indices, relations with the interaction term verbal abilities × age were also seen in regions bilaterally around the body of corpus callosum. No significant relations were observed in the opposite directions for FA, MD, or RD or in any direction for AD. No significant relationships between the interaction term performance abilities × age and any of the DTI indices were found. Details of all the clusters showing significant results in the global analyses are reported in Supporting Information Table II.
Figure 5.
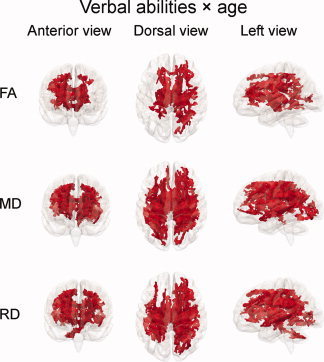
Relationships between verbal abilities and development of WM microstructure. Results from GLMs testing linear unique effects of the interaction term verbal abilities × age on fractional anisotropy (FA), mean diffusivity (MD), and radial diffusivity (RD), while regressing out the effects of age, sex, and verbal abilities. Red areas indicate voxels with negative significant relationships between the interaction term and FA and positive significant relationships between the interaction term and MD and RD (P < 0.05, corrected for multiple comparisons across space). In total, FA, MD, and RD were correlated with verbal abilities × age in 18.8, 32.3, and 31.9% of the skeleton voxels, respectively.
Regional Analyses
Relationships between intellectual abilities and WM microstructure
To further investigate the regional specificity of the relationships observed, we performed multiple regressions on mean FA and RD in voxels intersecting both the WM skeleton and the TOIs with age, sex, and verbal and performance abilities, respectively as independent variables. The results for verbal abilities are shown in Table II. Positive significant relations with FA were found bilaterally in the superior longitudinal fasciculi and in the left anterior thalamic radiation and cingulum‐cingulate gyrus. Negative relations with RD were found bilaterally in the superior longitudinal fasciculi, the left cingulum‐cingulate gyrus, inferior longitudinal fasciculus and uncinate fasciculus, and in forceps major. With Bonferroni‐corrected P‐values, only the relationship between verbal abilities and RD in the left superior longitudinal fasciculus remained significant.
Table II.
Regional relationships between verbal abilities and WM microstructure
| Age β | Sex β | Verbal abilities β | Model R 2 | Model F | |
|---|---|---|---|---|---|
| FA | |||||
| Anterior thalamic radiation Left | 0.19 | −0.16 | 0.15 | 0.18 | 12.163 |
| Anterior thalamic radiation Right | 0.24 | −0.20 | 0.20 | 0.20 | 13.853 |
| Cingulum‐cingulate gyrus Left | 0.35 | −0.13 | 0.20 | 0.28 | 21.374 |
| Cingulum‐cingulate gyrus Right | 0.46 | −0.15 | 0.15 | 0.35 | 29.631 |
| Cingulum‐hippocampus gyrus Left | 0.61 | −0.18 | 0.02 | 0.41 | 38.222 |
| Cingulum‐hippocampus gyrus Right | 0.53 | −0.18 | 0.02 | 0.32 | 25.910 |
| Cortico‐spinal tract Left | 0.04 | −0.15 | 0.21 | 0.08 | 4.498 |
| Cortico‐spinal tract Right | 0.24 | −0.14 | 0.10 | 0.12 | 7.297 |
| Inferior longitudinal fasciculus Left | 0.27 | −0.07 | 0.15 | 0.16 | 10.318 |
| Inferior longitudinal fasciculus Right | 0.40 | −0.10 | 0.08 | 0.22 | 15.464 |
| Superior longitudinal fasciculus Left | 0.12 | −0.09 | 0.29 | 0.16 | 10.036 |
| Superior longitudinal fasciculus Right | 0.20 | −0.14 | 0.22 | 0.17 | 11.066 |
| Uncinate fasciculus Left | 0.05 | −0.09 | 0.21 | 0.07 | 4.119 |
| Uncinate fasciculus Right | 0.24 | −0.10 | 0.06 | 0.09 | 5.453 |
| Forceps major | 0.03 | 0.05 | 0.22 | 0.06 | 3.540 |
| Forceps minor | 0.13 | −0.11 | 0.07 | 0.04 | 2.513 |
| RD | |||||
| Anterior thalamic radiation Left | −0.19 | 0.08 | −0.19 | 0.13 | 8.481 |
| Anterior thalamic radiation Right | −0.26 | 0.16 | −0.13 | 0.15 | 9.572 |
| Cingulum‐cingulate gyrus Left | −0.32 | 0.04 | −0.21 | 0.25 | 18.120 |
| Cingulum‐cingulate gyrus Right | −0.45 | 0.10 | −0.15 | 0.32 | 25.760 |
| Cingulum‐hippocampus gyrus Left | −0.64 | 0.13 | −0.01 | 0.43 | 41.135 |
| Cingulum‐hippocampus gyrus Right | −0.59 | 0.15 | 0.03 | 0.33 | 27.192 |
| Cortico‐spinal tract Left | −0.17 | 0.12 | −0.20 | 0.13 | 8.182 |
| Cortico‐spinal tract Right | −0.37 | 0.14 | −0.04 | 0.18 | 11.590 |
| Inferior longitudinal fasciculus Left | −0.24 | 0.01 | −0.25 | 0.20 | 13.860 |
| Inferior longitudinal fasciculus Right | −0.48 | 0.09 | −0.06 | 0.27 | 20.614 |
| Superior longitudinal fasciculus Left | −0.10 | 0.02 | −0.37 | 0.20 | 13.734 |
| Superior longitudinal fasciculus Right | −0.24 | 0.07 | −0.23 | 0.20 | 13.280 |
| Uncinate fasciculus Left | −0.10 | 0.07 | −0.22 | 0.09 | 5.664 |
| Uncinate fasciculus Right | −0.35 | 0.12 | −0.10 | 0.19 | 12.956 |
| Forceps major | −0.03 | −0.13 | −0.22 | 0.08 | 4.748 |
| Forceps minor | −0.20 | 0.05 | −0.07 | 0.07 | 3.907 |
Multiple regressions on mean fractional anisotropy (FA) and radial diffusivity (RD) in voxels intersecting both the WM skeleton and the tracts of interest with age, sex and verbal abilities as independent variables. Z‐transformed raw verbal intelligence scores were used. Bold characters indicate P < 0.05 uncorrected and underlined characters indicate P < 0.05 Bonferroni corrected. df = 3,164.
The regional results for performance abilities are shown in Table III. Positive significant relations with FA were observed in the left superior longitudinal fasciculus and in forceps major. Negative relations with RD were found bilaterally in the superior longitudinal fasciculi, the left inferior longitudinal fasciculus, and forceps major. With Bonferroni corrections, as for verbal abilities, only the relationship between performance abilities and RD in the left superior longitudinal fasciculus remained significant.
Table III.
Regional relationships between performance abilities and WM microstructure
| Age β | Sex β | Performance abilities β | Model R 2 | Model F | |
|---|---|---|---|---|---|
| FA | |||||
| Anterior thalamic radiation Left | 0.25 | −0.15 | 0.18 | 0.17 | 11.410 |
| Anterior thalamic radiation Right | 0.28 | −0.20 | 0.16 | 0.20 | 13.566 |
| Cingulum‐cingulate gyrus Left | 0.47 | −0.13 | 0.05 | 0.26 | 19.589 |
| Cingulum‐cingulate gyrus Right | 0.51 | −0.15 | 0.09 | 0.35 | 28.895 |
| Cingulum‐hippocampus gyrus Left | 0.62 | −0.18 | 0.01 | 0.41 | 38.192 |
| Cingulum‐hippocampus gyrus Right | 0.54 | −0.18 | 0.01 | 0.32 | 25.884 |
| Cortico‐spinal tract Left | 0.09 | −0.15 | 0.16 | 0.07 | 4.167 |
| Cortico‐spinal tract Right | 0.27 | −0.14 | 0.07 | 0.12 | 7.156 |
| Inferior longitudinal fasciculus Left | 0.29 | −0.07 | 0.14 | 0.16 | 10.375 |
| Inferior longitudinal fasciculus Right | 0.40 | −0.10 | 0.09 | 0.22 | 15.637 |
| Superior longitudinal fasciculus Left | 0.17 | −0.09 | 0.25 | 0.15 | 9.941 |
| Superior longitudinal fasciculus Right | 0.25 | −0.13 | 0.18 | 0.16 | 10.733 |
| Uncinate fasciculus Left | 0.12 | −0.09 | 0.14 | 0.06 | 3.558 |
| Uncinate fasciculus Right | 0.24 | −0.10 | 0.08 | 0.09 | 5.564 |
| Forceps major | 0.06 | 0.06 | 0.21 | 0.06 | 3.763 |
| Forceps minor | 0.10 | −0.10 | 0.13 | 0.05 | 2.937 |
| RD | |||||
| Anterior thalamic radiation Left | −0.24 | 0.08 | −0.16 | 0.13 | 8.290 |
| Anterior thalamic radiation Right | −0.24 | 0.16 | −0.16 | 0.16 | 10.192 |
| Cingulum‐cingulate gyrus Left | −0.43 | 0.04 | −0.07 | 0.23 | 16.421 |
| Cingulum‐cingulate gyrus Right | −0.49 | 0.09 | −0.11 | 0.32 | 25.413 |
| Cingulum‐hippocampus gyrus Left | −0.62 | 0.13 | −0.05 | 0.43 | 41.403 |
| Cingulum‐hippocampus gyrus Right | −0.57 | 0.15 | 0.00 | 0.33 | 27.137 |
| Cortico‐spinal tract Left | −0.23 | 0.12 | −0.14 | 0.12 | 7.684 |
| Cortico‐spinal tract Right | −0.38 | 0.13 | −0.04 | 0.18 | 11.590 |
| Inferior longitudinal fasciculus Left | −0.28 | 0.01 | −0.22 | 0.20 | 14.033 |
| Inferior longitudinal fasciculus Right | −0.46 | 0.09 | −0.09 | 0.28 | 20.937 |
| Superior longitudinal fasciculus Left | −0.18 | 0.02 | −0.30 | 0.19 | 12.731 |
| Superior longitudinal fasciculus Right | −0.26 | 0.06 | −0.23 | 0.20 | 13.757 |
| Uncinate fasciculus Left | −0.17 | 0.07 | −0.14 | 0.08 | 4.897 |
| Uncinate fasciculus Right | −0.34 | 0.11 | −0.12 | 0.20 | 13.302 |
| Forceps major | −0.02 | −0.14 | −0.27 | 0.10 | 6.038 |
| Forceps minor | −0.18 | 0.05 | −0.11 | 0.07 | 4.229 |
Multiple regressions on mean fractional anisotropy (FA) and radial diffusivity (RD) in voxels intersecting both the WM skeleton and the tracts of interest with age, sex and performance abilities as independent variables. Z‐transformed raw performance intelligence scores were used. Bold characters indicate P < 0.05 uncorrected and underlined characters indicate P < 0.05 Bonferroni corrected. df = 3,164.
Relationships between verbal abilities and development of WM microstructure
Next, we performed multiple regressions predicting FA and RD in TOIs with age, sex, verbal abilities, and verbal abilities × age as independent variables. The results are shown in Table IV. Negative significant relationships between the interaction term and FA were found bilaterally in the anterior thalamic radiation and the cortico‐spinal tract, and in the right inferior and superior longitudinal fasciculi. For RD, positive significant relations with the interaction term were observed bilaterally in the anterior thalamic radiation and the cortico‐spinal tract, in the left cingulum‐cingulate gyrus and cingulum‐hippocampus gyrus and in the right superior longitudinal fasciculus. After Bonferroni corrections, only the bilateral relationships between verbal abilities × age and RD in the anterior thalamic radiation remained significant. The same analyses were repeated for performance abilities, where the only uncorrected significant relationships with the interaction term performance abilities × age was found for RD in forceps major (β = 0.44, P = 0.047).
Table IV.
Regional relationships between verbal abilities and development of WM microstructure
| Age β | Sex β | Verbal abilities β | Verbal abilities × age β | Model R 2 | Model F | |
|---|---|---|---|---|---|---|
| FA | ||||||
| Anterior thalamic radiation Left | 0.28 | −0.16 | 0.67 | −0.52 | 0.20 | 10.361 |
| Anterior thalamic radiation Right | 0.36 | −0.21 | 0.77 | −0.69 | 0.24 | 12.785 |
| Cingulum‐cingulate gyrus Left | 0.42 | −0.13 | 0.51 | −0.37 | 0.29 | 16.786 |
| Cingulum‐cingulate gyrus Right | 0.51 | −0.16 | 0.38 | −0.28 | 0.36 | 22.677 |
| Cingulum‐hippocampus gyrus Left | 0.62 | −0.18 | 0.08 | −0.07 | 0.41 | 28.535 |
| Cingulum‐hippocampus gyrus Right | 0.55 | −0.18 | 0.11 | −0.11 | 0.32 | 19.394 |
| Cortico‐spinal tract Left | 0.14 | −0.16 | 0.67 | −0.57 | 0.10 | 4.593 |
| Cortico‐spinal tract Right | 0.37 | −0.14 | 0.68 | −0.71 | 0.16 | 7.569 |
| Inferior longitudinal fasciculus Left | 0.31 | −0.07 | 0.32 | −0.20 | 0.16 | 7.873 |
| Inferior longitudinal fasciculus Right | 0.50 | −0.11 | 0.52 | −0.54 | 0.24 | 13.089 |
| Superior longitudinal fasciculus Left | 0.17 | −0.10 | 0.54 | −0.30 | 0.16 | 7.873 |
| Superior longitudinal fasciculus Right | 0.33 | −0.14 | 0.81 | −0.72 | 0.21 | 10.723 |
| Uncinate fasciculus Left | 0.12 | −0.09 | 0.52 | −0.38 | 0.08 | 3.607 |
| Uncinate fasciculus Right | 0.33 | −0.10 | 0.46 | −0.49 | 0.11 | 4.994 |
| Forceps major | 0.11 | 0.05 | 0.57 | −0.43 | 0.08 | 3.300 |
| Forceps minor | 0.21 | −0.11 | 0.44 | −0.45 | 0.06 | 2.588 |
| RD | ||||||
| Anterior thalamic radiation Left | −0.34 | 0.09 | −0.82 | 0.77 | 0.18 | 8.945 |
| Anterior thalamic radiation Right | −0.44 | 0.17 | −0.94 | 1.00 | 0.23 | 11.921 |
| Cingulum‐cingulate gyrus Left | −0.43 | 0.05 | −0.69 | 0.58 | 0.28 | 15.458 |
| Cingulum‐cingulate gyrus Right | −0.53 | 0.10 | −0.50 | 0.43 | 0.34 | 20.503 |
| Cingulum‐hippocampus gyrus Left | −0.72 | 0.13 | −0.37 | 0.44 | 0.44 | 32.576 |
| Cingulum‐hippocampus gyrus Right | −0.64 | 0.15 | −0.20 | 0.29 | 0.34 | 20.858 |
| Cortico‐spinal tract Left | −0.29 | 0.13 | −0.73 | 0.66 | 0.16 | 7.951 |
| Cortico‐spinal tract Right | −0.49 | 0.14 | −0.56 | 0.63 | 0.21 | 10.527 |
| Inferior longitudinal fasciculus Left | −0.31 | 0.02 | −0.58 | 0.41 | 0.22 | 11.154 |
| Inferior longitudinal fasciculus Right | −0.56 | 0.10 | −0.43 | 0.46 | 0.29 | 16.637 |
| Superior longitudinal fasciculus Left | −0.18 | 0.02 | −0.75 | 0.46 | 0.22 | 11.297 |
| Superior longitudinal fasciculus Right | −0.37 | 0.07 | −0.82 | 0.72 | 0.24 | 12.509 |
| Uncinate fasciculus Left | −0.17 | 0.07 | −0.53 | 0.38 | 0.11 | 4.785 |
| Uncinate fasciculus Right | −0.42 | 0.12 | −0.42 | 0.39 | 0.20 | 10.395 |
| Forceps major | −0.13 | −0.13 | −0.64 | 0.51 | 0.10 | 4.533 |
| Forceps minor | −0.27 | 0.06 | −0.41 | 0.41 | 0.08 | 3.516 |
Multiple regressions on mean fractional anisotropy (FA) and radial diffusivity (RD) in voxels intersecting both the WM skeleton and the tracts of interest with age, sex, verbal abilities and verbal abilities × age as independent variables. Z‐transformed raw verbal intelligence scores were used. Bold characters indicate P < 0.05 uncorrected and underlined characters indicate P < 0.05 Bonferroni corrected. df = 4,163.
Finally, FA and RD were plotted as a function of age for those TOIs where the interaction term verbal abilities × age yielded a significant contribution. Here, the sample was split into average and high verbal abilities groups and exponential curves were fitted for both groups (see Methods for details). The results for FA are shown in Figure 6 and the results for RD are shown in Figure 7. In these TOIs, the models for the high verbal abilities group showed an accelerated increase in FA and decrease in RD in late childhood and a subsequent earlier developmental plateau. The models for the average verbal abilities group showed more steady and prolonged age‐related effects on DTI indices and higher FA and lower RD values in early adulthood.
Figure 6.
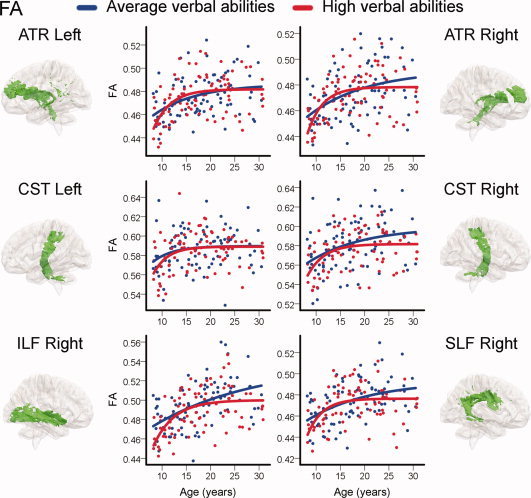
Regional relationships between verbal abilities and development of WM microstructure: Fractional anisotropy (FA). Individual raw FA from atlas tracts and skeleton overlaps are plotted as a function of age. For visualization purposes, the sample was split into two based on raw verbal abilities scores. Group assignment was done for each year separately in the age range 8–20 and for each 2 years in the age range 21–30 and by splitting by the median within these brackets. Exponential models were then fitted for both groups (see Methods for details). The average verbal abilities group is shown in blue, and the high verbal abilities group in red. Only TOIs with significant contributions of the continuous interaction term verbal abilities × age in previous multiple regressions are shown. TOIs shown are: anterior thalamic radiation (ATR), cortico‐spinal tract (CST), inferior longitudinal fasciculus (ILF), and superior longitudinal fasciculus (SLF).
Figure 7.
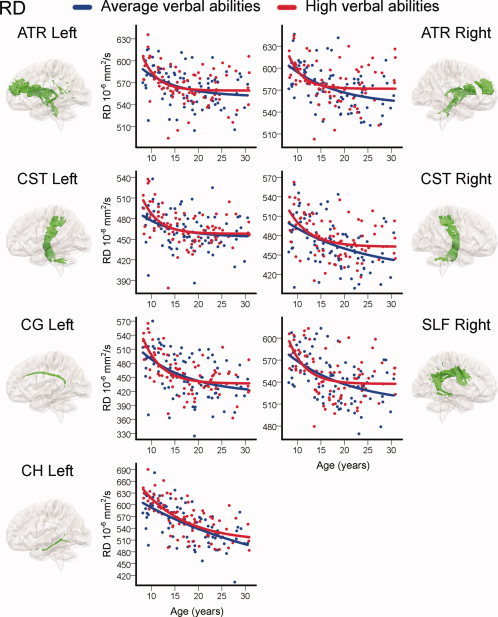
Regional relationships between verbal abilities and development of WM microstructure: radial diffusivity (RD). Individual raw RD from atlas tracts and skeleton overlaps plotted as a function of age. For visualization purposes, the sample was split in two based on raw verbal abilities scores. Group assignment was done for each year separately in the age range 8–20 and for each 2 years in the age range 21–30 and by splitting by the median within these brackets. Exponential models were then fitted for both groups (see Methods for details). The average verbal abilities group is shown in blue, and the high verbal abilities group in red. Only TOIs with significant contributions of the continuous interaction term verbal abilities × age in previous multiple regressions are shown. TOIs shown are: anterior thalamic radiation (ATR), cortico‐spinal tract (CST), cingulum‐cingulate gyrus (CG), superior longitudinal fasciculus (SLF), and cingulum‐hippocampus gyrus (CH).
DISCUSSION
The present cross‐sectional results indirectly demonstrate that maturation of WM microstructure is related to general intellectual abilities, i.e., verbal abilities. More specifically, the results indicate that children with different verbal function may show different developmental trajectories of DTI indices in large areas of the brain. In addition, DTI indices of WM microstructure were related to both verbal and performance abilities independently of age. A previous study has demonstrated different maturational patterns of the cerebral cortex for children at different intellectual levels [Shaw et al., 2006], but this has not been investigated for WM microstructure. Implications of the results are discussed below.
Neuroimaging studies suggest that higher‐order cognitive functions are supported by distributed cortical regions [Shaw, 2007], and that the integrity of the connecting WM fibers play a crucial role in the functional connectivity between the various components in the networks [Deary et al., 2006; Westlye et al., 2009]. The present study yielded several new findings about the relationships between WM microstructure and general intellectual abilities in development. First, both verbal and performance abilities were associated with DTI indices, indicating a relationship between WM microstructure and general cognitive functions in late childhood, adolescence, and young adulthood. A striking hemispheric asymmetry was notable with stronger and more widespread associations seen in the left hemisphere for both verbal and performance abilities. The extensive and lateralized nature of the associations is likely a function of both the sensitivity benefits of the cluster enhancement method employed [Smith and Nichols, 2009] coupled with enhanced statistical sensitivity from a fairly large sample, and a reflection of anatomically unspecific and distributed relationships between general intellectual abilities and neural connectivity. When the analyses were restricted to much smaller age‐ranges and groups of participants, the results were not replicated. Second, verbal, but not performance abilities, were associated with developmental differences in DTI indices in widespread regions in both hemispheres. The results suggest that participants with high verbal abilities likely experience an accelerated development of WM microstructure in late childhood and a subsequent earlier developmental plateau, indicating an earlier development of neuroanatomical connectivity. In contrast, participants with average verbal abilities likely experience more steady and prolonged age‐related effects on DTI indices.
The present study is the first to investigate whole‐brain associations between DTI indices and verbal and performance abilities in healthy children and adolescents. Because of a limited sample size, Schmithorst et al. [ 2005] only investigated the relationships between FA and verbal and performance abilities in regions displaying positive correlations with full scale intelligence. A nonsignificant difference was observed for correlations between FA in a left parietal region and verbal and performance abilities, respectively, with verbal abilities showing a stronger relationship. Extending this, our results showed that independently of age and sex, both verbal and performance abilities were positively related to FA and negatively related to MD and RD in large regions of WM, primarily in the left hemisphere and most pronounced in frontal and parietal areas. Regional analyses confirmed the left hemisphere dominance, although associations were also seen in the right superior longitudinal fasciculus. Further, associations were more widespread for verbal abilities than for performance abilities, although the regions were largely overlapping. Associations were also found around the body of corpus callosum, indicating that WM microstructure in interhemispheric pathways modulate intellectual abilities [Luders et al., 2009]. Overall, the results are consistent with distributed models of intelligence like the Parieto‐Frontal Integration Theory [Colom et al., 2009; Jung and Haier, 2007]. This model proposes a neural network that underpins individual differences in intellectual abilities that includes association cortices within parietal and frontal regions and WM structures linking these areas (i.e., arcuate fasciculus, superior longitudinal fasciculus).
As expected, verbal abilities were related to DTI indices primarily in the left hemisphere. Regional analyses showed relations with both FA and RD in the left cingulum‐cingulate gyrus and bilaterally in the superior longitudinal fasciculi and with either FA or RD in several additional TOIs in the left hemisphere and in forceps major. This is consistent with previous studies showing associations between various verbal abilities and DTI indices in the left hemisphere. For example, a positive correlation between FA in a left temporo‐parietal area and reading skills in both reading‐impaired and normal adults has been reported [Klingberg et al., 2000], and a similar relationship in healthy children and adolescents has also been shown [Nagy et al., 2004]. Recently, Lebel and Beaulieu [ 2009] reported a relationship between lateralization of the arcuate fasciculus, a subdivision of the superior longitudinal fasciculus involved in language processing and implicated in intelligence and reasoning tasks, and specific verbal abilities in children. Another study reported positive bilateral correlations between FA in the arcuate fasciculi and tests of verbal abilities in adolescent males [Ashtari et al., 2007]. Our results expand on these previous studies by showing associations between general verbal abilities and WM microstructure primarily in the left hemisphere in children and adolescents. Our results also expand on a previous study by Sowell et al. [ 2004], where gain in verbal intelligence correlated with cortical thinning in the left lateral dorsofrontal and lateral parietal regions.
Surprisingly, our global analyses showed associations between performance abilities and DTI indices also primarily in the left hemisphere. However, in the regional analyses bilateral relations were observed with RD in the superior longitudinal fasciculi in addition to the left inferior longitudinal fasciculus and forceps major. The left hemisphere dominance was unexpected, since common tests used to measure performance abilities are assumed to particularly rely upon the right parietal region [Lezak et al., 2004]. Interestingly, Sowell et al. [ 2004] did not find an expected right hemisphere association between cortical thinning in late childhood and gain in performance intelligence, but instead observed an association with cortical thickening in a left medial occipital region. Further, other functions besides visuospatial abilities are also likely involved in common tests used to measure performance intelligence. Performance on matrix reasoning has for example been shown to be associated with measures of verbal abstract reasoning and verbal fluency suggesting a strong verbal mediation element [Dugbartey et al., 1999]. Others have reported a link between working memory capacity and FA in the left frontal lobe [Nagy et al., 2004]. One might speculate whether this can partly explain the results showing left hemisphere dominance for associations between performance abilities and WM microstructure in the present study. In addition, all the participants in the present study were right handed, and it is therefore likely that they have general left hemisphere dominance.
Intellectual abilities have previously been shown related to dynamic properties of cortical maturation [Shaw et al., 2006], but never before to developmental trajectories of WM microstructure. The present results show that verbal, but not performance abilities, are related to developmental differences in WM microstructure in widespread regions in both hemispheres. The widespread nature of the relations with verbal abilities indicates an anatomically unspecific association with WM microstructure maturation. Regional analyses showed relations across DTI indices bilaterally in the anterior thalamic radiation and the cortico‐spinal tract and in the right superior longitudinal fasciculus. The anterior thalamic radiation projects from the thalamus predominantly into the frontal lobes, the cortico‐spinal tract is a descending pathway mainly from the precentral motor cortex into the brain stem and the superior longitudinal fasciculus is located at the supero‐lateral side of the putamen and forms an arc projecting fibers into all the four lobes of the cerebrum [Mori et al., 2005]. All these fiber bundles encompass large areas of the brain. Thus, the regional analyses also indicate anatomically widespread relationships between general verbal abilities and development of neural connectivity.
Previous studies have shown decelerating age‐related increases in FA and decreases in MD and RD during childhood, adolescence, and even early adulthood [Lebel et al., 2008; Tamnes et al., in press]. In the present study, we found that these age‐related changes are related to higher‐order cognitive functions. Note however that inferences regarding developmental trajectories do not necessarily follow from the current study, as there are serious challenges involved in drawing inferences about longitudinal processes from cross‐sectional studies [Kraemer et al., 2000]. For instance, we do not know with certainty that the children with high verbal abilities go on to be adults with high verbal abilities. Previous studies have, however, shown substantial stability in intellectual abilities differences from childhood to late life [Deary et al., 2000]. Given this premise, the current cross‐sectional results suggest that participants with high verbal abilities may show an accelerated development of WM microstructure in late childhood and a subsequent earlier developmental plateau, indicating faster and earlier development of neuroanatomical connectivity. Participants with average verbal abilities likely experience more steady and prolonged age‐related effects on DTI indices, indicating continued development of WM microstructure in the investigated TOIs in early adulthood. These conclusions need to be verified with longitudinal data. Further, surprisingly, the present results indicate that the average verbal abilities group had higher FA and lower RD values in early adulthood. The interpretation of this finding is unclear and needs to be replicated. As discussed above, the sample as a whole showed age‐independent positive relations between both verbal and performance abilities and FA and negative relations between abilities and MD and RD as expected. One might speculate that WM microstructure may be more strongly related to cognitive abilities during periods of marked change, such as in brain maturation, than in adulthood. In neurologically intact adults with fairly stable structural characteristics, such crude structural measures might be relatively less related to cognitive abilities. Straightforward strong relationships between brain volumes and specific cognitive variables have for example been hard to establish for groups of healthy adults [Van Petten, 2004; Van Petten et al., 2004]. For instance, based on a meta‐analysis of studies on the relationship between hippocampal volume and memory ability, van Petten [ 2004] suggests that the discrepancies in the reported relationships in adults may result either from random variability around a mean of zero correlation or arise from subtle but genuine relationships. This could also be possible explanations for the apparent relationships between DTI indices and verbal abilities in early adulthood in the present study. Further, the relationships between DTI indices and cognitive and behavioral performance measures are complicated. A number of neurobiological factors influence DTI indices and the relative roles of these factors might also be age‐dependent.
The finding that developmental differences in WM microstructure are related to level of verbal abilities might indicate that individuals with earlier maturation of neuronal connectivity also develop faster with respect to general verbal abilities, or alternatively that a higher level of verbal abilities drive WM maturation. Twin studies have demonstrated that the observed relationships between intelligence and both brain morphology and WM microstructure to a substantial degree are mediated by common genetic factors [Chiang et al., 2009; Posthuma et al., 2002]. The combination of current in vivo neuroimaging techniques such as DTI and further explorations of the roles of specific genes and genome‐wide scans will likely improve our understanding of the neural networks that underpin higher‐order cognitive abilities and the development of these functions in childhood and adolescence.
The results in the present study showed more widespread and pronounced relationships between both verbal and performance abilities and MD and RD, than with FA. The same was the case for verbal abilities × age. As small or no relations were observed with AD, RD likely account for most of the effects on MD as this index reflects average magnitude of water diffusion. RD has also previously been shown to be sensitive to WM development in childhood and adolescence [Lebel et al., 2008; Tamnes et al., in press]. Importantly, DTI parameters are sensitive to general diffusion properties of brain tissue and are not selective markers of specific neurobiological properties. Studies on mice have shown that RD is affected by dysmyelination, demyelination, and myelin degeneration [Ou et al., 2009; Song et al., 2002, 2003, 2005]. However, it does not logically follow that individual differences in RD reliably indicates individual differences in myelination. Factors other that myelin, such as the within‐voxel directional coherence (e.g., crossing fibers), the local density of fibers and partial voluming with grey matter and cerebrospinal fluid, also contribute significantly to RD. It has been argued that the hypothesized differences in myelination are perhaps too hastily considered as an explanation for age‐related differences in DTI parameters, to the exclusion of other possible factors [Paus, in press]. In support to this, a recent study investigating the correspondence between myelin‐water fraction (MWF), a measure of myelin content estimated from the short T2‐component signal, and DTI parameters in adult participants, found some degree of correlation between MWF and FA and RD across, but not within various brain regions [Madler et al., 2008]. Investigating multiple DTI measures when studying WM‐cognition relationships may yield additional information to better characterize tissue microstructure. Still, it must be stressed that the specific neurobiological meaning of DTI parameters is unclear. Multi‐modal imaging and combination of in vivo and ex vivo methods might increase our understanding of specific neurobiological processes underlying WM maturation and WM‐cognition relationships [Paus, in press].
As this is the first study to investigate the relationships between intellectual abilities and development of WM microstructure and there are challenges involved in drawing inferences about longitudinal processes from cross‐sectional data, the current results should be replicated in longitudinal studies. In the present study, the relationships between intellectual abilities and DTI parameters were explored by statistically controlling for the linear effects of age. Although residual effects of age could still contribute to the results, we believe that controlling for the linear effects did remove the major part of this influence. Further, the sample investigated scored above population mean with respect to intellectual abilities and may not be considered representative of the full range of individual differences. Thus, the comparisons in the present study were done between high and average functioning children and adolescents.
CONCLUSION
The results of the present study suggest that children and adolescents with different levels of verbal abilities may have different maturational trajectories of WM microstructure in widespread areas of the brain. Although longitudinal studies are needed to validate inferences regarding developmental trajectories from cross‐sectional data, the results indicate that children with high verbal abilities show an initial accelerated WM maturation, before reaching a plateau. In contrast, the average verbal abilities group may show a more protracted developmental pattern, with longer time used to reach the plateau or continued development in early adulthood. This implies that intellectual development is related to WM maturation, which complements previous findings of the significance of cortical development for general cognitive function. Additionally, we found that, independently of age, both verbal and performance abilities are related to WM microstructure, predominantly in the left hemisphere. The extensive nature of the associations is consistent with distributed models of higher‐order cognitive functions. The present results should be validated with longitudinal data, and ideally data for even younger children.
Supporting information
Additional Supporting Information may be found in the online version of this article.
Supplementary Tables
Acknowledgements
The authors thank V.T. Sells and M. Torstveit for help with data collection. They also thank all the participants and the children's parents. The authors declare no competing financial interests.
REFERENCES
- Ashtari M, Cervellione KL, Hasan KM, Wu J, McIlree C, Kester H, Ardekani BA, Roofeh D, Szeszko PR, Kumra S ( 2007): White matter development during late adolescence in healthy males: A cross‐sectional diffusion tensor imaging study. Neuroimage 35: 501–510. [DOI] [PubMed] [Google Scholar]
- Barnea‐Goraly N, Eliez S, Hedeus M, Menon V, White CD, Moseley M, Reiss AL ( 2003): White matter tract alterations in fragile X syndrome: Preliminary evidence from diffusion tensor imaging. Am J Med Genet B Neuropsychiatr Genet 118B: 81–88. [DOI] [PubMed] [Google Scholar]
- Beaulieu C ( 2002): The basis of anisotropic water diffusion in the nervous system—A technical review. NMR Biomed 15: 435–455. [DOI] [PubMed] [Google Scholar]
- Casey BJ, Tottenham N, Liston C, Durston S ( 2005): Imaging the developing brain: What have we learned about cognitive development? Trends Cogn Sci 9: 104–110. [DOI] [PubMed] [Google Scholar]
- Chiang MC, Barysheva M, Shattuck DW, Lee AD, Madsen SK, Avedissian C, Klunder AD, Toga AW, McMahon KL, de Zubicaray GI, Wright MJ, Srivastava A, Balov N, Thompson PM ( 2009): Genetics of brain fiber architecture and intellectual performance. J Neurosci 29: 2212–2224. [DOI] [PMC free article] [PubMed] [Google Scholar]
- Choi YY, Shamosh NA, Cho SH, DeYoung CG, Lee MJ, Lee JM, Kim SI, Cho ZH, Kim K, Gray JR, Lee KH ( 2008): Multiple bases of human intelligence revealed by cortical thickness and neural activation. J Neurosci 28: 10323–10329. [DOI] [PMC free article] [PubMed] [Google Scholar]
- Colom R, Jung RE, Haier RJ ( 2006): Distributed brain sites for the g‐factor of intelligence. Neuroimage 31: 1359–1365. [DOI] [PubMed] [Google Scholar]
- Colom R, Haier RJ, Head K, Álvarez‐Linera J, Quiroga MÁ, Shih PC, Jung RE ( 2009): Gray matter correlates of fluid, crystallized, and spatial intelligence: Testing the P‐FIT model. Intelligence 37: 124–135. [Google Scholar]
- Deary IJ, Whalley LJ, Lemmon H, Crawford JR, Starr JM ( 2000): The stability of individual differences in mental ability from childhood to old age: Follow‐up of the 1932 Scottish mental survey. Intelligence 28: 49–55. [Google Scholar]
- Deary IJ, Bastin ME, Pattie A, Clayden JD, Whalley LJ, Starr JM, Wardlaw JM ( 2006): White matter integrity and cognition in childhood and old age. Neurology 66: 505–512. [DOI] [PubMed] [Google Scholar]
- Dugbartey AT, Sanchez PN, Rosenbaum JG, Mahurin RK, Davis JM, Townes BD ( 1999): WAIS‐III matrix reasoning test performance in a mixed clinical sample. Clin Neuropsychol 13: 396–404. [DOI] [PubMed] [Google Scholar]
- Frangou S, Chitins X, Williams SC ( 2004): Mapping IQ and gray matter density in healthy young people. Neuroimage 23: 800–805. [DOI] [PubMed] [Google Scholar]
- Giedd JN ( 2004): Structural magnetic resonance imaging of the adolescent brain. Ann NY Acad Sci 1021: 77–85. [DOI] [PubMed] [Google Scholar]
- Giorgio A, Watkins KE, Chadwick M, James S, Winmill L, Douaud G, De Stefano N, Matthews PM, Smith SM, Johansen‐Berg H, James AC ( 2010): Longitudinal changes in grey and white matter during adolescence. Neuroimage 49: 94–103. [DOI] [PubMed] [Google Scholar]
- Gogtay N, Giedd JN, Lusk L, Hayashi KM, Greenstein D, Vaituzis AC, Nugent TF III, Herman DH, Clasen LS, Toga AW, Rapoport JL, Thompson PM ( 2004): Dynamic mapping of human cortical development during childhood through early adulthood. Proc Natl Acad Sci USA 101: 8174–8179. [DOI] [PMC free article] [PubMed] [Google Scholar]
- Haier RJ, Jung RE, Yeo RA, Head K, Alkire MT ( 2004): Structural brain variation and general intelligence. Neuroimage 23: 425–433. [DOI] [PubMed] [Google Scholar]
- Jenkinson M, Smith S ( 2001): A global optimization method for robust affine registration of brain images. Med Image Anal 5: 143–156. [DOI] [PubMed] [Google Scholar]
- Jung RE, Haier RJ ( 2007): The parieto‐frontal integration theory (P‐FIT) of intelligence: Converging neuroimaging evidence. Behav Brain Sci 30: 135–154; discussion 154–187. [DOI] [PubMed] [Google Scholar]
- Karama S, Ad‐Dab'bagh Y, Haier RJ, Deary IJ, Lyttelton OC, Lepage C, Evans AC ( 2009): Positive association between cognitive ability and cortical thickness in a representative US sample of healthy 6 to 18 year‐olds. Intelligence 37: 145–155. [DOI] [PMC free article] [PubMed] [Google Scholar]
- Klingberg T, Hedehus M, Temple E, Salz T, Gabrieli JD, Moseley ME, Poldrack RA ( 2000): Microstructure of temporo‐parietal white matter as a basis for reading ability: Evidence from diffusion tensor magnetic resonance imaging. Neuron 25: 493–500. [DOI] [PubMed] [Google Scholar]
- Kraemer HC, Yesavage JA, Taylor JL, Kupfer D ( 2000): How can we learn about developmental processes from cross‐sectional studies, or can we? Am J Psychiatry 157: 163–171. [DOI] [PubMed] [Google Scholar]
- Lebel C, Beaulieu C ( 2009): Lateralization of the arcuate fasciculus from childhood to adulthood and its relation to cognitive abilities in children. Hum Brain Mapp 30: 3563–3573. [DOI] [PMC free article] [PubMed] [Google Scholar]
- Lebel C, Walker L, Leemans A, Phillips L, Beaulieu C ( 2008): Microstructural maturation of the human brain from childhood to adulthood. Neuroimage 40: 1044–1055. [DOI] [PubMed] [Google Scholar]
- Lerch JP, Worsley K, Shaw WP, Greenstein DK, Lenroot RK, Giedd J, Evans AC ( 2006): Mapping anatomical correlations across cerebral cortex (MACACC) using cortical thickness from MRI. Neuroimage 31: 993–1003. [DOI] [PubMed] [Google Scholar]
- Lezak MD, Howieson DB, Loring DW ( 2004): Neuropsychological Assessment, 4th ed Oxford: Oxford University Press. [Google Scholar]
- Li J, Yu C, Li Y, Liu B, Liu Y, Shu N, Song M, Zhou Y, Zhu W, Li K, Jiang T ( 2009): COMT val158met modulates association between brain white matter architecture and IQ. Am J Med Genet B Neuropsychiatr Genet 150B: 375–380. [DOI] [PubMed] [Google Scholar]
- Luders E, Narr KL, Thompson PM, Toga AW ( 2009): Neuroanatomical correlates of intelligence. Intelligence 37: 156–163. [DOI] [PMC free article] [PubMed] [Google Scholar]
- Madler B, Drabycz SA, Kolind SH, Whittall KP, MacKay AL ( 2008): Is diffusion anisotropy an accurate monitor of myelination? Correlation of multicomponent T2 relaxation and diffusion tensor anisotropy in human brain. Magn Reson Imaging 26: 874–888. [DOI] [PubMed] [Google Scholar]
- Mori S, Wakana S, Nagae‐Poetscher LM, Van Zijl PCM ( 2005): MRI Atlas of Human White Matter. Amsterdam: Elsevier. [Google Scholar]
- Nagy Z, Westerberg H, Klingberg T ( 2004): Maturation of white matter is associated with the development of cognitive functions during childhood. J Cogn Neurosci 16: 1227–1233. [DOI] [PubMed] [Google Scholar]
- Nakamura M, McCarley RW, Kubicki M, Dickey CC, Niznikiewicz MA, Voglmaier MM, Seidman LJ, Maier SE, Westin CF, Kikinis R, Shenton ME ( 2005): Fronto‐temporal disconnectivity in schizotypal personality disorder: A diffusion tensor imaging study. Biol Psychiatry 58: 468–478. [DOI] [PMC free article] [PubMed] [Google Scholar]
- Narr KL, Woods RP, Thompson PM, Szeszko P, Robinson D, Dimtcheva T, Gurbani M, Toga AW, Bilder RM ( 2007): Relationships between IQ and regional cortical gray matter thickness in healthy adults. Cereb Cortex 17: 2163–2171. [DOI] [PubMed] [Google Scholar]
- Nichols TE, Holmes AP ( 2002): Nonparametric permutation tests for functional neuroimaging: A primer with examples. Hum Brain Mapp 15: 1–25. [DOI] [PMC free article] [PubMed] [Google Scholar]
- Ou X, Sun SW, Liang HF, Song SK, Gochberg DF ( 2009): The MT pool size ratio and the DTI radial diffusivity may reflect the myelination in shiverer and control mice. NMR Biomed 22: 480–487. [DOI] [PMC free article] [PubMed] [Google Scholar]
- Paus T: Growth of white matter in the adolescent brain: Myelin or axon? Brain Cogn (in press). [DOI] [PubMed] [Google Scholar]
- Peng SS, Tseng WY, Chien YH, Hwu WL, Liu HM ( 2004): Diffusion tensor images in children with early‐treated, chronic, malignant phenylketonuric: Correlation with intelligence assessment. AJNR Am J Neuroradiol 25: 1569–1574. [PMC free article] [PubMed] [Google Scholar]
- Posthuma D, De Geus EJ, Baare WF, Hulshoff Pol HE, Kahn RS, Boomsma DI ( 2002): The association between brain volume and intelligence is of genetic origin. Nat Neurosci 5: 83–84. [DOI] [PubMed] [Google Scholar]
- Reese TG, Heid O, Weisskoff RM, Wedeen VJ ( 2003): Reduction of eddy‐current‐induced distortion in diffusion MRI using a twice‐refocused spin echo. Magn Reson Med 49: 177–182. [DOI] [PubMed] [Google Scholar]
- Rovaris M, Iannucci G, Falautano M, Possa F, Martinelli V, Comi G, Filippi M ( 2002): Cognitive dysfunction in patients with mildly disabling relapsing‐remitting multiple sclerosis: An exploratory study with diffusion tensor MR imaging. J Neurol Sci 195: 103–109. [DOI] [PubMed] [Google Scholar]
- Rueckert D, Sonoda LI, Hayes C, Hill DL, Leach MO, Hawkes DJ ( 1999): Nonrigid registration using free‐form deformations: Application to breast MR images. IEEE Trans Med Imaging 18: 712–721. [DOI] [PubMed] [Google Scholar]
- Schmithorst VJ, Wilke M, Dardzinski BJ, Holland SK ( 2005): Cognitive functions correlate with white matter architecture in a normal pediatric population: A diffusion tensor MRI study. Hum Brain Mapp 26: 139–147. [DOI] [PMC free article] [PubMed] [Google Scholar]
- Shaw P ( 2007): Intelligence and the developing human brain. Bioessays 29: 962–973. [DOI] [PubMed] [Google Scholar]
- Shaw P, Greenstein D, Lerch J, Clasen L, Lenroot R, Gogtay N, Evans A, Rapoport J, Giedd J ( 2006): Intellectual ability and cortical development in children and adolescents. Nature 440: 676–679. [DOI] [PubMed] [Google Scholar]
- Shaw P, Kabani NJ, Lerch JP, Eckstrand K, Lenroot R, Gogtay N, Greenstein D, Clasen L, Evans A, Rapoport JL, Giedd JN, Wise SP ( 2008): Neurodevelopmental trajectories of the human cerebral cortex. J Neurosci 28: 3586–3594. [DOI] [PMC free article] [PubMed] [Google Scholar]
- Skranes J, Vangberg TR, Kulseng S, Indredavik MS, Evensen KA, Martinussen M, Dale AM, Haraldseth O, Brubakk AM ( 2007): Clinical findings and white matter abnormalities seen on diffusion tensor imaging in adolescents with very low birth weight. Brain 130: 654–666. [DOI] [PubMed] [Google Scholar]
- Smith SM, Nichols TE ( 2009): Threshold‐free cluster enhancement: Addressing problems of smoothing, threshold dependence and localization in cluster inference. Neuroimage 44: 83–98. [DOI] [PubMed] [Google Scholar]
- Smith SM, Jenkinson M, Woolrich MW, Beckmann CF, Behrens TE, Johansen‐Berg H, Bannister PR, De Luca M, Drobnjak I, Flitney DE, Niazy RK, Saunders J, Vickers J, Zhang Y, De Stefano N, Brady JM, Matthews PM ( 2004): Advances in functional and structural MR image analysis and implementation as FSL. Neuroimage 23 ( Suppl 1): S208–S219. [DOI] [PubMed] [Google Scholar]
- Smith SM, Jenkinson M, Johansen‐Berg H, Rueckert D, Nichols TE, Mackay CE, Watkins KE, Ciccarelli O, Cader MZ, Matthews PM, Behrens TE ( 2006): Tract‐based spatial statistics: Voxelwise analysis of multi‐subject diffusion data. Neuroimage 31: 1487–1505. [DOI] [PubMed] [Google Scholar]
- Song M, Zhou Y, Li J, Liu Y, Tian L, Yu C, Jiang T ( 2008): Brain spontaneous functional connectivity and intelligence. Neuroimage 41: 1168–1176. [DOI] [PubMed] [Google Scholar]
- Song SK, Sun SW, Ramsbottom MJ, Chang C, Russell J, Cross AH ( 2002): Dysmyelination revealed through MRI as increased radial (but unchanged axial) diffusion of water. Neuroimage 17: 1429–1436. [DOI] [PubMed] [Google Scholar]
- Song SK, Sun SW, Ju WK, Lin SJ, Cross AH, Neufeld AH ( 2003): Diffusion tensor imaging detects and differentiates axon and myelin degeneration in mouse optic nerve after retinal ischemia. Neuroimage 20: 1714–1722. [DOI] [PubMed] [Google Scholar]
- Song SK, Yoshino J, Le TQ, Lin SJ, Sun SW, Cross AH, Armstrong RC ( 2005): Demyelination increases radial diffusivity in corpus callosum of mouse brain. Neuroimage 26: 132–140. [DOI] [PubMed] [Google Scholar]
- Sowell ER, Thompson PM, Leonard CM, Welcome SE, Kan E, Toga AW ( 2004): Longitudinal mapping of cortical thickness and brain growth in normal children. J Neurosci 24: 8223–8231. [DOI] [PMC free article] [PubMed] [Google Scholar]
- Tamnes CK, Østby Y, Fjell AM, Westlye LT, Due‐Tønnessen P, Walhovd KB: Brain maturation in adolescence and young adulthood: Regional age‐related changes in cortical thickness and white matter volume and microstructure. Cereb Cortex (in press). [DOI] [PubMed] [Google Scholar]
- Van Petten C ( 2004): Relationship between hippocampal volume and memory ability in healthy individuals across the lifespan: Review and meta‐analysis. Neuropsychologia 42: 1394–1413. [DOI] [PubMed] [Google Scholar]
- Van Petten C, Plante E, Davidson PS, Kuo TY, Bajuscak L, Glisky EL ( 2004): Memory and executive function in older adults: Relationships with temporal and prefrontal gray matter volumes and white matter hyperintensities. Neuropsychologia 42: 1313–1335. [DOI] [PubMed] [Google Scholar]
- Wechsler D ( 1999): Wechsler Abbreviated Scale of Intelligence (WASI). San Antonio, TX: The Psychological Corporation. [Google Scholar]
- Westlye LT, Walhovd KB, Bjørnerud A, Due‐Tønnessen P, Fjell AM ( 2009): Error‐related negativity is mediated by fractional anisotropy in the posterior cingulate gyrus—A study combining diffusion tensor imaging and electrophysiology in healthy adults. Cereb Cortex 19: 293–304. [DOI] [PubMed] [Google Scholar]
- Wilke M, Sohn JH, Byars AW, Holland SK ( 2003): Bright spots: Correlations of gray matter volume with IQ in a normal pediatric population. Neuroimage 20: 202–215. [DOI] [PubMed] [Google Scholar]
- Yu C, Li J, Liu Y, Qin W, Li Y, Shu N, Jiang T, Li K ( 2008): White matter tract integrity and intelligence in patients with mental retardation and healthy adults. Neuroimage 40: 1533–1541. [DOI] [PubMed] [Google Scholar]
- Østby Y, Tamnes CK, Fjell AM, Westlye LT, Due‐Tønnessen P, Walhovd KB ( 2009): Heterogeneity in subcortical brain development: A structural magnetic resonance imaging study of brain maturation from 8 to 30 years. J Neurosci 29: 11772–11782. [DOI] [PMC free article] [PubMed] [Google Scholar]
Associated Data
This section collects any data citations, data availability statements, or supplementary materials included in this article.
Supplementary Materials
Additional Supporting Information may be found in the online version of this article.
Supplementary Tables