

Abstract
The insula and cingulate cortices are implicated in emotional, homeostatic/allostatic, sensorimotor, and cognitive functions. Non‐human primates have specific anatomical connections between sub‐divisions of the insula and cingulate. Specifically, the anterior insula projects to the pregenual anterior cingulate cortex (pACC) and the anterior and posterior mid‐cingulate cortex (aMCC and pMCC); the mid‐posterior insula only projects to the posterior MCC (pMCC). In humans, functional neuroimaging studies implicate the anterior insula and pre/subgenual ACC in emotional processes, the mid‐posterior insula with awareness and interoception, and the MCC with environmental monitoring, response selection, and skeletomotor body orientation. Here, we tested the hypothesis that distinct resting state functional connectivity could be identified between (1) the anterior insula and pACC/aMCC; and (2) the entire insula (anterior, middle, and posterior insula) and the pMCC. Functional connectivity was assessed from resting state fMRI scans in 19 healthy volunteers using seed regions of interest in the anterior, middle, and posterior insula. Highly correlated, low‐frequency oscillations (< 0.05 Hz) were identified between specific insula and cingulate subdivisions. The anterior insula was shown to be functionally connected with the pACC/aMCC and the pMCC, while the mid/posterior insula was only connected with the pMCC. These data provide evidence for a resting state anterior insula–pACC/aMCC cingulate system that may integrate interoceptive information with emotional salience to form a subjective representation of the body; and another system that includes the entire insula and MCC, likely involved in environmental monitoring, response selection, and skeletomotor body orientation. Human Brain Mapp 2009. © 2008 Wiley‐Liss, Inc.
Keywords: functional connectivity, fMRI, resting state, salience, insula, cingulate
INTRODUCTION
The insula and cingulate cortex play key roles in integrating multimodal information important for sensorimotor, emotional, allostatic/homeostatic, and cognitive functions (Craig,2002; Critchley,2004; Devinsky et al.,1995; Pollatos et al.,2007). For example, the dorsal margin of the mid‐posterior insula has been associated with interoception because it receives information regarding the physiological condition of the body (Craig,2004), including pain, temperature, sensual touch, itch, visceral sensations, thirst, and hunger (Augustine,1996; Brooks et al.,2005; Cole et al.,2006; Craig,2003; Craig,2004; Olausson et al.,2005; Ostrowsky et al.,2002; Schweinhardt et al.,2006). The anterior insular cortex is thought to form a global representation of the bodily state, because it is situated to integrate homeostatic afferent activity from the dorsal posterior insula with emotional salience (Craig,2002).
The insular cortex lies in the depths of the lateral sulcus covered by the opercula of the frontal, parietal, and temporal lobes (Ture et al.,1999) and contains rostroventral agranular, middle dysgranular, and posterior granular regions (Augustine,1985), each with connections to the frontal, parietal, and temporal lobes (Mesulam and Mufson,1982a; Mesulam and Mufson,1982b; Mufson and Mesulam,1982) and the cingulate gyrus (Augustine,1996). In the non‐human primate, the anterior insula is connected to the rostral extent of Brodmann area 24 of the anterior cingulate cortex (ACC) and a dorsal transitional area between areas 24 and 6 (Mesulam and Mufson,1982b; Vogt and Pandya,1987). In contrast, the mid and posterior primate insula have connections with dorsal cingulate areas 23 and 24, and the upper banks of the cingulate sulcus and premotor cortex (Mesulam and Mufson,1982b).
The cingulate cortex has been divided into four major regions based on cytoarchitectonics, electrophysiology, imaging, and lesion studies (Vogt et al.,2005). These four regions include the ACC, mid‐cingulate cortex (MCC), posterior cingulate cortex (PCC), and retrosplenial cortex (RSC). The ACC has been subdivided into subgenual (sACC) and pregenual ACC (pACC) regions, whereas the MCC has been subdivided into anterior (aMCC) and posterior mid‐cingulate (pMCC) regions (Vogt et al.,2005; Vogt,2005). The sACC and pACC are primarily concerned with emotions and pain. The MCC includes regions involved in pain (Apkarian et al.,2005), and motor functions involved in response selection (aMCC) and skeletomotor body orientation (pMCC) (Vogt,2005). The MCC has also been implicated in cognitive processes including error detection, salience, attention to behaviorally relevant stimuli, anticipation, decision making, and task‐set implementation (i.e., task initiation or task switching) (Bush et al.,2000; Davis et al.,1997; Davis et al.,2000; Dosenbach et al.,2006; Dosenbach et al.,2007; Dux et al.,2006; Fair et al.,2007; Rushworth et al.,2007).
To our knowledge, information exchange between the insula and cingulate cortex has never been directly shown. However, the distinct anatomical connections between these two brain regions identified in non‐human primates combined with the evidence from numerous human functional imaging studies revealing coactivation within specific parts of the insula and cingulate cortex, suggests that multiple information processing pathways may exist between these two regions. Alternatively, these two brain regions could be part of multiple networks with common inputs. Therefore, the aim of this article was to examine functional connectivity between specific parts of the insula and subregions of the cingulate cortex.
Functional connectivity has been operationally defined to refer to temporal correlations across cortical regions and can represent an index of brain function (Friston et al.,1993; Horwitz,2003). Several imaging modalities have been utilized to record indices of brain function, such as electroencephalography (EEG), positron emission tomography (PET), magnetoencephalography (MEG), and functional magnetic resonance imaging (fMRI). Resting state functional connectivity analysis is a technique that identifies cortical areas that have strong temporally‐correlated low‐frequency (< 0.1 Hz) activity in a non‐task (i.e., rest) state. Using this approach the relationship between anatomically distinct, but functionally connected, brain regions can be investigated. It is thought that these low‐frequency fluctuations are functionally relevant indices of connectivity between brain regions subserving similar or related brain functions (Birn,2007). To date this approach has identified multiple resting state networks, including the so called “default mode” or task‐negative network, a network that is active during rest and is suppressed during the performance of a task (Fox et al.,2005; Raichle et al.,2001), and the task‐positive network, which performs attention orienting operations (Fox et al.,2006). A recent study by DeLuca et al. (2006) established that these resting state networks are not artifacts produced by aliasing of cardiac and respiratory cycles, but are localized to gray matter of the cerebral cortex and are likely related to ongoing neuronal activity (DeLuca et al.,2006). In addition, Damoiseaux et al. (2006) demonstrated that these resting state networks display blood oxygen level dependent (BOLD) signal changes up to 3%, values that are comparable with task‐related BOLD changes. Furthermore, the authors demonstrated that these networks were consistent across individuals and stable across repeated sessions (Damoiseaux et al.,2006).
Thus, in this study we used resting state functional connectivity analysis to determine if BOLD fluctuations within the anterior, middle, and posterior insula correlate with specific subregions of the cingulate cortex. Based on primate tracing studies and functional activation studies, we hypothesized that two distinct systems could be identified at rest: (1) a system linking the anterior insula with pACC/aMCC, potentially involved in integrating interoceptive information with emotional salience to form a subjective bodily representation; (2) a system that links the entire insula with the MCC, potentially involved in general salience, response selection, and action.
METHODS
Subjects
Nineteen right‐handed healthy subjects (11 male, 8 female; 28.1 ± 5.6 years old) with no history of neurological injury, participated in the study. Handedness was determined using the Edinburgh handedness inventory (Oldfield,1971). All subjects gave informed written consent to procedures approved by the University Health Network Research Ethics Board.
Data Acquisition
All data were obtained using a 3T GE MRI system fitted with an eight channel phased array head coil. A three‐dimensional high resolution anatomical scan of the whole brain (124 sagittal slices, 24 × 24 cm FOV, 256 × 256 matrix, 1.5 × 0.94 × 0.94 mm voxels) was acquired with a T1‐weighted 3D spoiled gradient echo (SPGR) sequence (flip angle = 45°, TE = 5 ms, TR = 25 ms). Resting state fMRI data was acquired using T2*‐weighted echo planar imaging (EPI) (25 axial slices, FOV = 20 × 20 cm, 64 × 64 matrix, 3.125 × 3.125 × 4 mm voxels, TE = 40 ms, TR = 2000 ms). The scan time was 5 minutes and 8 seconds (154 frames). Subjects were instructed to relax, keep their eyes closed, and think of nothing in particular (Damoiseaux et al.,2006; Greicius et al.,2004). Greicius et al. (2003) investigated the default mode network during resting state and during a passive visual processing task (i.e., eyes open) and found almost identical patterns of activity, indicating that tasks that require minimal cognitive processing do not disrupt resting state networks (Greicius et al.,2003).
Data Analysis
Data were preprocessed and analyzed using Brainvoyager QX v1.8 (Brain Innovation, Maastricht, Netherlands). Preprocessing included motion correction, slice timing correction, linear trend removal, and spatial smoothing with a 6 mm FWHM Gaussian kernel. fMRI datasets were interpolated to 3 × 3 × 3 mm voxels, registered to the high resolution anatomical image and normalized to standard Talairach space (Talairach and Tournoux,1988). Voxels are reported as 1 × 1 × 1 mm.
Previous cytoarchitechtonic studies performed in non‐human primates have identified three distinct insular subregions which have different anatomical connections with the rest of the brain (rostroventral agranular, middle dysgranular, and posterior granular regions [Augustine,1985]). As our main interest was to examine the functional connectivity with these three insular subregions and the cingulate cortex, six regions of interest (ROIs) were drawn for each subject within the anterior, middle, and posterior insula (three left and three right) based on previous anatomical and MR imaging studies (Naidich et al.,2004; Ture et al.,1999; Varnavas and Grand,1999) (Table I). Thus, the anterior insula included the anterior short gyrus, the mid‐insula included the middle and posterior short gyrus, and the posterior insula included the anterior long gyrus (Brooks et al.,2002; Brooks et al.,2005; Schweinhardt et al.,2006). Because our intention was to obtain an average time course for each major region of the insula that was as distinct as possible from the adjacent areas, each ROI was restricted to gray matter and carefully delineated to avoid overlap with other subregions (see Fig. 4A).
Table I.
Insula regions of interest
| ROI centre of mass | ROI volume (mm3), (mean ± SD) | |||
|---|---|---|---|---|
| X | Y | Z | ||
| R anterior insula (RaIC) | 36 | 16 | 2 | 1,986 ± 600 |
| R middle insula (RmIC) | 38 | 1 | 6 | 1,219 ± 261 |
| R posterior insula (RpIC) | 38 | −10 | 7 | 1,271 ± 217 |
| L anterior insula (LaIC) | −34 | 14 | 2 | 1,834 ± 502 |
| L middle insula (LmIC) | −38 | −1 | 6 | 1,284 ± 269 |
| L posterior insula (LpIC) | −38 | −12 | 7 | 1,321 ± 407 |
Shown are the coordinates (Talairach space) and region of interest volumes for each insula subregion used in the connectivity analysis.
Figure 4.
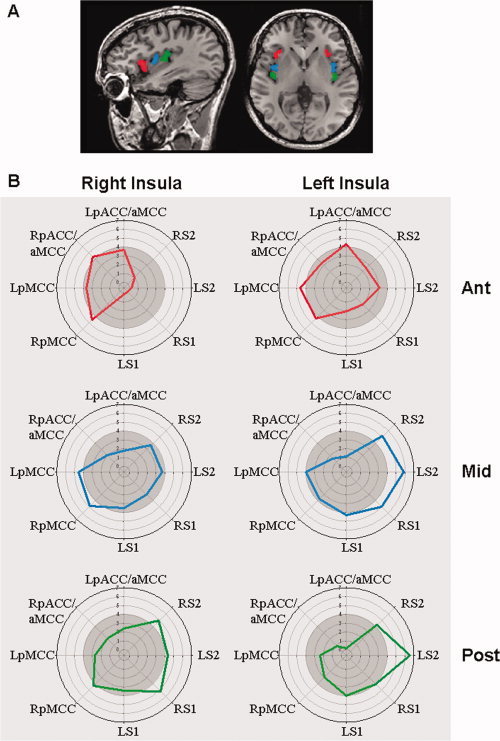
Insula connectivity fingerprints. (A) ROI's placed in the anterior (red), mid (blue), and posterior (green) insula are shown for a single subject. (B) Polar plots illustrating patterns of connectivity of each insula subdivision with the cingulate cortex and also key somatosensory brain areas. These fingerprints are based on the correlations between pairs of brain areas. Concentric circles represent increasing t‐values of the correlation between resting activity of an insula ROI and the pregenual/anterior mid‐cingulate (pACC/aMCC), posterior mid‐cingulate cortex (pMCC), primary somatosensory (S1), and secondary somatosensory (S2) cortex. The lighter outer circle denotes the region of statistical significance at t > 4. R, right; L, left.
The average time course (averaged across all voxels within each insula region) was extracted for each ROI on a single subject basis. Frequency periodograms were calculated separately for each subject and ROI to ensure that the data were in the typical resting state frequency range (< 0.1 Hz). This was accomplished by performing Fourier transforms of the average time course extracted from each ROI using SPSS 12.0 (SPSS Inc., Chicago). Single subject average time courses were then used as predictors in a fixed effects multisubject general linear model (GLM). One multisubject GLM analysis was performed for each ROI for a total of six multisubject GLMs (i.e., anterior, mid, and posterior insula, bilaterally). A conjunction analysis was performed to identify brain regions highly correlated with the insular ROIs in all 19 subjects. This was done by searching across all subjects to identify the minimum statistical t‐value for each voxel. Once this minimum was identified, it was assigned as the voxel value. These maps were then thresholded at a corrected value of P < 0.05 (derived from an uncorrected P < 0.0001 and 120 mm3 contiguous clusters as previously reported by Downar et al. [2003] and validated by a Monte Carlo simulation implemented in the Analysis of Functional NeuroImages software with the AlphaSim application [http://afni.nimh.nih.gov/afni/doc/manual/AlphaSim]). To further identify the connectivity of each insula region, unthresholded average t‐scores were extracted from 5 mm3 cubes, which were placed within each of the group correlation maps, within four bilateral brain regions: ACC, MCC, primary (S1), and secondary (S2) somatosensory cortices centered on the following x, y, z coordinates: pACC/aMCC, ± 8, 38, 19; pMCC, ± 6, 9, 36; S1, ± 42, −22, 51; S2, ± 42, −22, 23. The strength of the resting state connectivity (i.e., the t‐scores) between each insula region and the cingulate and somatosensory regions were then displayed visually as regional “fingerprints” from polar plots created with Sigma Plot 9.0. The somatosensory cortices were included in this analysis because anatomical pathways between the insula and somatosensory regions have been identified in non‐human primates (Augustine,1996), and because of our interest in nociception, during which it is common to observe activation within all four of these brain regions.
Random effects analyses were also performed to ascertain if there were significant differences in spatial spread and strength of connectivity of the insula ROIs within cingulate cortex subregions. The models included all 19 subjects and their predictors, derived from the anterior, middle, and posterior insula, for the left and right hemispheres separately. Six sets of contrasts were generated: (1) left anterior insula vs. left posterior insula; (2) left anterior vs. left mid‐insula; (3) left mid vs. left posterior insula; (4) right anterior insula vs. right posterior insula; (5) right anterior vs. right mid‐insula; (6) right mid vs. right posterior insula. All statistical maps were thresholded at a corrected P < 0.05 (derived from an uncorrected P < 0.0001 and 120 mm3 contiguous clusters).
RESULTS
The location and size of each insula ROI is shown in Table I. Single subject spectral analyses of the resting state BOLD activity within the insula ROIs identified low‐frequency oscillations of 0.04 ± 0.002 Hz (mean ± SE). Examples of these oscillations in an individual subject can be seen in Figures 1, 2, 3A,D. Resting state connectivity analysis based on seeds within the three insula subdivisions revealed remarkably similar (between subjects) low‐frequency oscillations in specific cingulate subdivisions (see Figs. 1, 2, 3 B,E).
Figure 1.
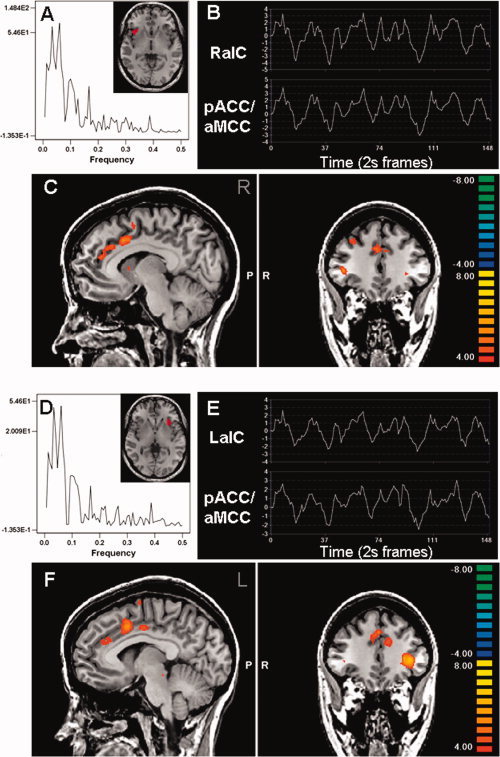
Whole brain multisubject conjunction analysis showing anterior insula connectivity with the cingulate cortex. The spectral analysis and ROI time course from a single subject is shown for the left (A, B) and right (D, E) anterior insula (aIC). These regions had tight correlations of low‐frequency oscillations (B, E) with the pregenual and mid‐cingulate cortex (C, F).
Figure 2.
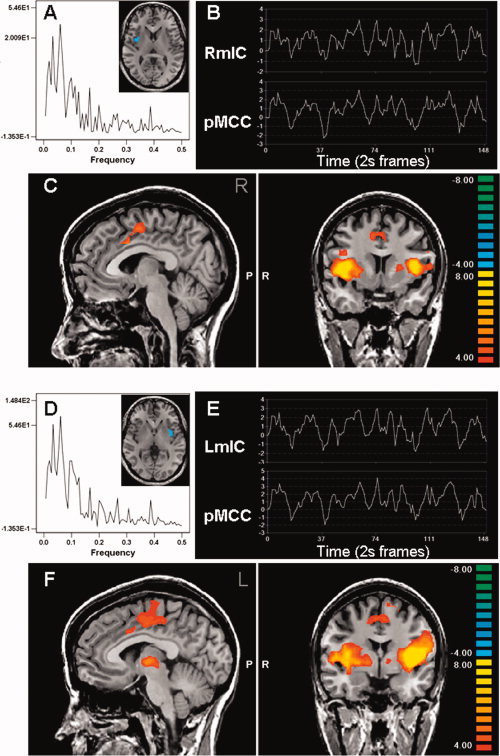
Whole brain multisubject conjunction analysis showing mid‐insula connectivity with the cingulate cortex. The spectral analysis and ROI time course from a single subject is shown for the left (A, B) and right (D, E) mid‐insula (mIC). These regions had tight correlations of low frequency oscillations (B, E) with the mid‐cingulate cortex (C, F).
Figure 3.
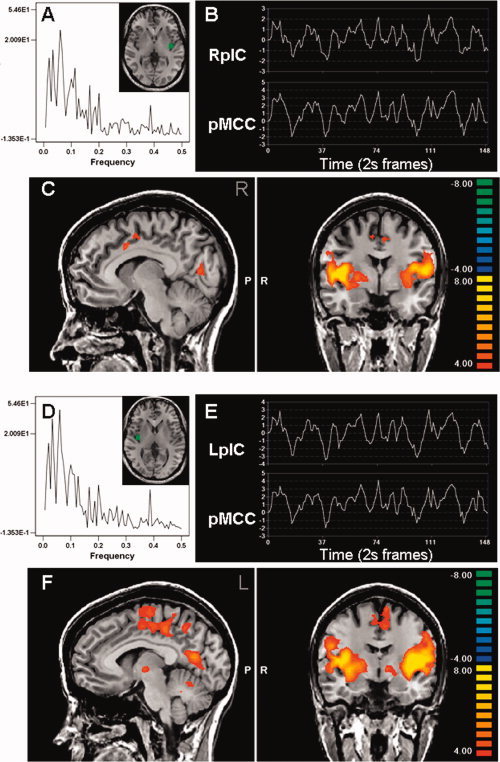
Whole brain multisubject conjunction analysis showing posterior insula connectivity with the cingulate cortex. The spectral analysis and ROI time course from a single subject is shown for the left (A, B) and right (D, E) posterior insula (pIC). These regions had tight correlations of low frequency oscillations (B, E) with the mid‐cingulate cortex (C, F).
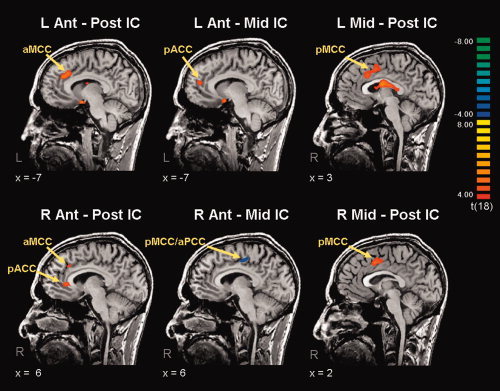
The location of the cingulate subregions found to have tightly correlated resting state activity with the insula ROIs are shown in Figures 1, 2, 3. Activity in both the left and right anterior insula cortices was strongly correlated with the bilateral pACC/aMCC and bilateral pMCC (Fig. 1C,F). However, the fMRI signal in the mid and posterior insula cortices were strongly correlated with bilateral pMCC (Figs. 2 and 3, parts C,F), but not with the more rostral pACC/aMCC. A complete list of brain regions that displayed significant correlations with bilateral anterior, middle, or posterior insula in all 19 subjects is provided in Table II.
Table II.
Anatomical locations and center of gravity coordinates (in Talairach space) displayed for brain regions that demonstrated significant correlations with each of the six insula ROIs
| ROI | Anatomical location (center of gravity) | Talairach coordinates | Voxels | ||
|---|---|---|---|---|---|
| x | y | z | |||
| LaIC | Left insula | −37 | 14 | 1 | 24,023 |
| Left cingulate gyrus BA 24/32 (pACC/aMCC) | −7 | 33 | 26 | 580 | |
| Left cingulate gyrus/BA 24 (pMCC) | −6 | 6 | 41 | 1,419 | |
| Left cerebellum | −4 | −29 | −15 | 125 | |
| Left inferior frontal gyrus/BA 9 | −34 | 8 | 28 | 189 | |
| Right insula | 33 | −26 | −12 | 14,420 | |
| Right inferior parietal lobule/BA 40 | 51 | −41 | 34 | 825 | |
| Right fusiform gyrus/BA 37 | 42 | −40 | −13 | 840 | |
| Right angular gyrus/BA 39 | 39 | −57 | 37 | 143 | |
| Right paracentral/inferior parietal gryus/BA 2/40 | 21 | −41 | 58 | 631 | |
| Right cerebellum | 3 | −68 | −24 | 472 | |
| Right cingulate gyrus BA 24/32 (pACC/aMCC) | 4 | 31 | 31 | 856 | |
| Right cingulate gyrus/BA 24 (pMCC) | 5 | 5 | 40 | 608 | |
| Right cingulate gyrus/BA31 (pMCC) | 6 | −41 | 43 | 147 | |
| LmIC | Left insula | −36 | −7 | 12 | 31,545 |
| Left postcentral gyrus/BA 2/BA 40 (S2) | −46 | −18 | 27 | 2,834 | |
| Left postcentral gyrus/BA 1, 2, 3 (S1) | −16 | −39 | 62 | 1,314 | |
| Left cingulate gyrus/BA 24 (pMCC) | −7 | −9 | 46 | 1,479 | |
| Left precentral gyrus/BA 4 | −44 | −14 | 43 | 1,892 | |
| Left lingual gyrus/BA 18 | −9 | −71 | 6 | 210 | |
| Left middle frontal gyrus/BA 10 | −31 | 38 | 7 | 151 | |
| Right insula | 32 | −6 | 10 | 16,793 | |
| Right inferior parietal/postcentral gyrus/BA 40 (S2) | 42 | −23 | 27 | 3,033 | |
| Right postcentral gyrus/BA 2/40 | 28 | −42 | 47 | 4,023 | |
| Right cingulate gyrus/BA 24 (pMCC) | 7 | −2 | 47 | 702 | |
| Right precentral gyrus/BA 4 | 38 | −18 | 46 | 2,344 | |
| Right fusiform gyrus/BA 37 | 42 | −41 | −9 | 234 | |
| Right inferior frontal gyrus/BA9 | 36 | 8 | 22 | 138 | |
| Right fusiform gyrus/BA 37 | 36 | −53 | −3 | 310 | |
| Right cuneus/BA 30 | 21 | −71 | 7 | 566 | |
| LpIC | Left insula | −37 | −17 | 10 | 48,422 |
| Left inferior parietal gyrus/BA 2/BA 40 (S2) | −40 | −23 | 25 | 3,257 | |
| Left medial frontal gyrus/BA 6 | −10 | −11 | 67 | 338 | |
| Left cingulate gyrus/BA 31 (pMCC) | −10 | −11 | 46 | 806 | |
| Left precuneus/BA 7 | −10 | −56 | 46 | 252 | |
| Left cuneus/BA 18 | −16 | −83 | 16 | 520 | |
| Left inferior parietal lobule/BA 40 | −22 | −35 | 52 | 371 | |
| Left postcentral gyrus/BA 2 | −41 | −29 | 45 | 1,240 | |
| Left precentral gyrus/BA 4 | −36 | −16 | 53 | 471 | |
| Left middle temporal gyrus/BA 37 | −43 | −59 | −3 | 324 | |
| Right insula | 36 | −14 | 10 | 29,659 | |
| Right inferior parietal gyrus/BA 2/BA 40 (S2) | 42 | −23 | 25 | 2,319 | |
| Right precentral gyrus/BA 1, 2, 3 (S1) | 36 | −20 | 37 | 272 | |
| Right occipital lobe, sub‐gyral, white matter | 36 | −59 | −3 | 226 | |
| Right cingulate gyrus/BA 24 (pMCC) | 2 | −7 | 49 | 330 | |
| Right postcentral gyrus/BA 1, 2, 3 (S1) | 25 | −38 | 52 | 1,121 | |
| Right precuneus/BA 31 | 30 | −71 | 16 | 1,724 | |
| RaIC | Right insula | 39 | 17 | 4 | 12,460 |
| Right middle frontal gyrus/BA 9 | 30 | 32 | 37 | 308 | |
| Right/left cingulate gyrus/BA 24/32 (pACC/aMCC) | 5 | 32 | 27 | 1,118 | |
| Right cingulate gyrus (GC)/BA 24 (pMCC) | 6 | 13 | 38 | 672 | |
| Left insula | −40 | 14 | 1 | 8,075 | |
| Left cingulate gyrus/BA 24 (pACC/aMCC) | −6 | 36 | 26 | 128 | |
| Left cingulate gyrus/BA 24 (pMCC) | −4 | 9 | 40 | 325 | |
| RmIC | Right insula | 39 | 2 | 4 | 42,546 |
| Right postcentral gyrus/BA 1, 2, 3 (S1) | 36 | −19 | 25 | 371 | |
| Right precentral gyrus/BA 6 | 36 | 5 | 22 | 134 | |
| Right inferior frontal gyrus/BA 46 | 33 | 35 | 10 | 199 | |
| Right fusiform gyrus/BA 19 | 36 | −53 | −6 | 139 | |
| Right parahippocampal gyrus/BA 27 | 24 | −32 | −3 | 139 | |
| Right cuneus/BA 31/17 | 12 | −71 | 10 | 260 | |
| Right cingulate gyrus/BA 24 (pMCC) | 1 | −2 | 48 | 978 | |
| Left insula | −37 | 2 | 10 | 27,661 | |
| Left cingulated gyrus/BA 24 (pMCC) | −4 | −2 | 46 | 981 | |
| Left cuneus/BA 31/17 | −13 | −68 | 10 | 347 | |
| Left postcentral gyrus/BA 40/42 (S2) | −40 | −19 | 18 | 460 | |
| Left cuneus/BA 18 | −19 | −80 | 25 | 155 | |
| RpIC | Right insula | 36 | −14 | 10 | 40,701 |
| Right postcentral gyrus/BA 40 (S2) | 40 | −20 | 20 | 901 | |
| Right precentral gyrus/BA 4 | 42 | −19 | 44 | 1,539 | |
| Right medial temporal gyrus/BA 37 | 42 | −62 | 10 | 149 | |
| Left cuneus/BA 30 | −13 | −68 | 10 | 2,776 | |
| Right postcentral gyrus/BA 1, 2, 3 (S1) | 18 | −35 | 61 | 277 | |
| Right cingulate gyrus/BA 24/32 (pMCC) | 6 | −1 | 46 | 330 | |
| Left insula | −40 | −8 | 10 | 24,915 | |
| Left paracentral/cingulate gyrus/BA 24 (pMCC/aPCC) | −7 | −26 | 43 | 1,371 | |
| Left superior frontal gyrus/BA 6 | −10 | −14 | 67 | 329 | |
| Left cuneus/BA 17 | −16 | −83 | 10 | 367 | |
| Left postcentral gyrus/BA 40 (S2) | −40 | −18 | 19 | 726 | |
Brain areas were derived from the multisubject conjunction analyses, thresholded at a corrected P < 0.05. Voxels are reported as 1 × 1 × 1 mm3. aIC, anterior insula; mIC, mid‐insula; pIC, posterior insula; pACC, pregenual anterior cingulate cortex; aMCC, anterior mid‐cingulate cortex; pMCC, posterior mid‐cingulate cortex; S1, primary somatosensory cortex; S2, secondary somatosensory cortex; R, right; L, left.
Insula connectivity “fingerprints” were constructed to illustrate patterns of connectivity of each insula subdivision with the cingulate cortex and also key somatosensory regions. Figure 4 shows these “fingerprints” as polar plots of the strength (average t‐score) of correlated activity between the anterior, middle, and posterior insula and the cingulate, S1 and S2. The fingerprints illustrate that all insular ROIs, except the left posterior insula, had strongly correlated activity with pMCC, while only the anterior insular ROIs displayed significant correlations with pACC/aMCC. The left mid‐insula and bilateral posterior insula were significantly correlated with activity within S1 and S2. However, there were no statistically significant correlations with S1 and S2 for the right middle insula and bilateral anterior insula (t < 4.0) (see Fig. 4).
To determine if the strength of the identified connectivity patterns were significantly different between the anterior, middle, and posterior insula, a random effects group analysis was performed. Connectivity with S1 and S2 was not found to differ between sub‐regions of the insula. Table III displays additional brain regions that demonstrated significantly different connectivity between insular sub‐regions. However, there were significant differences within the cingulate cortex for the contrasts: (1) anterior IC vs. posterior IC; (2) anterior IC vs. mid‐IC; (3) mid‐IC vs. posterior IC, and these are highlighted in Figure 5. Interestingly, the anterior insula bilaterally showed stronger resting state connectivity with the pACC/aMCC than either the middle or posterior insula (see Fig. 5, first 2 columns). However, the mid‐insula was more strongly connected with the pMCC than the posterior insula (Fig. 5, third column).
Table III.
Contrasts between insula sub‐regions in a random effects group analysis of connectivity
| Contrast | Anatomical location (center of gravity) | Talairach coordinates | voxels | ||
|---|---|---|---|---|---|
| x | y | z | |||
| LaIC > | Left anterior insula | −29 | 16 | −1 | 15,644 |
| LpIC | Left cingulate gyrus/BA 32 (aMCC) | −1 | 23 | 38 | 4,190 |
| Left caudate | −12 | −4 | 18 | 506 | |
| Left middle frontal gyrus/BA 46 | −26 | 48 | 15 | 1,075 | |
| Right anterior insula | 40 | 18 | 6 | 5,063 | |
| Right middle frontal gyrus/BA 9 | 37 | 23 | 28 | 223 | |
| Right caudate | 7 | −5 | 13 | 2,132 | |
| LaIC > | Left anterior insula | −32 | 17 | −4 | 2,501 |
| LmIC | Left medial frontal gyrus/BA 9 | −1 | 50 | 25 | 200 |
| Left cingulate/medial frontal gyrus/BA 32 (pACC/aMCC) | −8 | 45 | 18 | 306 | |
| Left superior frontal gyrus/BA 9 | −22 | 58 | 20 | 523 | |
| Left inferior frontal gyrus/BA 47 | −20 | 30 | −7 | 171 | |
| Right superior frontal gyrus/BA 10 | 21 | 63 | 2 | 148 | |
| LmIC > | Left mid–posterior insula | −38 | −9 | 12 | 1,193 |
| LaIC | |||||
| LmIC > | Left mid‐insula | −20 | 5 | 13 | 34,221 |
| LpIC | Left middle frontal gyrus/BA 9 | −37 | 31 | 32 | 168 |
| Left supramarginal gyrus/BA 40 | −56 | −43 | 37 | 153 | |
| Left inferior frontal gyrus/BA 47 | −60 | 23 | −13 | 245 | |
| Right inferior parietal lobule/supramarginal gyrus/BA 40 | 54 | −40 | 33 | 3,730 | |
| Right inferior frontal gyrus/BA 45/45 | 40 | 21 | 15 | 14,981 | |
| Right inferior parietal gyrus/BA 40 | 56 | −39 | 50 | 128 | |
| Right fusiform/inferior temporal gyrus/BA 37 | 46 | −48 | −12 | 167 | |
| Right precentral gyrus/BA 4 | 36 | −7 | 54 | 1,154 | |
| Right precuneus/BA 7 | 10 | −66 | 52 | 263 | |
| Right cingulate gyrus/BA 32 (aMCC/pMCC) | 1 | 11 | 40 | 2,872 | |
| RaIC > | Right anterior insula/inferior frontal gyrus/BA 45/44 | 31 | 32 | 6 | 24,900 |
| RpIC | Right cingulate gyrus/BA 32 (aMCC) | 3 | 24 | 37 | 334 |
| Right cingulate gyrus/BA 24 (pACC) | 7 | 35 | 6 | 316 | |
| Left anterior insula | −37 | 18 | −3 | 1,627 | |
| Left superior frontal gyrus/BA 9 | −25 | 47 | 27 | 418 | |
| Left middle frontal gyrus/BA 10 | −32 | 46 | −4 | 188 | |
| RaIC > | Right inferior frontal gyrus/BA 47 | 37 | 23 | −6 | 649 |
| RmIC | |||||
| RmIC > | Right mid–posterior insula | 38 | −12 | 15 | 8,069 |
| RaIC | Right paracentral/cingulate gyrus/BA 31 (pMCC/aPCC) | 6 | −20 | 45 | 752 |
| Left mid–posterior insula | −36 | −16 | 12 | 4,872 | |
| Left paracentral/cingulate gyrus/BA 31(pMCC/aPCC) | −10 | −18 | 45 | 311 | |
| RmIC > | Right anterior mid‐insula | 36 | 18 | 14 | 45,219 |
| RpIC | Right middle frontal gyrus/BA 9 | 53 | −38 | 33 | 8,999 |
| Right middle–inferior temporal gyrus/BA 21/20 | 46 | −32 | −14 | 1,589 | |
| Right superior frontal gyrus/BA 6 | 20 | −5 | 64 | 191 | |
| Right cingulate gyrus/BA 32/24 (aMCC/pMCC) | 1 | 4 | 44 | 1,319 | |
| Left anterior mid‐insula | −40 | 5 | 8 | 13,289 | |
| Left middle frontal gyrus/BA 46/9 | −35 | 38 | 26 | 6,001 | |
| Left inferior parietal lobule/BA 40 | −56 | −39 | 29 | 4,589 | |
| Left inferior temporal gyrus/BA37 | −57 | −55 | −5 | 749 | |
Anatomical locations and center of gravity coordinates (in Talairach space) are provided for the brain areas where the strength of connectivity was found to be significantly different between insular sub‐regions at P < 0.05 (corrected). Voxels are reported as 1 × 1 × 1 mm3. aIC, anterior insula; mIC, mid‐insula; pIC, posterior insula; pACC, pregenual anterior cingulate cortex; aMCC, anterior mid‐cingulate cortex; pMCC, posterior mid‐cingulate cortex; S2, secondary somatosensory cortex; R, right; L, left.
Figure 5.
Random effects contrast maps. All 19 subjects and their insula ROIs were included in the statistical model. Contrasts were made between: (1) bilateral anterior IC minus bilateral posterior (first column); (2) bilateral anterior IC minus bilateral mid‐IC (second column); (3) bilateral mid‐IC minus bilateral posterior IC (third column). Maps were thresholded at corrected P < 0.05. Anterior insula demonstrates stronger connectivity with the pACC/aMCC than either the mid or posterior insular cortex. No significant differences were identified for the pMCC, S1 or S2. IC = insular cortex.
DISCUSSION
We have used functional connectivity analysis to identify resting state systems between the insula and cingulate cortices. The anterior insula was shown to be functionally connected with the pACC/aMCC and the pMCC, while the mid/posterior insula was only connected with the pMCC. We propose that the system linking the anterior insula with the pACC/aMCC may be involved in emotional salience monitoring, while the system linking the entire insula with the pMCC could be a general salience and action system.
The identification of a general salience system stems from a large body of converging evidence, including Downar et al. (2000,2002,2003) who identified a set of brain regions, including the anterior insula and MCC, that detects salient environmental changes regardless of the modality of the task employed (i.e., visual, auditory, tactile, pain). Furthermore, using single cell electrophysiological recordings in the human brain our group has identified neurons within the MCC that respond to pain (Hutchison et al.,1999) and neurons that respond to cognitively‐demanding tasks proposed to be involved in general salience detection (Davis et al.,2005). In contrast, functional activation studies in healthy individuals and patients with abnormal emotional processing (e.g., depression) strongly implicate more rostral areas of the cingulate cortex (i.e., ACC) in emotional salience (Bush et al.,2000; Etkin et al.,2006; Mayberg et al.,2000; Phan et al.,2002).
The insular and cingulate cortices have both been implicated in emotional, homeostatic/allostatic, sensorimotor, and cognitive functions (Craig,2002; Craig,2008; Critchley et al.,2003; Critchley,2004; Critchley et al.,2005; Devinsky et al.,1995). For example, the anterior insula has been shown to be activated in studies of emotional aspects of pain (Rainville et al.,1997), empathy relating to pain (Singer et al.,2004), temperature (Craig et al.,2000; Davis et al.,2004; Olausson et al.,2005), emotion (Buchel et al.,1998; Phillips et al.,1998), salience (Downar et al.,2000; Downar et al.,2002; Downar et al.,2003), and during subjective evaluation of autonomic function (i.e., heart beat detection) (Critchley et al.,2004). Interestingly, the right anterior insula is activated during painful rectal distention in healthy individuals but not in patients with irritable bowel syndrome (Kwan et al.,2005) and these patients also had cortical thinning of the anterior insula and pMCC (Davis et al.,2008). These findings suggest that the anterior insula normally works to monitor internal body functions. According to Craig (2002), interoceptive information regarding the physiological condition of the entire body is received by the posterior insula which is then projected to the anterior insula for subjective evaluation of internal conditions (Craig,2002; Critchley et al.,2004). The sACC and pACC have also been implicated in autonomic and emotional processing, while the aMCC and the pMCC have been implicated in cognitive and sensorimotor functions (Bush et al.,2000; Critchley,2004; Devinsky et al.,1995; Vogt,2005).
The concept that at rest, a network of cortical areas exists with tightly correlated activity was introduced by Biswal et al. (1995) who described a network of temporally correlated motor‐related brain areas. Functional connectivity analyses of resting state activity has identified low‐frequency (< 0.1 Hz) fluctuations of BOLD fMRI signals (Biswal et al.,1995; Fox et al.,2005; Raichle et al.,2001). Examination of low‐frequency fluctuations has revealed spatiotemporal synchrony (correlations) between distinct anatomical brain regions, which have been attributed to spontaneous neuronal activity (Xiong et al.,1999). Using this technique, multiple networks of temporally correlated brain regions have been identified that are related to specific types of sensory, motor, and cognitive functions (DeLuca et al.,2006; Margulies et al.,2007; Seeley et al.,2007). Indeed, these intrinsic networks include both the task negative network (i.e., the “default” mode resting state) that shows task‐related deactivations, and anticorrelated task‐positive networks (DeLuca et al.,2006; Fox et al.,2005; Fox et al.,2006) that are activated during specific tasks or by salient stimuli such as a painful event (Seminowicz and Davis,2007). It has been proposed that the task‐negative intrinsic network acts to monitor the environment to prepare for perception and/or action to salient information (Seminowicz and Davis,2007). The intrinsic task‐positive network includes the dorsolateral prefrontal cortex, insula, supplementary motor area, inferior parietal sulcus, and frontal eye fields (Fox et al.,2005). In a recent functional connectivity study, Seeley et al. (2007) suggested that this task‐positive network is actually composed of a “salience network” that includes dorsal ACC, orbitofrontal‐insular cortices, and subcortical limbic structures, and an “executive‐control network,” connecting the dorsolateral frontal cortex with the parietal cortex. The authors propose that the “salience network” is responding to the amount of personal salience and not specifically to the stimuli's specific nature (i.e., homeostatic, emotional, or cognitive). Dosenbach et al. (2007) also separated this task‐positive network into cingulo‐opercular and frontoparietal components using resting state functional connectivity analysis. While these authors propose slightly different functional roles for these two networks, their study also highlights the tight coupling of resting state activity between parts of the insula and cingulate cortex. Interestingly, these networks were reported to be incomplete in children (< 9 years) with strengthening and maturation of long range connections occurring throughout adolescence; a process that may be related to increased myelination or strengthening of connections through coactivation (Fair et al.,2007).
Using an ROI approach based on insula anatomy, we identified this anterior insula/pMCC or “salience network” and additionally found strong correlations between the mid/posterior insula and the MCC. If indeed this network is involved in general salience to internal and externally generated stimuli, the involvement of a brain region that has been termed the “primary interoceptive cortex” is not surprising. Finally, ROIs placed in the mid/posterior insula also revealed strong correlations with the primary and secondary somatosensory cortices, supporting our hypothesis that this system may play a role in skeletomotor body orientation and response selection.
Although there is a growing body of evidence supporting the existence of resting state functional connectivity networks, some studies have shown that in some situations, some of the low‐frequency fluctuations are due to non‐neuronal physiological fluctuations, such as cardiac, respiratory, and blood CO2 fluctuations, or scanner instability (Birn et al.,2006; Birn et al.,2008a; Birn et al.,2008b; Fox and Raichle,2007; Shmueli et al.,2007; Wise et al.,2004). Recent studies suggested that removal of these artifacts (by recording these parameters at the time of scanning and including them as regressors in the statistical model) can clean the data and improve statistical significance (Birn et al.,2006; Shmueli et al.,2007). Here, we did not collect these physiological parameters, and therefore we cannot access the impact of these artifacts on our data. However, these potential sources of noise are unlikely to have been a significant factor in our study since the major frequencies produced through the cardiac and respiratory processes are in the range of 0.6–1.2 Hz and 0.1–0.5 Hz, respectively (Cordes et al.,2001) and most of our data was in the 0.02–0.1 Hz band. However, it is also possible that high frequency data could be aliased into a lower frequency range. Furthermore, although our data may include some physiological noise, the use of seed regions that are anatomically close, and therefore likely to contain similar amounts of physiological noise, combined with the fact that distinct resting state networks were still identified, leads us to believe that these noise sources were not a major factor.
Tracing studies in the monkey delineate anterior insula connections with the rostral extent of ACC area 24 and a dorsal area between areas 24 and 6 (Mesulam and Mufson,1982b; Vogt and Pandya,1987); and mid and posterior insula connections with dorsal areas 23 and 24 (Mesulam and Mufson,1982b). Although functional connectivity alone cannot demonstrate direct monosynaptic connections, our functional connectivity findings do support the anatomical evidence that in the human brain these areas are connected. Alternatively, sub‐regions of the insula and cingulate could have common inputs driving the synchronous BOLD fluctuations. The thalamus is the most likely candidate as direct projections from the thalamus to the insula and cingulate have been demonstrated in non‐human primates (Augustine,1996; Craig,2008; Hatanaka et al.,2003; Mufson and Mesulam,1984; Vogt et al.,1979). Specifically, thalamic nuclei that project to both the cingulate and the insula include the parafascicularis, submedial, reuniens, limitans, and mediodorsal nucleus (Hatanaka et al.,2003; Mufson and Mesulam,1984; Vogt et al.,1979). In our study, strong connectivity with the thalamus was not found in either the conjunction or the random effect contrast analyses, likely due to the strict statistical requirements combined with the minimum cluster size.
We have identified two systems between the insula and cingulate cortices and used functional fingerprints as a means to convey the connectivity of insular subregions with other brain areas. Previous studies have used the concept of “fingerprints” to display specific patterns of brain activity as polar plot displays of measures ranging from power spectrum peaks to descriptive measures of shape (DeMartino et al.,2007). In addition, Passingham et al. (2002) used fingerprints to display cytoarchetectonic and functional connectivity (Passingham et al.,2002). We now introduce a new application of functional fingerprinting to highlight the strength of resting state connectivity (i.e., correlation of oscillatory activity) between brain areas and conceptualize functional networks based on low‐frequency resting state oscillations.
Taken together, the known anatomical projections in the primate brain, combined with the functional connectivity analysis performed in our study and previous functional imaging data indicate two distinct systems between the insula and the cingulate in the adult human brain, for which we suggest the following possible functions: (1) an emotional salience monitoring system linking the anterior insula with the pACC/aMCC, a system responsible for integrating interoceptive information with emotional salience forming a subjective image of our bodily state; and (2) a general salience and action system that links the entire insula and MCC, a system involved in environmental monitoring, response selection and skeletomotor body orientation.
Acknowledgements
KDD is a Canada Research Chair in Brain and Behavior. The authors thank Mr. Geoff Pope for his expert technical assistance.
REFERENCES
- Apkarian AV,Bushnell MC,Treede RD,Zubieta JK ( 2005): Human brain mechanisms of pain perception and regulation in health and disease. Eur J Pain 9: 463–484. [DOI] [PubMed] [Google Scholar]
- Augustine JR ( 1985): The insular lobe in primates including humans. Neurol Res 7: 2–10. [DOI] [PubMed] [Google Scholar]
- Augustine JR ( 1996): Circuitry and functional aspects of the insular lobe in primates including humans. Brain Res Brain Res Rev 22: 229–244. [DOI] [PubMed] [Google Scholar]
- Birn RM ( 2007): The behavioral significance of spontaneous fluctuations in brain activity. Neuron 56: 8–9. [DOI] [PubMed] [Google Scholar]
- Birn RM,Diamond JB,Smith MA,Bandettini PA ( 2006): Separating respiratory‐variation‐related fluctuations from neuronal‐activity‐related fluctuations in fMRI. Neuroimage 31: 1536–1548. [DOI] [PubMed] [Google Scholar]
- Birn RM,Murphy K,Bandettini PA ( 2008a): The effect of respiration variations on independent component analysis results of resting state functional connectivity. Hum Brain Mapp 29: 740–750. [DOI] [PMC free article] [PubMed] [Google Scholar]
- Birn RM,Smith MA,Jones TB,Bandettini PA ( 2008b): The respiration response function: The temporal dynamics of fMRI signal fluctuations related to changes in respiration. Neuroimage 40: 644–654. [DOI] [PMC free article] [PubMed] [Google Scholar]
- Biswal B,Yetkin FZ,Haughton VM,Hyde JS ( 1995): Functional connectivity in the motor cortex of resting human brain using echo‐planar MRI. Magn Reson Med 34: 537–541. [DOI] [PubMed] [Google Scholar]
- Brooks JC,Nurmikko TJ,Bimson WE,Singh KD,Roberts N, ( 2002): fMRI of thermal pain: Effects of stimulus laterality and attention. Neuroimage 15: 293–301. [DOI] [PubMed] [Google Scholar]
- Brooks JCW,Zambreanu L,Godinez A,Craig AD,Tracey I, ( 2005): Somatotopic organization of the human insula to painful heat studied with high resolution functional imaging. Neuroimage 27: 201–209. [DOI] [PubMed] [Google Scholar]
- Buchel C,Morris J,Dolan RJ,Friston KJ ( 1998): Brain systems mediating aversive conditioning: An event‐related fMRI study. Neuron 20: 947–957. [DOI] [PubMed] [Google Scholar]
- Bush G,Luu P,Posner MI ( 2000): Cognitive and emotional influences in anterior cingulate cortex. Trends Cogn Sci 4: 215–222. [DOI] [PubMed] [Google Scholar]
- Cole J,Bushnell MC,McGlone F,Elam M,Lamarre Y,Vallbo A,Olausson H ( 2006): Unmyelinated tactile afferents underpin detection of low‐force monofilaments. Muscle Nerve 34: 105–107. [DOI] [PubMed] [Google Scholar]
- Cordes D,Haughton VM,Arfanakis K,Carew JD,Turski PA,Moritz CH,Quigley MA,Meyerand ME ( 2001): Frequencies contributing to functional connectivity in the cerebral cortex in “resting‐state” data. AJNR Am J Neuroradiol 22: 1326–1333. [PMC free article] [PubMed] [Google Scholar]
- Craig AD ( 2002): How do you feel? Interoception: The sense of the physiological condition of the body. Nat Rev Neurosci 3: 655–666. [DOI] [PubMed] [Google Scholar]
- Craig AD ( 2003): Pain mechanisms: Labeled lines versus convergence in central processing. Annu Rev Neurosci 26: 1–30. [DOI] [PubMed] [Google Scholar]
- Craig AD ( 2004): Human feelings: Why are some more aware than others? Trends Cogn Sci 8: 239–241. [DOI] [PubMed] [Google Scholar]
- Craig AD ( 2008): Interoception and emotion: A neuroanatomical perspective In: Lewis M,Haviland‐Jones J,Barrett L, editors. Handbook of Emotions. New York: Guildford Press; pp 272–287. [Google Scholar]
- Craig AD,Chen K,Bandy D,Reiman EM ( 2000): Thermosensory activation of insular cortex. Nat Neurosci 3: 184–190. [DOI] [PubMed] [Google Scholar]
- Critchley HD ( 2004): The human cortex responds to an interoceptive challenge. Proc Natl Acad Sci USA 101: 6333–6334. [DOI] [PMC free article] [PubMed] [Google Scholar]
- Critchley HD,Mathias CJ,Josephs O,O'Doherty J,Zanini S,Dewar BK,Cipolotti L,Shallice T,Dolan RJ ( 2003): Human cingulate cortex and autonomic control: Converging neuroimaging and clinical evidence. Brain 126: 2139–2152. [DOI] [PubMed] [Google Scholar]
- Critchley HD,Tang J,Glaser D,Butterworth B,Dolan RJ ( 2005): Anterior cingulate activity during error and autonomic response. Neuroimage 27: 885–895. [DOI] [PubMed] [Google Scholar]
- Critchley HD,Wiens S,Rotshtein P,Ohman A,Dolan RJ, ( 2004): Neural systems supporting interoceptive awareness. Nat Neurosci 7: 189–195. [DOI] [PubMed] [Google Scholar]
- Damoiseaux JS,Rombouts SA,Barkhof F,Scheltens P,Stam CJ,Smith SM,Beckmann CF ( 2006): Consistent resting‐state networks across healthy subjects. Proc Natl Acad Sci USA 103: 13848–13853. [DOI] [PMC free article] [PubMed] [Google Scholar]
- Davis KD,Hutchison WD,Lozano AM,Tasker RR,Dostrovsky JO ( 2000): Human anterior cingulate cortex neurons modulated by attention‐demanding tasks. J Neurophysiol 83: 3575–3577. [DOI] [PubMed] [Google Scholar]
- Davis KD,Pope G,Chen J,Kwan CL,Crawley AP,Diamant NE ( 2008): Cortical thinning in IBS: Implications for homeostatic, attention, and pain processing. Neurology 70: 153–154. [DOI] [PubMed] [Google Scholar]
- Davis KD,Pope GE,Crawley AP,Mikulis DJ ( 2004): Perceptual illusion of “paradoxical heat” engages the insular cortex. J Neurophysiol 92: 1248–1251. [DOI] [PubMed] [Google Scholar]
- Davis KD,Taylor KS,Hutchison WD,Dostrovsky JO,McAndrews MP,Richter EO,Lozano AM ( 2005): Human anterior cingulate cortex neurons encode cognitive and emotional demands. J Neurosci 25: 8402–8406. [DOI] [PMC free article] [PubMed] [Google Scholar]
- Davis KD,Taylor SJ,Crawley AP,Wood ML,Mikulis DJ, ( 1997): Functional MRI of pain‐ and attention‐related activations in the human cingulate cortex. J Neurophysiol 77: 3370–3380. [DOI] [PubMed] [Google Scholar]
- DeLuca M,Beckmann CF,De SN,Matthews PM,Smith SM, ( 2006): fMRI resting state networks define distinct modes of long‐distance interactions in the human brain. Neuroimage 29: 1359–1367. [DOI] [PubMed] [Google Scholar]
- DeMartino F,Gentile F,Esposito F,Balsi M,Di SF,Goebel R,Formisano E ( 2007): Classification of fMRI independent components using IC‐fingerprints and support vector machine classifiers. Neuroimage 34: 177–194. [DOI] [PubMed] [Google Scholar]
- Devinsky O,Morrell MJ,Vogt BA ( 1995): Contributions of anterior cingulate cortex to behavior. Brain 118 (Pt 1): 279–306. [DOI] [PubMed] [Google Scholar]
- Dosenbach NU,Fair DA,Miezin FM,Cohen AL,Wenger KK,Dosenbach RA,Fox MD,Snyder AZ,Vincent JL,Raichle ME,Schlaggar BL,Petersen SE ( 2007): Distinct brain networks for adaptive and stable task control in humans. Proc Natl Acad Sci USA 104: 11073–11078. [DOI] [PMC free article] [PubMed] [Google Scholar]
- Dosenbach NU,Visscher KM,Palmer ED,Miezin FM,Wenger KK,Kang HC,Burgund ED,Grimes AL,Schlaggar BL,Petersen SE ( 2006): A core system for the implementation of task sets. Neuron 50: 799–812. [DOI] [PMC free article] [PubMed] [Google Scholar]
- Downar J,Crawley AP,Mikulis DJ,Davis KD ( 2000): A multimodal cortical network for the detection of changes in the sensory environment. Nat Neurosci 3: 277–283. [DOI] [PubMed] [Google Scholar]
- Downar J,Crawley AP,Mikulis DJ,Davis KD ( 2002): A cortical network sensitive to stimulus salience in a neutral behavioral context across multiple sensory modalities. J Neurophysiol 87: 615–620. [DOI] [PubMed] [Google Scholar]
- Downar J,Mikulis DJ,Davis KD ( 2003): Neural correlates of the prolonged salience of painful stimulation. Neuroimage 20: 1540–1551. [DOI] [PubMed] [Google Scholar]
- Dux PE,Ivanoff J,Asplund CL,Marois R ( 2006): Isolation of a central bottleneck of information processing with time‐resolved fMRI. Neuron 52: 1109–1120. [DOI] [PMC free article] [PubMed] [Google Scholar]
- Etkin A,Egner T,Peraza DM,Kandel ER,Hirsch J ( 2006): Resolving emotional conflict: A role for the rostral anterior cingulate cortex in modulating activity in the amygdala. Neuron 51: 871–882. [DOI] [PubMed] [Google Scholar]
- Fair DA,Dosenbach NU,Church JA,Cohen AL,Brahmbhatt S,Miezin FM,Barch DM,Raichle ME,Petersen SE,Schlaggar BL ( 2007): Development of distinct control networks through segregation and integration. Proc Natl Acad Sci USA 104: 13507–13512.17679691 [Google Scholar]
- Fox MD,Corbetta M,Snyder AZ,Vincent JL,Raichle ME ( 2006): Spontaneous neuronal activity distinguishes human dorsal and ventral attention systems. Proc Natl Acad Sci USA 103: 10046–10051. [DOI] [PMC free article] [PubMed] [Google Scholar]
- Fox MD,Raichle ME ( 2007): Spontaneous fluctuations in brain activity observed with functional magnetic resonance imaging. Nat Rev Neurosci 8: 700–711. [DOI] [PubMed] [Google Scholar]
- Fox MD,Snyder AZ,Vincent JL,Corbetta M,Van E,Raichle ME ( 2005): The human brain is intrinsically organized into dynamic, anticorrelated functional networks. Proc Natl Acad Sci USA 102: 9673–9678. [DOI] [PMC free article] [PubMed] [Google Scholar]
- Friston KJ,Frith CD,Liddle PF,Frackowiak RS ( 1993): Functional connectivity: The principal‐component analysis of large (PET) data sets. J Cereb Blood Flow Metab 13: 5–14. [DOI] [PubMed] [Google Scholar]
- Greicius MD,Krasnow B,Reiss AL,Menon V ( 2003): Functional connectivity in the resting brain: A network analysis of the default mode hypothesis. Proc Natl Acad Sci USA 100: 253–258. [DOI] [PMC free article] [PubMed] [Google Scholar]
- Greicius MD,Srivastava G,Reiss AL,Menon V ( 2004): Default‐mode network activity distinguishes Alzheimer's disease from healthy aging: Evidence from functional MRI. Proc Natl Acad Sci USA 101: 4637–4642. [DOI] [PMC free article] [PubMed] [Google Scholar]
- Hatanaka N,Tokuno H,Hamada I,Inase M,Ito Y,Imanishi M,Hasegawa N,Akazawa T,Nambu A,Takada M ( 2003): Thalamocortical and intracortical connections of monkey cingulate motor areas. J Comp Neurol 462: 121–138. [DOI] [PubMed] [Google Scholar]
- Horwitz B ( 2003): The elusive concept of brain connectivity. Neuroimage 19: 466–470. [DOI] [PubMed] [Google Scholar]
- Hutchison WD,Davis KD,Lozano AM,Tasker RR,Dostrovsky JO ( 1999): Pain‐related neurons in the human cingulate cortex. Nat Neurosci 2: 403–405. [DOI] [PubMed] [Google Scholar]
- Kwan CL,Diamant NE,Pope G,Mikula K,Mikulis DJ,Davis KD ( 2005): Abnormal forebrain activity in functional bowel disorder patients with chronic pain. Neurology 65: 1268–1277. [DOI] [PubMed] [Google Scholar]
- Margulies DS,Kelly AM,Uddin LQ,Biswal BB,Castellanos FX,Milham MP ( 2007): Mapping the functional connectivity of anterior cingulate cortex. Neuroimage 37: 579–588. [DOI] [PubMed] [Google Scholar]
- Mayberg HS,Brannan SK,Tekell JL,Silva JA,Mahurin RK,McGinnis S,Jerabek PA ( 2000): Regional metabolic effects of fluoxetine in major depression: Serial changes and relationship to clinical response. Biol Psychiatry 48: 830–843. [DOI] [PubMed] [Google Scholar]
- Mesulam MM,Mufson EJ ( 1982a) Insula of the old world monkey. I. Architectonics in the insulo‐orbito‐temporal component of the paralimbic brain. J Comp Neurol 212: 1–22. [DOI] [PubMed] [Google Scholar]
- Mesulam MM,Mufson EJ ( 1982b) Insula of the old world monkey. III. Efferent cortical output and comments on function. J Comp Neurol 212: 38–52. [DOI] [PubMed] [Google Scholar]
- Mufson EJ,Mesulam MM ( 1982): Insula of the old world monkey. II. Afferent cortical input and comments on the claustrum. J Comp Neurol 212: 23–37. [DOI] [PubMed] [Google Scholar]
- Mufson EJ,Mesulam MM ( 1984): Thalamic connections of the insula in the rhesus monkey and comments on the paralimbic connectivity of the medial pulvinar nucleus. J Comp Neurol 227: 109–120. [DOI] [PubMed] [Google Scholar]
- Naidich TP,Kang E,Fatterpekar GM,Delman BN,Gultekin SH,Wolfe D,Ortiz O,Yousry I,Weismann M,Yousry TA ( 2004): The insula: Anatomic study and MR imaging display at 1.5 T. Am J Neuroradiol 25: 222–232. [PMC free article] [PubMed] [Google Scholar]
- Olausson H,Charron J,Marchand S,Villemure C,Strigo IA,Bushnell MC ( 2005): Feelings of warmth correlate with neural activity in right anterior insular cortex. Neurosci Lett 389: 1–5. [DOI] [PubMed] [Google Scholar]
- Oldfield RC ( 1971): The assessment and analysis of handedness: The Edinburgh inventory. Neuropsychologia 9: 97–113. [DOI] [PubMed] [Google Scholar]
- Ostrowsky K,Magnin M,Ryvlin P,Isnard J,Guenot M,Mauguiere F ( 2002): Representation of pain and somatic sensation in the human insula: A study of responses to direct electrical cortical stimulation. Cereb Cortex 12: 376–385. [DOI] [PubMed] [Google Scholar]
- Passingham RE,Stephan KE,Kotter R ( 2002): The anatomical basis of functional localization in the cortex. Nat Rev Neurosci 3: 606–616. [DOI] [PubMed] [Google Scholar]
- Phan KL,Wager T,Taylor SF,Liberzon I ( 2002): Functional neuroanatomy of emotion: A meta‐analysis of emotion activation studies in PET and fMRI. Neuroimage 16: 331–348. [DOI] [PubMed] [Google Scholar]
- Phillips ML,Young AW,Scott SK,Calder AJ,Andrew C,Giampietro V,Williams SC,Bullmore ET,Brammer M,Gray JA ( 1998): Neural responses to facial and vocal expressions of fear and disgust. Proc Biol Sci 265: 1809–1817. [DOI] [PMC free article] [PubMed] [Google Scholar]
- Pollatos O,Gramann K,Schandry R ( 2007): Neural systems connecting interoceptive awareness and feelings. Hum Brain Mapp 28: 9–18. [DOI] [PMC free article] [PubMed] [Google Scholar]
- Raichle ME,MacLeod AM,Snyder AZ,Powers WJ,Gusnard DA,Shulman GL ( 2001): A default mode of brain function. Proc Natl Acad Sci USA 98: 676–682. [DOI] [PMC free article] [PubMed] [Google Scholar]
- Rainville P,Duncan GH,Price DD,Carrier B,Bushnell MC, ( 1997): Pain affect encoded in human anterior cingulate but not somatosensory cortex. Science 277: 968–971. [DOI] [PubMed] [Google Scholar]
- Rushworth MF,Buckley MJ,Behrens TE,Walton ME,Bannerman DM ( 2007): Functional organization of the medial frontal cortex. Curr Opin Neurobiol 17: 220–227. [DOI] [PubMed] [Google Scholar]
- Schweinhardt P,Glynn C,Brooks J,McQuay H,Jack T,Chessell I,Bountra C,Tracey I ( 2006): An fMRI study of cerebral processing of brush‐evoked allodynia in neuropathic pain patients. Neuroimage 32: 256–265. [DOI] [PubMed] [Google Scholar]
- Seeley WW,Menon V,Schatzberg AF,Keller J,Glover GH,Kenna H,Reiss AL,Greicius MD ( 2007): Dissociable intrinsic connectivity networks for salience processing and executive control. J Neurosci 27: 2349–2356. [DOI] [PMC free article] [PubMed] [Google Scholar]
- Seminowicz DA,Davis KD ( 2007): Pain enhances functional connectivity of a brain network evoked by performance of a cognitive task. J Neurophysiol 97: 3651–3659. [DOI] [PubMed] [Google Scholar]
- Shmueli K,van GP,de Zwart JA,Horovitz SG,Fukunaga M,Jansma JM,Duyn JH ( 2007): Low‐frequency fluctuations in the cardiac rate as a source of variance in the resting‐state fMRI BOLD signal. Neuroimage 38: 306–320. [DOI] [PMC free article] [PubMed] [Google Scholar]
- Singer T,Seymour B,O'Doherty J,Kaube H,Dolan RJ,Frith CD ( 2004): Empathy for pain involves the affective but not sensory components of pain. Science 303: 1157–1162. [DOI] [PubMed] [Google Scholar]
- Talairach J,Tournoux P ( 1988): Co‐Planar Stereotaxic Atlas of the Human Brain. New York: Thieme Medical Publishers Inc. [Google Scholar]
- Ture U,Yasargil DC,Al‐Mefty O,Yasargil MG ( 1999): Topographic anatomy of the insular region. J Neurosurg 90: 720–733. [DOI] [PubMed] [Google Scholar]
- Varnavas GG,Grand W ( 1999): The insular cortex: Morphological and vascular anatomic characteristics. Neurosurgery 44: 127–136. [DOI] [PubMed] [Google Scholar]
- Vogt BA ( 2005): Pain and emotion interactions in subregions of the cingulate gyrus. Nat Rev Neurosci 6: 533–544. [DOI] [PMC free article] [PubMed] [Google Scholar]
- Vogt BA,Pandya DN ( 1987): Cingulate cortex of the rhesus monkey: II. Cortical afferents. J Comp Neurol 262: 271–289. [DOI] [PubMed] [Google Scholar]
- Vogt BA,Rosene DL,Pandya DN ( 1979): Thalamic and cortical afferents differentiate anterior from posterior cingulate cortex in the monkey. Science 204: 205–207. [DOI] [PubMed] [Google Scholar]
- Vogt BA,Vogt L,Farber NB,Bush G ( 2005): Architecture and neurocytology of monkey cingulate gyrus. J Comp Neurol 485: 218–239. [DOI] [PMC free article] [PubMed] [Google Scholar]
- Wise RG,Ide K,Poulin MJ,Tracey I ( 2004): Resting fluctuations in arterial carbon dioxide induce significant low frequency variations in BOLD signal. Neuroimage 21: 1652–1664. [DOI] [PubMed] [Google Scholar]
- Xiong J,Parsons LM,Gao JH,Fox PT ( 1999): Interregional connectivity to primary motor cortex revealed using MRI resting state images. Hum Brain Mapp 8: 151–156. [DOI] [PMC free article] [PubMed] [Google Scholar]