

Abstract
In this multicenter study, we used dynamic causal modeling to characterize the abnormalities of effective connectivity of the sensorimotor network in 61 patients with multiple sclerosis (MS) compared with 74 age‐matched healthy subjects. We also investigated the correlation of such abnormalities with findings derived from structural MRI. In a subgroup of subjects, diffusion tensor (DT) MRI metrics of the corpus callosum and the left corticospinal tract (CST) were also assessed. MS patients showed increased effective connectivity relative to controls between: (a) the left primary SMC and the left dorsal premotor cortex (PMd), (b) the left PMd and the supplementary motor areas (SMA), (c) the left secondary sensorimotor cortex (SII) and the SMA, (d) the right SII and the SMA, (e) the left SII and the right SII, and (f) the right SMC and the SMA. MS patients had relatively reduced effective connectivity between the left SMC and the right cerebellum. No interaction was found between disease group and center. Coefficients of altered connectivity were weakly correlated with brain T2 LV, but moderately correlated with DT MRI‐measured damage of the left CST. In conclusion, large multicenter fMRI studies of effective connectivity changes in diseased people are feasible and can facilitate studies with sample size large enough for robust outcomes. Increased effective connectivity in the patients for the simple motor task suggests local network modulation contributing to enhanced long‐distance effective connectivity in MS patients. This extends and generalizes previous evidence that enhancement of effective connectivity may provide an important compensatory mechanism in MS. Hum Brain Mapp, 2009. © 2008 Wiley‐Liss, Inc.
Keywords: multicenter, multiple sclerosis, connectivity, sensorimotor network
INTRODUCTION
Several functional MRI (fMRI) studies have shown consistently an increased recruitment of regions of the sensorimotor network in multiple sclerosis (MS) patients with preserved hand motor function in comparison with healthy controls [Rocca and Filippi,2007]. The correlations found by the majority of these studies between measures of abnormal brain activations and quantitative MR metrics of structural tissue damage [Rocca and Filippi,2007] have supported the notion that, at least in some phases of the disease, functional cortical changes might have an adaptive role in limiting the clinical consequences of irreversible tissue damage.
Recently, the development of more sophisticated postprocessing methods has made feasible the analysis of the connections among cortical areas in normal and diseased people [Friston et al.,2003]. Although the application of these methods in the clinical arena is still in its infancy, a few preliminary studies in selected and small groups of MS patients [Au Duong et al.,2005a,b; Cader et al.,2006; Rocca et al.,2007, in press] suggest that the assessment of abnormal effective connectivity might complement the more “classical” analysis of the extent and displacement of fMRI activation. In addition, it has also been suggested that the use of a regional approach for the assessment of the correlations between structural and fMRI findings, through a combination of measures of functional connectivity and structural damage to selected brain regions [Lowe et al.,2008; Rocca et al.,2007, in press], might be a valuable tool to improve our understanding of the nature of abnormality of function in MS patients. Here, we characterized effective connectivity (the directed causal influence of one neuronal system on another) as opposed to simply looking at functional connectivity or correlations between observed hemodynamic responses, such as coherence [Tecchio et al.,2008] or correlations in low‐frequency fMRI fluctuations [Lowe et al.,2002,2008].
Because one of the major drawback of previous studies in the field was the small samples of patients enrolled, which were inevitably representative of a limited range of disease clinical phenotypes, it remains to be established whether their results are robust enough to be considered representative of what really occurs in MS as a whole. Should this be achieved, the next step would be the application of this new approach to define the evolution of functional changes and how they relate to the clinical manifestations of the disease. Both these two goals are likely to require large sample of patients followed longitudinally and, hence, the design of multicenter studies.
Recently, a multicenter fMRI study has interrogated the movement‐associated brain pattern of activations in a large sample of MS patients with preserved hand motor function and with clinical characteristics spanning through a wide range of disability, and has confirmed the increased recruitment of several areas of the motor network in these patients in comparison with healthy controls [Wegner et al.,2008]. Against this background, we took advantage of such fMRI database to: (1) define whether and how effective connectivity of the sensorimotor network is affected by MS and (2) investigate the correlation between measures of effective connectivity and those of structural global [T2 lesion volume (LV)] and regional [atrophy and diffusivity changes of the left corticospinal tract (CST) and the corpus callosum (CC)] damage.
PATIENTS AND METHODS
Patients
Sixty‐one patients with MS (24 male, 37 female, mean age [SD] = 35.7 [7.4] years, mean disease duration [SD] = 7.8 [5.3] years, median Expanded Disability Status Scale (EDSS) score [Kurtzke,1983] [range] = 2.5 [0.0–7.5]) and 74 healthy controls (40 male, 34 female, mean age [SD] = 30.7 [7.1] years) entered in this study. The study included more subjects than those of the previous study of Wegner et al. [2008], because fMRI analysis was done only on data of one of the four runs of the fMRI experiment [see Wegner et al.,2008 for more details]. Therefore, the data of a few subjects that were previously excluded for excessive movements across the four runs could be used for this analysis. Subjects were studied at eight European centers, which included: (a) the Department of Radiology, VU University Medical Centre, Amsterdam (Netherlands); (b) the MR Unit, Hospital Vall d'Hebron, Barcelona (Spain); (c) the Neurology/Neuroradiology Department, University of Basel, Basel (Switzerland); (d) the MR Research Unit, Medical University Graz, Graz (Austria); (e) the QS Imaging Centre, Institute of Neurology, University College London, London (UK); (f) the Neuroimaging Research Unit, University Hospital San Raffaele Milan, Milan (Italy); (g) the Centre for Functional Magnetic Resonance Imaging of the Brain, University of Oxford, Oxford (UK); and (h) the Department of Neurological and Behavioral Sciences, University of Siena, Siena (Italy).
The inclusion criteria of this study required all subjects to be right‐handed (Edinburgh Handedness Inventory) [Oldfield,1971]. In addition, patients included in the study had to fulfill the following criteria: a diagnosis of relapsing remitting (RR) or secondary progressive MS, no relapse or corticosteroids treatment within the previous 3 months prior to scanning, an EDSS score ≤7.5 [Kurtzke,1983], no clinically apparent right hand impairment at the neurological examination, and no visual acuity or field deficits. Local ethics approval was obtained at all sites and all subjects gave informed consent.
Experimental Design
The fMRI experiment used a “block” design sequence (ABAB), with six periods of a 30 s visual cue for hand movement (A) alternated with six periods of 30 s rest in the dark (B). Patients and healthy controls were instructed to repetitively flex and extend the last four fingers of their right hand with each flash of the light in the visual cue. The same standardized hand frame was used at all sites to restrict the maximum amplitude of the finger extension to 3 cm. All centers were supplied with a metronome equipped with a red flashing LED to pace the movements at 1 Hz frequency. Patients and controls were trained and observed before performing the experiment to ensure their understanding and ability to comply with the protocol. No cue was supplied during rest periods. Subjects were monitored visually during the scan to ensure accurate task performance and to check for additional movements (e.g., mirror movements).
fMRI Acquisition
Brain MRI scans were obtained using a magnet operating at 1.5 T at all sites (see Table I for further details). Sagittal T1‐weighted images were acquired to define the anterior‐posterior commissural plane. Functional MR images were obtained in all sites using a multislice gradient echo planar imaging (EPI) sequence: echo time = 60 ms, repetition time = 3,000 ms, field of view = 240 × 240 mm2, matrix = 64 × 64, 21 contiguous axial slices with a slice thickness = 6 mm, parallel to the anterior‐posterior commissural plane.
Table I.
Main hardware characteristics, acquisition parameters of structural MRI sequences, and averagesignal‐to‐noise ratio (SNR) from the left primary sensorimotor cortex (SMC) in the different centers participating into the study
| Scanner | Coil | Dual/T2‐weighted sequence | FLAIR sequence | 3D T1‐weighted sequence | Average SNR (SD) | |
|---|---|---|---|---|---|---|
| Center 1 | Siemens Sonata | Circular polarized head coil | TR = 2800 TE = 94 slices = 19 thickness = 3 FOV = 250 matrix = (205)2 | TR = 9000 TE = 105 TI = 2200 slices = 17 thickness = 5 FOV = 250 | TR = 2700 TE = 4 slices = 160thickness = 1.5 FOV = 260orientation = axial | 190.3 (22.3) |
| Center 2 | Siemens Symphony Maestro Class | Quadrature whole head coil | TR = 3500 TE = 14/86slices = 23 thickness = 5 FOV = 256 matrix = (256)2 | TR = 9000 TE = 114 TI = 2500 slices = 23 thickness = 5 FOV = 250 | TR = 2050 TE = 3.93 slices = 144 thickness = 1 FOV = 256 orientation = sagittal | 230.8 (14.5) |
| Center 3 | Siemens Sonata | Circular polarized head coil | TR = 3230 TE = 84 slices = 21 thickness = 5 FOV = 240 matrix = (512)2 | TR = 9000 TE = 108 TI=2400 slices = 21 thickness = 5 FOV = 240 | TR = 1800 TE = 4.38 slices = 144 thickness = 1 FOV = 240 orientation = axial | 301.5 (20.6) |
| Center 4 | Philips Intera | Circular polarized head coil | TR = 2300 TE = 80 slices = 24 thickness = 5.5 FOV = 230 Matrix = (256)2 | TR = 8000 TE = 110 TI = 2100 slices = 24 thickness = 5 FOV = 230 mm | TR = 20 TE = 4 slices = 126 thickness = 1FOV = 256 orientation = axial | 356.5 (18.2) |
| Center 5 | GE Signa Excite 11.0 | Birdcage head coil | TR = 5900 TE = 102 slices = 22 thickness = 5 FOV = 240 matrix = (512)2 | TR = 9895 TE = 140 TI = 2473 slices = 22 thickness = 5 FOV = 240 matrix = (256)2 | TR = 20 TE = 2.3 slices = 146thickness = 1.5 FOV = 260 orientation = coronal | 300.8 (19.3) |
| Center 6 | Siemens Vision | Quadrature whole head coil | TR = 3300 TE = 16/98 slices = 24 thickness = 5 FOV = 250 matrix = (256)2 | NA | TR = 11.4 TE = 4.4 slices = 160 thickness = 1 FOV = 250 orientation = sagittal | 79.1 (9.4) |
| Center 7 | Siemens Sonata | Circular polarized head coil | TR = 5000 TE = 90 slices = 25thickness = 6 FOV = 250 matrix = (256)2 | TR = 10000 TE = 139 TI = 2400 slices = 25 thickness = 6 FOV = 250 | NA | 337.8 (24.3) |
| Center 8 | Philips Gyroscan ACS‐NT15 | Standard head coil | TR = 2074 TE = 34 slices = 50 thickness = 3 FOV = 250 matrix = (256)2 | TR = 9000 TE = 150 TI = 2725 slices = 50 thickness = 3 FOV = 250 | TR = 20 TE = 3 slices = 50 thickness = 3 FOV = 250 orientation = axial | 267.5 (10.2) |
TR, TE, and TI are expressed in ms, slice thickness and FOV are expressed in mm, SNR is a dimensionless index.
TR, repetition time; TE, echo time; TI, inversion time; FOV, field of view; SNR, signal‐to‐noise ratio; NA, not acquired.
Structural MRI Acquisition
On the same occasion and using the same magnet, the following sequences were also obtained from the brain of all the subjects: (1) dual‐echo turbo spin echo (TSE) or T2‐weighted TSE and fluid‐attenuated inversion recovery (FLAIR) sequences and (2) high‐resolution 3D T1‐weighted. None of the centers used parallel imaging strategies. Table I reports the main MRI acquisition parameters used in each center as well as the main scanner characteristics. In Amsterdam and Milan, a diffusion tensor (DT) echo planar sequence was also acquired from 10 patients and 17 controls, with demographic and clinical characteristics comparable to those of the entire cohort.
fMRI Analysis
fMRI data were analyzed using the statistical parametric mapping (SPM2) software [Friston et al.,1995]. Prior to statistical analysis, all images were realigned to the first one to correct for subject motion, spatially normalized into the standard space of SPM, and smoothed with a 10‐mm, 3D‐Gaussian filter. Subjects were included in the subsequent statistical analysis if they had a maximum cumulative translation lower than 3.0 mm in the x,y,z planes (lower than 1.0 mm for each plane) or a maximum cumulative rotation of 0.5°.
Changes in blood oxygenation level dependent (BOLD) contrast associated with the performance of the motor task were assessed on a voxel by voxel basis, using the general linear model and the theory of Gaussian fields [Friston et al.,1995]. Specific effects were tested by applying appropriate linear contrasts. Significant hemodynamic changes were assessed using t statistical parametric maps (SPMt). The within‐group activations were investigated using a random‐effect analysis [Friston et al.,1999] and a one‐sample t‐test.
Analysis of Effective Connectivity
Definition of brain regions included in the dynamic causal modeling (DCM) [Friston et al.,2003] relied on data from published fMRI studies of the motor system [Rocca and Filippi,2007; Ward,2006] and the results of the within‐ and between‐group analysis of this study, which have been reported elsewhere [Wegner et al.,2008]. Time series, which were adjusted for confounds, were extracted from a spherical volume (5‐mm radius) centered at the most significant voxel within an a priori defined cluster in the SPMf mean statistical parametric maps (i.e., SPM maps thresholded using an F‐contrast) in each subject. Volumes of interest were extracted from the clusters with the highest peak of activations in the primary sensorimotor cortex (SMC), bilaterally, the secondary sensorimotor cortex (SII), bilaterally, the left dorsal premotor cortex (PMd), the supplementary motor area (SMA), the left thalamus, and the right cerebellum. These regions were entered into subject‐specific DCMs. For each subject, the DCM was used to investigate the intrinsic connectivity pattern between all regions of interest previously defined. To this end, a DCM was constructed, where all regions were assumed to be connected bidirectionally with each other. We determined in healthy volunteers and MS patients, separately, which of the regions defined by the fMRI analysis was the most likely input region. To test which model fitted best the observed findings, eight different fully connected models were built, each DCM modeling the origin of movement‐related activity in one of the eight regions. Model evidence was computed using the Bayesian and Akaikes information criterion (BIC and AIC, respectively), as described in Penny et al. [2004]. These represent bound approximations to the relative model evidences. For each subject and each model, we estimated the corresponding Bayesian factors, and then model evidence for each group, separately, was calculated by multiplying the Bayesian factors obtained for each pair of models and for each subject. This analysis revealed the superiority of the model having the left SMC as the input region in both healthy volunteers and MS patients (Table II). Therefore, this model was used for DCM analysis in each group and drove the contrasts between patients and controls (see later for methodological details). The intrinsic connectivity strength coefficients (A) and their corresponding Bayesian posterior probabilities (pA) were estimated using a Bayesian approach [Friston et al.,2003].
Table II.
Bayes factors from the comparison of the different DCM models tested in healthy controls and MS patients
| Healthy subjects | MS patients | |
|---|---|---|
| L SMC model vs. R cerebellum model vs. vice versa | 4.39 × 10²³ vs. 4.28 × 10⁻¹¹ | 2.55 × 1027 vs. 1.22 × 10⁻¹⁹ |
| L SMC model vs. PMd model vs. vice versa | 2.89 × 1041 vs. 3.73 × 10⁻⁹ | 5.85 × 1034 vs. 1.05 × 10⁻²¹ |
| L SMC model vs. L SII model vs. vice versa | 2.43 × 1031 vs. 7.03 × 10⁻¹⁶ | 3.11 × 1029 vs. 1.46 × 10⁻²¹ |
| L SMC model vs. SMA model vs. vice versa | 2.29 × 10¹⁵ vs. 4.04 | 6.73 × 10¹⁶ vs. 1.29 × 10⁻¹⁷ |
| L SMC model vs. R SMC model vs. vice versa | 8.12 × 1029 vs. 5.04 × 10⁻⁹ | 2.15 × 10²⁰ vs. 8.52 × 10⁻¹⁷ |
L, left; R, right; SMC, primary sensorimotor cortex; PMd, dorsal premotor cortex; SMA, supplementary motor area; SII, secondary sensorimotor cortex.
Structural MRI Postprocessing
Total T2 LV was measured using a local thresholding segmentation technique (Jim 4.0, Xinapse System, Leicester, UK) on the T2‐weighted image of each patient, using the PD or the FLAIR images as a reference. The LV of the CC and the left and right CST was calculated using a white‐matter (WM) atlas [Mori,2005] available within the FSL library and containing labels of 50 structures. First, a lesion mask from the manually segmented lesions visible on the dual‐echo images was produced. Then, the affine transformation between the T2‐weighted images and the atlas space was calculated and applied to lesion masks. Results of the affine registration were visually inspected for each subject to ensure a good registration quality between subjects and the WM atlas. Finally, the LV within the fiber bundles of interest was calculated.
Normalized brain volumes (NBV) were measured on the 3D T1‐weighted images, using the cross‐sectional version of the Structural Imaging Evaluation of Normalized Atrophy (SIENA) software [Smith et al.,2001]. To standardize NBV analysis, all images were first reoriented in the axial plane and resampled to a resolution of 1 × 1 × 1 mm3. To avoid potential problems related to different between centers quality of GM/WM contrast, SIENAx was run without segmenting the brain into GM and WM tissues, but only by segmenting the entire brain tissue from cerebrospinal fluid. Although the MRI acquisition protocols in all centers allowed complete brain coverage to reduce variability in the brain volumes, SIENAx was run with the additional setting of upper and lower limits along the Z‐axis (70 and −60, respectively) in the standard space. For each subject, the area of the CC was also measured on the midsagittal slice of the 3D T1‐weighted images using the local thresholding segmentation technique previously described (Jim 4.0, Xinapse System, Leicester, UK). Areas were expressed in mm2. Measurements of CC area were repeated two times, and a mean value was calculated and entered into the analysis.
For DT MRI images, the DT was estimated by using a nonlinear regression (Marquardt–Levenberg method), assuming a monoexponential relationship between signal intensity and the b‐matrix components [Basser et al.,1994]. After diagonalization of the estimated tensor matrix, the two scalar invariants of the tensor, mean diffusivity (MD) and fractional anisotropy (FA), were derived for every pixel as well as the three eigenvalues (λ1, λ2, and λ3) of the DT. The eigenvalues were used to measure axial (λ1) and radial (average of λ2 and λ3) diffusivity. Then, MD, FA, axial and radial diffusivity values were calculated in regions of interest (ROI) of 2 × 2 mm2 size, manually applied in the posterior limb of the left internal capsule (to approximate the location of the CST), in areas where no focal T2 lesions were visible. ROIs were also placed bilaterally in the anterior and posterior portions of the CC, as control region.
As recommended for multicenter studies, we also assessed stability and sensitivity differences across sites [Friedman and Glover,2006], by measuring average image signal‐to‐noise ratio (SNR) for each site, assessed according to what was proposed by Friedman and Glover [2006] in a ROI of 10 × 10 × 10 mm3 placed in the left SMC on the entire fMRI data set.
Statistical Analysis
The estimated Bayesian posterior probabilities pA from the DCM model were used to assess which of the potentially existing connections among brain regions were actually present. To do this, pA probabilities (thresholded at log(2)/4) [Friston et al.,2003] of each subject were binarized according to their value: connections with a pA greater or equal to 0.5 were considered to be “real,” whereas those with a pA lower than 0.5 were not considered in the subsequent analysis. Only connections present in at least 5% of the subjects were analyzed for assessing differences between patients and controls.
An ANOVA model adjusted for center and age was used to compare functional and structural MR‐derived metrics between controls and MS patients. False discovery rate (FDR) [Benjamini and Hochberg,1995] was used to correct the P value for multiple comparisons. Univariate correlations between functional and structural metrics as well as between fMRI measures of connectivity and EDSS were assessed using the Spearman rank correlation coefficient. All statistical analysis was performed using SPSS for Windows (version 13.0).
RESULTS
Structural MRI
All healthy volunteers had normal brain MRI scans. In MS patients, the mean T2 LV was 18.2 ml (range = 0.14–84.5 ml), the mean CC T2 LV was 7.1 ml (range = 0–41.4 ml), the mean left CST LV was 5.8 ml (range = 0–31.7), and the mean right CST LV was 1.3 ml (range = 0–9 ml). No difference was found between right and left CST LV.
Compared with healthy controls, MS patients had significant reduced NBV (mean [SD] NBV: 1567 [89] ml in healthy controls vs. 1488 [120] ml in MS patients, P = 0.02) and CC area (mean [SD] CC area: 523.1 [65.8] mm2 in healthy controls vs. 464.6 [81.5] mm2 in MS patients, P < 0.0001).
In the subgroup of MS patients with DT MRI, MD was significantly increased in the CC (mean [SD] MD: 0.77 [0.08] mm2 s−1 × 10⁻³ in healthy controls vs. 0.95 [0.12] mm2 s−1 × 10⁻³ in MS patients, P = 0.01) and in the left CST (mean [SD] MD: 0.73 [0.02] mm2 s−1 × 10⁻³ in healthy controls vs. 0.80 [0.04] mm2 s−1 × 10⁻³ in MS patients, P = 0.03). Compared with controls, these patients also had significant reduction of FA values in the left CST (mean [SD] FA: 0.69 [0.03] in healthy controls vs. 0.63 [0.02] in MS patients, P = 0.03). There was also a significant increase of axial and radial diffusivities in the CC of MS patients compared with controls (mean [SD] axial diffusivity: 0.17 [0.01] mm2 s−1 × 10⁻³ in healthy controls vs. 0.19 [0.01] mm2 s−1 × 10⁻³ in MS patients, P = 0.006; and mean [SD] radial diffusivity: 0.03 [0.007] mm2 s−1 × 10⁻³ in healthy controls vs. 0.04 [0.001] mm2 s−1 × 10⁻³ in MS patients, P = 0.02). MS patients also showed a significant increase of radial diffusivity in the left CST (mean [SD] radial diffusivity: 0.04 [0.001] mm2 s−1 × 10⁻³ in healthy controls vs. 0.05 [0.003] mm2 s−1 × 10⁻³ in MS patients, P < 0.001).
fMRI: Main Effect of Hand Movement
All subjects included in the connectivity analysis performed the tasks correctly. Average SNR values were found to be significant heterogeneous across sites (Table I) (P < 0.001), but there was neither statistical difference in the SNR value from healthy controls and patients within each site nor significant trends of SNR change over time in any site. The mean cumulative translations estimated during the realignment step were 0.15 (SD = 0.015) and 0.37 mm (SD = 0.032) for healthy subjects and MS patients, respectively, whereas mean rotations were less than 0.01° in both groups of subjects. No significant difference was found for any of the realignment metrics between patients and controls. No task‐related movement was observed. The results of the within‐group analysis of activations were similar to those reported by the previous analysis [Wegner et al.,2008] (see Fig. 1). The results of the between‐group comparisons as well as those of the effect of center and age on the observed pattern of activations have already been reported elsewhere [Wegner et al.,2008].
Figure 1.
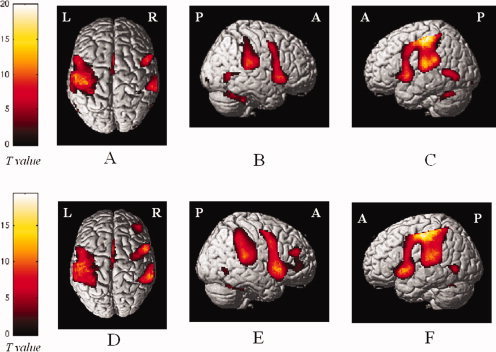
Cortical activations on a rendered brain from healthy controls (A–C) and patients with multiple sclerosis (D–F), during the performance of a simple motor task with the right hand (within‐group analysis; one‐sample t‐test). Activated foci are shown with a significance threshold set at P < 0.05, corrected for multiple comparisons (color‐coded t values). Images are in neurological convention. L, left; R, right. See text for further details.
Effective Connectivity Analysis
In Table III and Figure 2, the results of the comparison of path coefficient strengths between healthy controls and MS patients age and center adjusted are shown. Only connections significantly different between controls and MS patients are reported. Compared with controls, MS patients had a reduced effective connectivity between the left primary SMC and the right anterior lobe of the cerebellum (P = 0.01) and an increased effective connectivity between: (a) the left primary SMC and the left PMd (P = 0.009); (b) the left PMd and the SMA (P = 0.002) and vice versa (P = 0.0009); (c) the left SII and the SMA (P = 0.01) and vice versa (P = 0.03); (d) the right SII and the SMA (P = 0.006) and vice versa (P = 0.03); (e) the left SII and the right SII (P = 0.03); and (f) the right SMC and the SMA (P = 0.03). No significant interaction was found between disease group and center.
Table III.
Significant paths coefficients (mean values and standard deviations) between brain regions of MS patients and controls in the entire study group and in the different centers
| Connection | Center | Connection strength control subjects (SD) | Connection strength MS patients(SD) | * P |
|---|---|---|---|---|
| L SMC—R Cerebellum | Total | 0.21 (0.06) | 0.19 (0.07) | 0.01 |
| Center 1 | 0.24 (0.06) | 0.20 (0.04) | ||
| Center 2 | 0.24 (0.04) | 0.23 (0.06) | ||
| Center 3 | 0.21 (0.05) | 0.16 (0.05) | ||
| Center 4 | 0.19 (0.05) | 0.14 (0.02) | ||
| Center 5 | 0.20 (0.06) | 0.17 (0.05) | ||
| Center 6 | 0.21 (0.05) | 0.19 (0.03) | ||
| Center 7 | 0.27 (0.06) | 0.24 (0.10) | ||
| Center 8 | 0.20 (0.04) | 0.17 (0.05) | ||
| L SMC—L PMd | Total | 0.10 (0.08) | 0.15 (0.07) | 0.009 |
| Center 1 | 0.06 (0.03) | 0.16 (0.08) | ||
| Center 2 | 0.07 (0.04) | 0.18 (0.07) | ||
| Center 3 | 0.11 (0.04) | 0.16 (0.09) | ||
| Center 4 | 0.17 (0.06) | 0.12 (0.06) | ||
| Center 5 | 0.13 (0.09) | 0.14 (0.03) | ||
| Center 6 | 0.10 (0.04) | 0.17 (0.11) | ||
| Center 7 | 0.12 (0.05) | 0.13 (0.07) | ||
| Center 8 | 0.03 (0.07) | 0.13 (0.09) | ||
| L PMd—SMA | Total | 0.05 (0.04) | 0.08 (0.05) | 0.002 |
| Center 1 | 0.01 (0.03) | 0.07 (0.03) | ||
| Center 2 | 0.05 (0.05) | 0.07 (0.04) | ||
| Center 3 | 0.04 (0.01) | 0.08 (0.07) | ||
| Center 4 | 0.07 (0.03) | 0.11 (0.08) | ||
| Center 5 | 0.07 (0.06) | 0.14 (0.07) | ||
| Center 6 | 0.05 (0.04) | 0.05 (0.02) | ||
| Center 7 | 0.04 (0.04) | 0.05 (0.04) | ||
| Center 8 | 0.02 (0.04) | 0.06 (0.05) | ||
| L SII—SMA | Total | 0.08 (0.04) | 0.10 (0.05) | 0.01 |
| Center 1 | 0.05 (0.02) | 0.10 (0.01) | ||
| Center 2 | 0.08 (0.04) | 0.11 (0.04) | ||
| Center 3 | 0.07 (0.02) | 0.09 (0.05) | ||
| Center 4 | 0.09 (0.05) | 0.12 (0.06) | ||
| Center 5 | 0.11 (0.06) | 0.14 (0.06) | ||
| Center 6 | 0.07 (0.03) | 0.08 (0.02) | ||
| Center 7 | 0.07 (0.04) | 0.09 (0.05) | ||
| Center 8 | 0.08 (0.03) | 0.08 (0.05) | ||
| SMA—L PMd | Total | 0.04 (0.05) | 0.08 (0.07) | 0.0009 |
| Center 1 | 0.01 (0.05) | 0.06 (0.04) | ||
| Center 2 | 0.02 (0.06) | 0.04 (0.04) | ||
| Center 3 | 0.05 (0.03) | 0.10 (0.08) | ||
| Center 4 | 0.08 (0.02) | 0.15 (0.06) | ||
| Center 5 | 0.09 (0.06) | 0.15 (0.08) | ||
| Center 6 | 0.05 (0.04) | 0.03 (0.04) | ||
| Center 7 | 0.03 (0.02) | 0.06 (0.03) | ||
| Center 8 | 0.01 (0.04) | 0.06 (0.04) | ||
| SMA—L SII | Total | 0.08 (0.04) | 0.11 (0.05) | 0.03 |
| Center 1 | 0.07 (0.03) | 0.09 (0.03) | ||
| Center 2 | 0.09 (0.04) | 0.09 (0.05) | ||
| Center 3 | 0.09 (0.02) | 0.10 (0.05) | ||
| Center 4 | 0.08 (0.06) | 0.12 (0.08) | ||
| Center 5 | 0.12 (0.05) | 0.13 (0.05) | ||
| Center 6 | 0.07 (0.02) | 0.09 (0.04) | ||
| Center 7 | 0.07 (0.03) | 0.12 (0.05) | ||
| Center 8 | 0.08 (0.04) | 0.10 (0.04) | ||
| R SII—SMA | Total | 0.07 (0.04) | 0.09 (0.05) | 0.006 |
| Center 1 | 0.05 (0.03) | 0.07 (0.01) | ||
| Center 2 | 0.08 (0.04) | 0.10 (0.04) | ||
| Center 3 | 0.05 (0.02) | 0.08 (0.04) | ||
| Center 4 | 0.08 (0.04) | 0.11 (0.06) | ||
| Center 5 | 0.10 (0.07) | 0.13 (0.06) | ||
| Center 6 | 0.05 (0.03) | 0.07 (0.02) | ||
| Center 7 | 0.06 (0.03) | 0.09 (0.06) | ||
| Center 8 | 0.07 (0.04) | 0.08 (0.04) | ||
| SMA—R SII | Total | 0.08 (0.05) | 0.10 (0.05) | 0.03 |
| Center 1 | 0.08 (0.03) | 0.09 (0.02) | ||
| Center 2 | 0.08 (0.04) | 0.10 (0.06) | ||
| Center 3 | 0.07 (0.02) | 0.09 (0.04) | ||
| Center 4 | 0.09 (0.06) | 0.13 (0.05) | ||
| Center 5 | 0.11 (0.06) | 0.12 (0.05) | ||
| Center 6 | 0.06 (0.05) | 0.08 (0.03) | ||
| Center 7 | 0.07 (0.03) | 0.11 (0.05) | ||
| Center 8 | 0.08 (0.04) | 0.10 (0.04) | ||
| L SII—R SII | Total | 0.07 (0.04) | 0.09 (0.04) | 0.03 |
| Center 1 | 0.06 (0.03) | 0.08 (0.02) | ||
| Center 2 | 0.07 (0.03) | 0.08 (0.05) | ||
| Center 3 | 0.06 (0.02) | 0.09 (0.05) | ||
| Center 4 | 0.08 (0.05) | 0.10 (0.05) | ||
| Center 5 | 0.09 (0.05) | 0.09 (0.04) | ||
| Center 6 | 0.05 (0.03) | 0.07 (0.02) | ||
| Center 7 | 0.06 (0.02) | 0.13 (0.05) | ||
| Center 8 | 0.06 (0.02) | 0.07 (0.04) | ||
| R SMC—SMA | Total | 0.07 (0.04) | 0.09 (0.05) | 0.03 |
| Center 1 | 0.05 (0.02) | 0.08 (0.03) | ||
| Center 2 | 0.09 (0.06) | 0.10 (0.04) | ||
| Center 3 | 0.06 (0.02) | 0.07 (0.06) | ||
| Center 4 | 0.08 (0.03) | 0.13 (0.07) | ||
| Center 5 | 0.10 (0.05) | 0.13 (0.06) | ||
| Center 6 | 0.06 (0.04) | 0.07 (0.04) | ||
| Center 7 | 0.05 (0.04) | 0.08 (0.05) | ||
| Center 8 | 0.08 (0.04) | 0.09 (0.05) |
Only connections significantly different between controls and MS patients have been reported.
L, left; R, right; SMC, primary sensorimotor cortex; PMd, dorsal prefrontal cortex; SMA, supplementary motor area; SII, secondary sensorimotor cortex.
ANOVA, adjusted for center effect and age and adjusted for multiple comparisons.
Figure 2.

Dynamic causal model showing the results of the between‐group analysis of connectivity. Increased strength of connection in patients vs. controls are reported as continuous black lines, whereas reduced strength of connection in patients vs. controls are reported as dotted black lines. See text for further details.
Correlations Between Measures of Effective Connectivity and Structural MRI Metrics
In MS patients, T2 LV was significantly correlated with the reduction of effective connectivity between the left primary SMC and the right anterior lobe of the cerebellum (r = −0.21, P = 0.05) and with the increase of effective connectivity between the left PMd and the SMA (r = 0.26, P = 0.04). No correlation was found between measures of abnormal effective connectivity and T2 LV of the CC and the left CST as well as NBV and CCA. In the subgroup of MS patients with DT MRI assessment, significant correlations were found between MD of the left CST and coefficients of effective connectivity of the left primary SMC with the left PMd (r = 0.82, P = 0.02). No significant correlations were found between axial and radial diffusivities and effective connectivity measures.
No correlation was found between EDSS and measures of altered effective connectivity.
DISCUSSION
In this study, we applied an analysis of connectivity to fMRI data of the sensorimotor network obtained from a large population of healthy individuals and MS patients with a wide spectrum of clinical characteristics, who were part of a multicenter study.
Previous studies have demonstrated that analysis of brain functional recruitment is reproducible and reliable when used to assess the brain patterns of activations in a multicenter setting not only in healthy individuals [Casey et al.,1998; Costafreda et al.,2007; Zou et al.,2005] but also in patients with neurological conditions [Schneider et al.,2007], including MS [Wegner et al.,2008]. Different approaches have been proposed to pool fMRI data from different centers [Friedman et al.,2006]. Some authors [Friedman and Glover,2006; Schneider et al.,2007] developed methods to measure the quality of images acquired on different scanners and to modify them prior to the analysis. Others [Wegner et al.,2008] treated scanner variance during the statistical analysis, as an additional confounding effect. In this article, which derives from data already described by Wegner et al. [2008], we preferred to use the same approach to pool fMRI data. Recently, a detailed inter‐run, intersubject, and intercenter variability analysis has been performed on a subset of this data [Bosnell et al.,2008]. The main result of this analysis was that intersubject variability dominates inter‐run and intercenter variance, both for healthy subjects and for MS patients [Bosnell et al.,2008]. It is also worth noting that, to minimize possible confounding factors on our results, all the participating centers of this study used 1.5 T scanners, a similar sequence and performed the same, standardized, paradigm. In addition, the analysis of the data was centralized to reduce potential biases related to the method of analysis. Finally, stringent criteria were applied to select patients with similar clinical characteristics among centers and without overt right upper limb motor impairment.
The main aims of this study were to better define brain functional changes associated with MS and to explore further how explicit definition of effective connectivity alterations may contribute to understanding of the disease. To enhance robustness of findings, our study was substantially better powered than previous connectivity studies in MS. An incidental collateral aim related to this, potentially important in the design of future large‐scale, longitudinal fMRI studies in MS, was to assess whether it is possible to obtain meaningful results from the analysis of effective connectivity in a multicenter setting.
As reported elsewhere [Wegner et al.,2008], the comparison of the movement‐associated pattern of brain activations between MS patients and controls confirmed previous single‐center fMRI studies [Rocca and Filippi,2007], by showing an increased activation of several areas of the sensorimotor network in MS patients. The results of the previous analysis also showed that there were no significant differences of the main effect of task across sites and in the contrast between healthy controls and patients. This is the first study that applies an analysis of effective connectivity in a multicenter experiment. We did not find any interaction between disease group and center, which indicates that the observed differences between healthy controls and MS patients in terms of measures of effective connectivity are not affected by the center of enrollment. This observation suggests that measures of effective connectivity can be applied reliably, in combination with the more “classical” measures of activations, in multicenter studies of healthy individuals and in diseased subjects.
Before comparing coefficient of connectivity between patients and controls, we searched for the optimal input region in the predefined model in each group separately. This analysis revealed the superiority, both in healthy subjects and in MS patients, of the model with the left SMC as the input region. This is not a surprising result because, according to the basic theory [Friston et al.,2003], DCM treats the brain as an input‐state‐output dynamic system, where inputs are fMRI tasks perturbing the system and outputs are changes in the neuronal coupling among brain regions. In general, it is a common finding that the regions more activated by the task (in this case, the left SMC) are also the most likely input regions of the stimulus for DCM model. Clearly, we cannot rule out that a more powerful optimization of the model, involving the comparison of all possible models with the presence/absence of all coefficients in the A matrix, instead of an assessment for the driving input only, would have lead to two different optimal models for healthy controls and MS patients. However, such an analysis was not feasible, because of the large sample of subjects studied and to the computational workload required.
The comparison of coefficients of connectivity between MS patients and controls showed an increased strength of the forward and backward connections between several regions known to be part of the distributed sensorimotor network of the human brain (the right primary SMC, the right and left SII, and the left PMd) with the SMA. We also detected an increased connectivity between the left primary SMC and the left PMd as well as between the left and the right SII.
The PMd has an important role for selection and initiation of voluntary actions [Bestmann et al.,2008; Grafton et al.,1998; Scott et al.,1997]. Imaging and transcranial magnetic stimulation (TMS) experiments suggest that the PMd cortex of the left hemisphere is dominant in right‐handed people [Schluter et al.,2001]. This area is reciprocally connected with the ipsilateral and contralateral primary SMC as well as with the parietal cortex and the contralateral PMd [Schluter et al.,1998,2001]. Using a labeling retrograde strategy, Marconi et al. [2003] showed transcallosal homotopic and heterotopic connections between different portions of the PMd of the two hemispheres and between the two PMd and the SMA. A recent experiment [O'Shea et al.,2007] in healthy individuals demonstrated a correlation between preservation of motor performance after disruption of the left PMd activity by means of TMS and increased activation of the right PMd cortex, the SMA, and the cingulate cortex. This pattern was not seen after TMS of the left SMC, while TMS of the reorganized right PMd disrupted motor performance. These findings suggest that adaptive changes of PMd function might contribute to maintaining motor behavior despite progression of irreversible pathology in MS, as previously argued with focal lesions after ischemic stroke [O'Shea et al.,2007]. SII is considered to function as a high‐order processing area for somatosensory perception, and its activation has also been related to attention, manual dexterity, and coordination [Hamalainen et al.,2000; Karhu and Tesche,1999]. The SMA contributes to preparation, coordination, temporal course, and execution of movements [Lee et al.,1999; Ohara et al.,2000; Sadato et al.,1997]. The extent of SMA activation is known to be directly related to the complexity and difficulty of the motor task and inversely related to the amount of training an individual has gained with that specific task (Ohara et al.,2000; Sadato et al.,1997). Inter‐ and intrahemispheric connections between both, the PMd and the SMA, are likely to be mediated primarily by the SMA, which additionally modulates primary SMC bilaterally [Rouiller et al.,1994]. A recent DCM study in healthy individuals assessed the effective connectivity measures between the SMA and the contralateral primary SMC during executed and imagined motor acts and showed that SMA exerts a positive influence to SMC during motor execution, while it suppresses primary SMC activation during motor imagery [Kasess et al.,2008]. Our within‐ and between‐group analysis of effective connectivity strengths between these two areas of the motor system did not reveal a possible influence of the modification of the previous connection on our DCM findings. Clearly, we cannot completely rule out that the complexity of the model we applied with respect to the one used by Kasses et al. [2008] (eight vs. two areas) as well as the difference in the experimental set up (block vs. event‐related) might have prevented us to detect a possible change in such a connection.
Our results are consistent with the hypothesis that right hemisphere motor areas contribute to task performance to a greater degree and in a different way in MS patients than in healthy controls and suggest that the SMA may play an important role in the genesis of such a movement‐associated network plasticity. The notion that patients with MS have a more bilateral pattern of recruitment with movement‐associated tasks is in agreement with previous activation studies [Rocca and Filippi,2007] and with the results of a preliminary study of motor system connectivity in RRMS [Rocca et al.,2007]. The unmasking of direct interhemispheric pathways as well as the recruitment of parallel existing ones are well‐known mechanisms of brain plasticity, which have been demonstrated in MS with cognitive tasks and in other neurological conditions [Calautti and Baron,2003]. Because ipsilateral motor pathways seem to contribute to the control of hand movements in the normal adult (Boecker et al.,1994; Cramer et al.,1999; Kim et al.,1993; Singh et al.,1998) and because they seem to be recruited more extensively with increased motor task complexity [Ehrsson et al.,2000; Wexler et al.,1997], ipsilateral activation of the motor network might be viewed as a “typical” compensatory mechanism, following brain injury, with the potential to facilitate motor unit recruitment.
Somewhat surprising, given the fact that activation analysis did not display abnormal cerebellar recruitment [Wegner et al.,2008], we found a decreased connectivity between the left primary SMC and the right cerebellum. The notion that there might be an impaired connectivity between these two areas in the MS brain has already been suggested by a preliminary study [Saini et al.,2004], in which an altered correlation between signal intensity changes in the cerebellum and the premotor and motor cortices has been detected. Using structural equation modeling, a recent study of healthy individuals has demonstrated an age‐related decline of connectivity of the basal ganglia‐thalamo‐motor and cerebro‐cerebellar networks and an increased connectivity of motor cortices between the two hemispheres [Taniwaki et al.,2007]. These results are consistent with a more general reduction of functional lateralization of motor cortex recruitment with aging, which has been interpreted as a compensatory response to increased functional demands [Hutchinson et al.,2002; Mattay et al.,2002]. It is tempting to interpret our findings of reduced cortico‐cerebellar connectivity in MS as a reflection of enhanced cortico‐cortical shorter‐range connectivities as long‐distance connectivities are preferentially impaired by increasing structural damage.
In this study, we also assessed the correlation between changes of effective connectivity and structural MR metrics of disease‐related damage in terms of T2‐visible lesions and DT MRI metrics of selected WM fiber bundles. Several single‐center DT MRI studies in MS indeed suggested that assessment of damage of selected WM pathways correlates better with clinical deficits than overall quantification of normal‐appearing WM and GM damage [Audoin et al.,2007; Lin et al.,2005; Lowe et al.,2006; Pagani et al.,2005; Wilson et al.,2003]. We found only a weak correlation between measures of abnormal connectivity and T2 lesion burden, which is partially in contrast with the relatively high correlations reported by previous and smaller studies [Rocca and Filippi,2007]. At least four factors might contribute to explain this discrepancy. First, T2 lesion load is a nonspecific finding. Although T2 lesion distributions overall show similarities, at an individual subject level the global measures hide considerable local heterogeneity. Moreover, T2‐weighted scans were acquired in each site according to local protocols having different MRI parameters and geometry, and this might have increased heterogeneity of T2 lesion load measurements. Second, the extent of normal‐appearing white and GM damage as well as the severity of spinal cord involvement, which have also been shown to influence brain recruitment in MS [Rocca and Filippi,2007] may be different in this cohort compared with previous ones, perhaps because of the different clinical characteristics of the patients studied. Third, although the results of the affine registration between single subject T2 scans and WM atlas were visually inspected to ensure a good registration quality, disease‐related atrophy might cause improper assignments of MS lesions to WM tracts. Finally, DCM is essentially an a priori based regional approach, which investigates function of selected pathways and connections. Therefore, it is likely that measures obtained with this method would correlate better with measures of structural damage at a regional level. This is consistent with our observation of a correlation of effective connectivity with metrics of structural damage of the CC and the CST. Albeit limited to a subgroup of patients, and although DT MRI data were obtained in two different centers with only a partial standardization of the acquisition, this analysis indeed showed a moderate correlation of increased connectivity between the left SMC and the left PMd with intrinsic damage of the left CST, measured using DT MRI, which suggests a possible adaptive mechanism of enhancement of shorter‐term connectivity in limiting the functional consequences of anatomic damage of selected WM fiber bundle, as our patients did not have overt motor impairment of the right upper limb. The notion that CST damage is an important modulator of fMRI response in MS patients when dealing with simple motor task performance is in agreement with previous studies, which showed that not only the extent but also the severity of CST damage has the potential to influence movement‐associated activations in MS [Pantano et al.,2002; Reddy et al.,2000; Rocca et al.,2004]. Our hypothesis is also supported by the lack of correlation between measures of abnormal effective connectivity and structural MRI measures of CC damage. Interhemispheric CC fibers are indeed supposed to be more important in complex bimanual function [Meyer et al.,1998], rather than in simple motor task performance.
In line with the results of the analysis of activations previously reported [Wegner et al.,2008] and with those of previous fMRI studies of the motor system in MS [Rocca and Filippi,2007], we found no correlation between EDSS and measures of abnormal effective connectivity. Among the reasons for this discrepancy, the fact that EDSS is heavily weighted toward impairment of deambulation rather than to hand movement has to be considered.
Our study further illustrates the potential of effective connectivity analyses for understanding disease pathophysiology. However, there are several limitations of the work. First, caution must be exercised when interpreting fMRI results obtained from patients because several factors could have an impact on results. Although we have interpreted them in terms of changes in the underlying neuronal activation and inter‐regional interactions, any regional changes in the BOLD response (e.g., from reduced CMRO) also could change the apparent connectivity. However, it should be possible to disambiguate these effects confidently with future experiments using integrated fMRI and electrophysiological studies [Laufs et al.,2008]. Second, the approach used for connectivity analysis was based on the a priori selection of brain regions and models. Although in this instance, we were guided by considerable prior literature, the potential impact of factors such as “hidden” nodes in the true network must be considered. Purely data‐driven approaches to connectivity analysis may provide a way of more empirically selecting future models for specific hypothesis testing using approaches such as that described here. Finally, despite the use of stringent inclusion criteria to enroll patients without overt motor deficits in the investigated limbs and of standardized strategies (e.g., use of the same hand frame and metronome) to assure similar task performance, we cannot rule out that subtle difference in task performance between‐patients and controls might have influenced our results. The use of more sophisticated methods for real‐time monitoring of task performance [Lowe et al.,2008] might allow more precise correlations with motor performance, and thus improving the sensitivity of this type of analysis.
Acknowledgements
This study was conducted under the auspices of the European network for Magnetic Resonance research in MS (MAGNIMS). PMM became a full‐time employee of GlaxoSmithKline during the analysis and manuscript preparation period.
REFERENCES
- Au Duong MV,Audoin B,Boulanouar K,Ibarrola D,Malikova I,Confort‐Gouny S,Celsis P,Pelletier J,Cozzone PJ,Ranjeva JP ( 2005a): Altered functional connectivity related to white matter changes inside the working memory network at the very early stage of MS. J Cereb Blood Flow Metab 25: 1245–1253. [DOI] [PubMed] [Google Scholar]
- Au Duong MV,Boulanouar K,Audoin B,Treseras S,Ibarrola D,Malikova I,Confort‐Gouny S,Celsis P,Pelletier J,Cozzone PJ,Ranjeva JP ( 2005b): Modulation of effective connectivity inside the working memory network in patients at the earliest stage of multiple sclerosis. Neuroimage 24: 533–538. [DOI] [PubMed] [Google Scholar]
- Audoin B,Guye M,Reuter F,Au Duong MV,Confort‐Gouny S,Malikova I,Soulier E,Viout P,Chérif AA,Cozzone PJ,Pelletier J,Ranjeva JP ( 2007): Structure of WM bundles constituting the working memory system in early multiple sclerosis: A quantitative DTI tractography study. Neuroimage 36: 1324–1330. [DOI] [PubMed] [Google Scholar]
- Basser PJ,Mattiello J,LeBihan D ( 1994): Estimation of the effective self‐diffusion tensor from the NMR echo. J Magn Reson B 103: 247–254. [DOI] [PubMed] [Google Scholar]
- Benjamini Y,Hochberg Y ( 1995): Controlling the false discovery rate: A practical and powerful approach to multiple testing. J R Stat Soc Ser B 57: 289–300. [Google Scholar]
- Bestmann S,Swayne O,Blankenburg F,Ruff CC,Haggard P,Weiskopf N,Josephs O,Driver J,Rothwell JC,Ward NS ( 2008): Dorsal premotor cortex exerts state‐dependent causal influences on activity in contralateral primary motor and dorsal premotor cortex. Cereb Cortex 18: 1281–1291. [DOI] [PMC free article] [PubMed] [Google Scholar]
- Boecker H,Kleinschmidt A,Requardt M,Hanicke W,Merboldt KD,Frahm J ( 1994): Functional cooperativity of human cortical motor areas during self‐paced simple finger movements. A high‐resolution MRI study. Brain 117: 1231–1239. [DOI] [PubMed] [Google Scholar]
- Bosnell R,Wegner C,Kincses ZT,Korteweg T,Agosta F,Ciccarelli O,DeStefano N,Gass A,Hirsch J,Johansen‐Berg H,Kappos L,Barkhof F,Mancini L,Manfredonia F,Marino S,Miller DH,Montalban X,Palace J,Rocca MA,Enzinger C,Ropele S,Rovira A,Smith S,Thompson A,Thornton J,Yousry T,Whitcher B,Filippi M,Matthews PM ( 2008): Reproducibility of fMRI in the clinical setting: Implication for trial designs. Neuroimage 42: 603–610. doi:10.1016/j.neuroimage. 2008.05.005. [DOI] [PubMed] [Google Scholar]
- Cader S,Cifelli A,Abu‐Omar Y,Palace J,Matthews PM ( 2006): Reduced brain functional reserve and altered functional connectivity in patients with multiple sclerosis. Brain 129: 527–537. [DOI] [PubMed] [Google Scholar]
- Calautti C,Baron JC ( 2003): Functional neuroimaging studies of motor recovery after stroke in adults: A review. Stroke 34: 1553–1566. Review. [DOI] [PubMed] [Google Scholar]
- Casey BJ,Cohen JD,O'Craven K,Davidson RJ,Irwin W,Nelson CA,Noll DC,Hu X,Lowe MJ,Rosen BR,Truwitt CL,Turski PA ( 1998): Reproducibility of fMRI results across four institutions using a spatial working memory task. Neuroimage 8: 249–261. [DOI] [PubMed] [Google Scholar]
- Costafreda SG,Brammer MJ,Vêncio RZ,Mourão ML,Portela LA,de Castro CC,Giampietro VP,Amaro E Jr ( 2007): Multisite fMRI reproducibility of a motor task using identical MR systems. J Magn Reson Imaging 26: 1122–1126. [DOI] [PubMed] [Google Scholar]
- Cramer SC,Finklestein SP,Schaechter JD,Bush G,Rosen BR ( 1999): Activation of distinct motor cortex regions during ipsilateral and contralateral finger movements. J Neurophysiol 81: 383–387. [DOI] [PubMed] [Google Scholar]
- Ehrsson HH,Fagergren A,Jonsson T,Westling G,Johansson RS,Forssberg H ( 2000): Cortical activity in precision‐versus power‐grip tasks: An fMRI study. J Neurophysiol 83: 528–536. [DOI] [PubMed] [Google Scholar]
- Friedman L,Glover GH ( 2006): Report on a multicentric fMRI quality assurance protocol. J Magn Reson Imaging 23: 827–839. [DOI] [PubMed] [Google Scholar]
- Friedman L,Glover GH; The FBIRN consortium ( 2006): Reducing interscanner variability of activation in a multicenter fMRI study: Controlling for signal‐to‐fluctuation‐noise‐ratio (SFNR) differences. Neuroimage 33: 471–481. [DOI] [PubMed] [Google Scholar]
- Friston KJ,Holmes AP,Poline JB,Grasby PJ,Williams SC,Frackowiak RS,Turner R ( 1995): Analysis of fMRI time‐series revisited. Neuroimage 2: 45–53. [DOI] [PubMed] [Google Scholar]
- Friston KJ,Holmes AP,Price CJ,Buchel C,Worsley KJ ( 1999): Multisubject fMRI studies and conjunction analyses. Neuroimage 10: 385–396. [DOI] [PubMed] [Google Scholar]
- Friston KJ,Harrison L,Penny W ( 2003): Dynamic causal modelling. Neuroimage 19: 1273–1302. [DOI] [PubMed] [Google Scholar]
- Grafton ST,Fagg AH,Arbib MA ( 1998): Dorsal premotor cortex and conditional movement selection: A PET functional mapping study. J Neurophysiol 79: 1092–1097. [DOI] [PubMed] [Google Scholar]
- Hamalainen H,Hiltunen J,Titievskaja I ( 2000): fMRI activations of SI and SII cortices during tactile stimulation depend on attention. Neuroreport 11: 1673–1676. [DOI] [PubMed] [Google Scholar]
- Hutchinson S,Kobayashi M,Horkan CM,Pascual‐Leone A,Alexander MP,Schlaug G ( 2002): Age‐related differences in movement representation. Neuroimage 17: 1720–1728. [DOI] [PubMed] [Google Scholar]
- Karhu J,Tesche CD ( 1999): Simultaneous early processing of sensory input in human primary (SI) and secondary (SII) somatosensory cortices. J Neurophysiol 81: 2017–2025. [DOI] [PubMed] [Google Scholar]
- Kasess CH,Windischberger C,Cunnington R,Lanzenberger R,Pezawas L,Moser E ( 2008): The suppressive influence of SMA on M1 in motor imagery revealed by fMRI and dynamic causal modeling. Neuroimage 40: 828–837. [DOI] [PubMed] [Google Scholar]
- Kim SG,Ashe J,Hendrich K,Ellermann JM,Merkle H,Ugurbil K,Georgopoulos AP ( 1993): Functional magnetic resonance imaging of motor cortex: Hemispheric asymmetry and handedness. Science 261: 615–617. [DOI] [PubMed] [Google Scholar]
- Kurtzke JF ( 1983): Rating neurological impairment in multiple sclerosis: En expanded disability status scale (EDSS). Neurology 33: 1444–1452. [DOI] [PubMed] [Google Scholar]
- Laufs H,Daunizeau J,Carmichael DW,Kleinschmidt A ( 2008): Recent advances in recording electrophysiological data simultaneously with magnetic resonance imaging. Neuroimage 40: 515–528. [DOI] [PubMed] [Google Scholar]
- Lee KM,Chang KH,Roh JK ( 1999): Subregions within the supplementary motor area activated at different stages of movement preparation and execution. Neuroimage 9: 117–123. [DOI] [PubMed] [Google Scholar]
- Lin X,Tench CR,Morgan PS,Niepel G,Constantinescu CS ( 2005): ‘Importance sampling’ in MS: Use of diffusion tensor tractography to quantify pathology related to specific impairment. J Neurol Sci 237: 13–19. [DOI] [PubMed] [Google Scholar]
- Lowe MJ,Phillips MD,Lurito JT,Mattson D,Dzemidzic M,Mathews VP ( 2002): Multiple sclerosis: Low‐frequency temporal blood oxygen level‐dependent fluctuations indicate reduced functional connectivity initial results. Radiology 224: 184–192. [DOI] [PubMed] [Google Scholar]
- Lowe MJ,Horenstein C,Hirsch JG,Marrie RA,Stone L,Bhattacharyya PK,Gass A,Phillips MD ( 2006): Functional pathway‐defined MRI diffusion measures reveal increased transverse diffusivity of water in multiple sclerosis. Neuroimage 32: 1127–1133. [DOI] [PubMed] [Google Scholar]
- Lowe MJ,Beall EB,Sakaie KE,Koenig KA,Stone L,Marrie RA,Phillips MD ( 2008): Resting state sensorimotor functional connectivity in multiple sclerosis inversely correlates with transcallosal motor pathway transverse diffusivity. Hum Brain Mapp 29: 818–827. [DOI] [PMC free article] [PubMed] [Google Scholar]
- Marconi B,Genovesio A,Giannetti S,Molinari M,Caminiti R ( 2003): Callosal connections of dorso‐lateral premotor cortex. Eur J Neurosci 18: 775–788. [DOI] [PubMed] [Google Scholar]
- Mattay VS,Fera F,Tessitore A,Hariri AR,Das S,Callicott JH,Weinberger DR ( 2002): Neurophysiological correlates of age‐related changes in human motor function. Neurology 58: 630–635. [DOI] [PubMed] [Google Scholar]
- Meyer BU,Roricht S,Woiciechowsky C ( 1998): Topography of fibers in the human corpus callosum mediating interhemispheric inhibition between the motor cortices. Ann Neurol 43: 360–369. [DOI] [PubMed] [Google Scholar]
- Mori S ( 2005): MRI Atlas of Human White Matter. Amsterdam, The Netherlands: Elsevier. [Google Scholar]
- Ohara S,Ikeda A,Kunieda T,Yazawa S,Baba K,Nagamine T,Taki W,Hashimoto N,Mihara T,Shibasaki H ( 2000): Movement‐related change of electrocorticographic activity in human supplementary motor area proper. Brain 123: 1203–1215. [DOI] [PubMed] [Google Scholar]
- Oldfield RC ( 1971): The assessment and analysis of handedness: The Edinburgh inventory. Neuropsychologia 9: 97–113. [DOI] [PubMed] [Google Scholar]
- O'Shea J,Johansen‐Berg H,Trief D,Göbel S,Rushworth MF ( 2007): Functionally specific reorganization in human premotor cortex. Neuron 54: 479–490. [DOI] [PubMed] [Google Scholar]
- Pagani E,Filippi M,Rocca MA,Horsfield MA ( 2005): A method for obtaining tract‐specific diffusion tensor MRI measurements in the presence of disease: Application to patients with clinically isolated syndromes suggestive of multiple sclerosis. Neuroimage 26: 258–265. [DOI] [PubMed] [Google Scholar]
- Pantano P,Mainero C,Iannetti GD,Caramia F,Di Legge S,Piattella MC,Pozzilli C,Bozzao L,Lenzi GL ( 2002): Contribution of corticospinal tract damage to cortical motor reorganization after a single clinical attack of multiple sclerosis. Neuroimage 17: 1837–1843. [DOI] [PubMed] [Google Scholar]
- Penny WD,Stephan KE,Mechelli A,Friston KJ ( 2004): Comparing dynamic causal models. Neuroimage 22: 1157–1172. [DOI] [PubMed] [Google Scholar]
- Reddy H,Narayanan S,Matthews PM,Hoge RD,Pike GB,Duquette P,Antel J,Arnold DL ( 2000): Relating axonal injury to functional recovery in MS. Neurology 54: 236–239. [DOI] [PubMed] [Google Scholar]
- Rocca MA,Filippi M ( 2007): Functional MRI in multiple sclerosis. J Neuroimaging 17: 36S–41S. Review. [DOI] [PubMed] [Google Scholar]
- Rocca MA,Gallo A,Colombo B,Falini A,Scotti G,Comi G,Filippi M ( 2004): Pyramidal tract lesions and movement‐associated cortical recruitment in patients with MS. Neuroimage 23: 141–147. [DOI] [PubMed] [Google Scholar]
- Rocca MA,Pagani E,Absinta M,Valsasina P,Falini A,Scotti G,Comi G,Filippi M ( 2007): Altered functional and structural connectivities in patients with MS: A 3‐T study. Neurology 69: 2136–2145. [DOI] [PubMed] [Google Scholar]
- Rocca MA,Valsasina P,Ceccarelli A,Absinta M,Ghezzi A,Riccitelli G,Pagani E,Falini A,Comi G,Scotti G,Filippi M: Structural and functional MRI correlates of Stroop control in benign MS. Hum Brain Mapp 2007, Nov 27. (Epub ahead of print). [DOI] [PMC free article] [PubMed] [Google Scholar]
- Rouiller EM,Babalian A,Kazennikov O,Moret V,Yu XH,Wiesendanger M ( 1994): Transcallosal connections of the distal forelimb representations of the primary and supplementary motor cortical areas in macaque monkeys. Exp Brain Res 102: 227–243. [DOI] [PubMed] [Google Scholar]
- Sadato N,Yonekura Y,Waki A,Yamada H,Ishii Y ( 1997): Role of the supplementary motor area and the right premotor cortex in the coordination of bimanual finger movements. J Neurosci 17: 9667–9674. [DOI] [PMC free article] [PubMed] [Google Scholar]
- Saini S,DeStefano N,Smith S,Guidi L,Amato MP,Federico A,Matthews PM ( 2004): Altered cerebellar functional connectivity mediates potential adaptive plasticity in patients with multiple sclerosis. J Neurol Neurosurg Psychiatry 75: 840–846. [DOI] [PMC free article] [PubMed] [Google Scholar]
- Schneider F,Habel U,Reske M,Kellermann T,Stöcker T,Shah NJ,Zilles K,Braus DF,Schmitt A,Schlösser R,Wagner M,Frommann I,Kircher T,Rapp A,Meisenzahl E,Ufer S,Ruhrmann S,Thienel R,Sauer H,Henn FA,Gaebel W ( 2007): Neural correlates of working memory dysfunction in first‐episode schizophrenia patients: An fMRI multi‐center study. Schizophr Res 89: 198–210. [DOI] [PubMed] [Google Scholar]
- Schluter ND,Rushworth MF,Passingham RE,Mills KR ( 1998): Temporary interference in human lateral premotor cortex suggests dominance for the selection of movements. A study using transcranial magnetic stimulation. Brain 121: 785–799. [DOI] [PubMed] [Google Scholar]
- Schluter ND,Krams M,Rushworth MF,Passingham RE ( 2001): Cerebral dominance for action in the human brain: The selection of actions. Neuropsychologia 39: 105–113. [DOI] [PubMed] [Google Scholar]
- Scott SH,Sergio LE,Kalaska JF ( 1997): Reaching movements with similar hand paths but different arm orientations. II. Activity of individual cells in dorsal premotor cortex and parietal area 5. J Neurophysiol 78: 2413–2426. [DOI] [PubMed] [Google Scholar]
- Singh LN,Higano S,Takahashi S,Abe Y,Sakamoto M,Kurihara N,Furuta S,Tamura H,Yanagawa I,Fujii T,Ishibashi T,Maruoka S,Yamada S ( 1998): Functional MR imaging of cortical activation of the cerebral hemispheres during motor tasks. AJNR Am J Neuroradiol 19: 275–280. [PMC free article] [PubMed] [Google Scholar]
- Smith SM,De Stefano N,Jenkinson M,Matthews PM ( 2001): Normalized accurate measurement of longitudinal brain change. J Comput Assist Tomogr 25: 466–475. [DOI] [PubMed] [Google Scholar]
- Taniwaki T,Okayama A,Yoshiura T,Togao O,Nakamura Y,Yamasaki T,Ogata K,Shigeto H,Ohyagi Y,Kira J,Tobimatsu S ( 2007): Age‐related alterations of the functional interactions within the basal ganglia and cerebellar motor loops in vivo. Neuroimage 36: 1263–1276. [DOI] [PubMed] [Google Scholar]
- Tecchio F,Zito G,Zappasodi F,Dell' Acqua ML,Landi D,Nardo D,Lupoi D,Rossini PM,Filippi MM ( 2008): Intra‐cortical connectivity in multiple sclerosis: A neurophysiological approach. Brain 131 (Part 7): 1783–1792. [DOI] [PubMed] [Google Scholar]
- Ward NS ( 2006): Compensatory mechanisms in the aging motor system. Ageing Res Rev 5: 239–254. Review. [DOI] [PubMed] [Google Scholar]
- Wegner C,Filippi M,Korteweg T,Beckmann C,Ciccarelli O,De Stefano N,Enzinger C,Fazekas F,Agosta F,Gass A,Hirsch J,Johansen‐Berg H,Kappos L,Barkhof F,Polman C,Mancini L,Manfredonia F,Marino S,Miller DH,Montalban X,Palace J,Rocca M,Ropele S,Rovira A,Smith S,Thompson A,Thornton J,Yousry T,Matthews PM ( 2008): Relating functional changes during hand movement to clinical parameters in patients with multiple sclerosis in a multi‐centre fMRI study. Eur J Neurol 15: 113–122. [DOI] [PubMed] [Google Scholar]
- Wexler BE,Fulbright RK,Lacadie CM,Skudlarski P,Kelz MB,Constable RT,Gore JC ( 1997): An fMRI study of the human cortical motor system response to increasing functional demands. Magn Reson Imaging 15: 385–396. [DOI] [PubMed] [Google Scholar]
- Wilson M,Tench CR,Morgan PS,Blumhardt LD ( 2003): Pyramidal tract mapping by diffusion tensor magnetic resonance imaging in multiple sclerosis: Improving correlations with disability. J Neurol Neurosurg Psychiatry 74: 203–207. [DOI] [PMC free article] [PubMed] [Google Scholar]
- Zou KH,Greve DN,Wang M,Pieper SD,Warfield SK,White NS,Manandhar S,Brown GG,Vangel MG,Kikinis R,Wells WM III; FIRST BIRN Research Group ( 2005): Reproducibility of functional MR imaging: preliminary results of prospective multiinstitutional study performed by Biomedical Informatics Research Network. Radiology 237: 781–789. [DOI] [PMC free article] [PubMed] [Google Scholar]