

Abstract
Dehydration can affect brain structure which has important implications for human health. In this study, we measured regional changes in brain structure following acute dehydration. Healthy volunteers received a structural MRI scan before and after an intensive 90‐min thermal‐exercise dehydration protocol. We used two techniques to determine changes in brain structure: a manual point counting technique using MEASURE, and a fully automated voxelwise analysis using SIENA. After the exercise regime, participants lost (2.2% ± 0.5%) of their body mass. Using SIENA, we detected expansion of the ventricular system with the largest change occurring in the left lateral ventricle (P = 0.001 corrected for multiple comparisons) but no change in total brain volume (P = 0.13). Using manual point counting, we could not detect any change in ventricular or brain volume, but there was a significant correlation between loss in body mass and third ventricular volume increase (r = 0.79, P = 0.03). These results show ventricular expansion occurs following acute dehydration, and suggest that automated longitudinal voxelwise analysis methods such as SIENA are more sensitive to regional changes in brain volume over time compared with a manual point counting technique. Hum Brain Mapp 2009. © 2007 Wiley‐Liss, Inc.
Keywords: dehydration, magnetic resonance imaging, structural anatomy
INTRODUCTION
Human survival is associated with an ability to maintain homeostasis through preserving fluid balance and regulating body core temperature [Adolph, 1947]. Homeostasis is challenged on a daily basis through a combination of voluntary, i.e. physical activity, involuntary, i.e. illness, and environmental factors, i.e. heat and humidity [Armstrong, 2000]. An increase in core temperature and parallel decrease in body fluid results in impaired cardiovascular function [Costill et al., 1976; Harrison, 1985; Nadel et al., 1980] and physical performance [Armstrong et al., 1985; Callister et al., 1991; Hickner et al., 1991; Hoffman et al., 1995].
Preserving fluid balance, while optimizing physical performance, is of considerable interest to athletes. Given the dangers associated with dysregulated fluid balance, fluid replacement recommendations have been developed for athletes for the periods before, during and after physical activity [Gisolfi and Duchman, 1992; Maughan and Noakes, 1991]. Despite this, weight‐classified athletes have been reported to employ active and passive fluid loss methods immediately before competing to enable them to compete in weight categories >5% below their usual weight. This is based on the belief that this approach will provide a psychological and physiological advantage over fellow competitors [Fogelholm, 1994; Smith, 2006]. If changes in brain structure such as shrinkage occur following dehydration, there are important implications for sporting events such as boxing where dehydration might increase the likelihood of brain damage after blows to the head [Carnall and Warden, 1995; Dickson et al., 2005].
Few studies have investigated the effects of dehydration on human brain structure. An early X‐ray computed tomography (CT) study suggested a decrease in ventricular size following dehydration [Mellanby and Reveley, 1982], although the authors caution against drawing conclusions from the study as it was based on a single participant. A recent magnetic resonance imaging (MRI) study has shown that dehydration due to restricted fluid intake over a 16‐h period leads to reduction in total brain volume, an effect that can be reversed following acute rehydration [Duning et al., 2005]. A further study showed that increases in ventricular volume following physical exercise correlated with reductions in body mass [Dickson et al., 2005].
In the present study, we attempt to map the regional changes in brain morphology on a voxel‐by‐voxel basis in addition to global volume changes following acute dehydration. We acquired structural MRI scans before and after rigorous exercise and applied two complementary image analysis techniques: stereology, which is widely used and provides an unbiased estimate of the volume of an object [Roberts et al., 2000]; and structural image evaluation, using normalization of atrophy (SIENA), which is a completely automated analysis designed for detecting brain atrophy in longitudinal studies [Smith et al., 2002].
Taking into consideration previous evidence, we hypothesized that acute dehydration would lead to a reduction in brain volume and subtle regional changes in brain morphology such as ventricular expansion.
MATERIALS AND METHODS
Participants
Seven male volunteers recruited from sport and exercise science students at the University of Chichester took part in the study (physical characteristics: mean ± SD, age 23.8 ± 4.1 years, body mass 77.8 ± 9.7 kg, and height 1.76 ± 0.05 m). All participants undertook regular physical activity but were naïve to methods of acute dehydration.
All participants gave written informed consent after being made aware of the possible risks and discomfort of the experimental procedures. Participants also completed a Health History Questionnaire to assess their suitability for undergoing MRI scanning. Ethics approval was obtained from the ethics committee at the Institute of Psychiatry and Maudsley Hospital, London.
Procedure
During the 24‐h period before the study participants were instructed not to participate in strenuous activity, and to maintain a normal diet and avoid alcohol consumption. Participants consumed 500 ml of water during the evening before reporting to the laboratory the following morning. On arrival at the laboratory [temperature 20 (± 1)°C, relative humidity (45% ± 5%)] participants consumed a further 500 ml of water, 1 h before physical exercise.
Participants were asked to urinate and nude body mass was determined (Avery scales, Birmingham, England). Each participant then received a baseline brain MRI scan before the dehydration protocol.
Dehydration Protocol
A thermal‐exercise dehydration protocol was devised to decrease body mass by 2–3% in 90‐min [Smith, 1998]. The thermal component required participants to wear three layers of clothing: Layer 1 consisted of a modified black bin liner (Sainsbury's, UK) fitted next to the participants skin; Layer 2 was a chemical warfare protective suit that comprised a hooded impermeable plastic top and bottoms (Royal Navy, Ministry of Defence, UK); and Layer 3 was a sports tracksuit that comprised a cotton top and bottoms (Adidas, Germany). The three layers were worn throughout the 90‐min thermal‐exercise protocol.
The exercise component was divided into three phases. Phase 1 required participants to cycle on a Monark E824E ergometer (Monark, Sweden) at 130 W for 50 min. Phase 2 was a 10‐min seated recovery. Phase 3 required 30 min cycling at 130 W. Heart rate was monitored throughout the 90‐min thermal‐exercise protocol to assess exercise intensity and thermal load (Polar PE 3000, Kempele, Finland). On completion of the thermal‐exercise protocol, participants were reweighed and percentage change in body mass was determined. Participants were given a 15‐min supine recovery period before completing a post dehydration brain MRI scan.
MRI Scanning
MRI scanning was performed on a 1.5 Tesla GE Signa MRI scanner (General Electric, Milwaukee, WI). Images were acquired in the coronal plane using a three dimensional, T 1 weighted, inversion‐recovery prepared, steady state, spoiled gradient‐echo sequence (TR = 9.1 ms, TE = 2 ms, TI = 450 ms, flip angle = 20°, slice thickness = 1.5 mm, matrix size = 256 × 256, voxel dimensions 0.9375 × 0.9375 × 1.50 mm3, NEX = 1).
Assessment of Brain Volume Change Using SIENA
SIENA version 2.4, part of FSL (FMRIB Software Library, http://www.fmrib.ox.ac.uk/fsl/) was used to determine the percentage change in global brain volume for each participant after acute dehydration, and voxelwise statistics were used to reveal regional changes in brain morphology.
SIENA is a fully automated analysis tool designed for detecting small changes in brain morphology over time and is insensitive to different scanning parameters [Smith, 2002]. Previous research has shown SIENA to have greater sensitivity in detecting longitudinal changes in brain structure compared with semiautomated outlining methods [Anderson et al., 2007]. In addition, it has been shown to be highly reproducible, with an error of less than 0.15% in brain volume when healthy controls were scanned on two occasions under identical conditions [Smith et al., 2002].
SIENA has been used in a number of studies investigating changes in brain structure [Bartsch et al., 2007; Mezzapesa et al., 2007; Peters et al., 2006] and is briefly described below. The SIENA program is applied to each participant's pair of images, scanned before and after acute dehydration. The brain and skull are extracted from each pair [Smith et al., 2002], and the two brain images are aligned to each other, using the skull images to constrain the scaling of the alignment [Jenkinson et al., 2002; Jenkinson and Smith, 2001]. The aligned images are then resampled into a three‐dimensional space which is halfway between the two images to ensure the same interpolation has been applied to each image. The brain images are then segmented to find brain/nonbrain edge points [Zhang et al., 2001]. At each edge point a perpendicular line is drawn through the brain surface, and the presegmented image is sampled along the line to find the steepest intensity gradient, thus accurately marking the edge of the brain in each image. Finally, the mean displacement of brain surface at each edge point is converted to a global percentage change in brain volume.
To allow voxelwise statistical interrogation of the data, the mean displacement images for each participant are dilated (14 times using a 3 × 3 × 3 kernel, nonbinary dilation) and transformed into Montreal Neurological Institute (MNI) space and masked by a standard brain edge image [Bartsch et al., 2007]. The number of dilations performed is the standard number for a SIENA voxelwise analysis and provides a large enough band of flow values around the brain‐CSF boundary so that the standard brain edge mask can extract values for each point on the mask. The resultant images are then smoothed by a Gaussian kernel of half width 10 mm for statistical analysis.
A one‐sample t‐test was used to determine if there was significant change in global brain volume (SPSS Inc., Chicago, IL. version 15). Voxelwise one‐sample t‐tests were performed on the smoothed dilated displacement images using SPM5 (Wellcome Department of Imaging Neuroscience) basic models to highlight regions where there was displacement of brain surface, thus indicating regional changes in brain volume. To investigate the relationship between displacement and loss in body mass, we used a simple linear regression model in SPM5.
Assessment of Whole‐Brain and CSF Volume Change Using MEASURE
Structural MRI scans were analyzed for the estimation of whole‐brain and ventricular volumes using a manual regions‐of‐interest (ROI) approach. ROI analysis was undertaken on the basis of stereological principles implemented in PC‐based software (MEASURE) [Barta et al., 1997]. MEASURE superimposes a grid on the image and allows the user to view voxels in three mutually orthogonal planes. Grid points falling within an a priori defined anatomic region of interest are manually marked by a rater. Head tilt was corrected in all brains before measurements to align images along the anterior commissure–posterior commissure (AC‐PC) line and the interhemispheric fissure. A grid setting of 5 × 5 × 5 was used for whole‐brain volume, where one grid point equals one image voxel. For the much smaller structures of the third and lateral ventricles a maximally detailed grid setting of 1 × 1 × 1 was applied to improve measurement accuracy [Dickson et al., 2003]. All structures were analyzed by the same rater (AS) and were individually confirmed by a second rater (UE).
The anatomic definition of whole‐brain volume was based on previously described boundaries [Ettinger et al., 2007; Schulze et al., 2003]. Whole‐brain volume included all grid points falling within cortical and subcortical gray matter, white matter, and the brain stem superior to the pons. Any CSF within these boundaries, cerebellum, optic chiasm, pineal and pituitary glands, dura mater, superior sagittal, straight and transverse sinuses were excluded. Inter‐rater reliability (raters AS and UE) was high, Intraclass correlation coefficient (ICC) = 0.84. The technical error of measurement (TEM) [Gore and Australian Sports, 2000] was 34.4 cm3 (3.1%), confirming good reliability of ratings by the two raters. Intra‐rater reliability (AS) was high: ICC = 0.95, TEM = 18.8 cm3 (1.8%).
Both lateral and third ventricular CSF is clearly visible in MRI scans. The demarcations of lateral [DeLisi et al., 1995] and third [Fannon et al., 2000] ventricles were as follows. The lateral ventricle measurement included CSF from the entire lateral ventricular system including the temporal horn. The lateral ventricle was bordered anteriorly by frontal cortex, medially by the septum pellucidum, intraventricular foramen and corpus callosum and posteriorly by the occipital cortex. Inter‐rater reliability was high: ICC = 0.99, TEM = 0.9 cm3 (5.1%). Intra‐rater reliability was high: ICC = 0.98, TEM = 1.2 cm3 (4.3%). Measurements of the third ventricle included CSF that was bordered by the anterior commissure, the fornix, the stria medullaris, the pineal body, the superior and inferior colliculi, the midbrain and mamillary body, the thalamus, and hypothalamus. Inter‐rater reliability was high: ICC = 0.98, TEM = 0.04 cm3 (5.1%). Intra‐rater reliability was high: ICC = 0.999, TEM = 0.01 cm3 (1.7%).
Statistical analysis of whole‐brain and ventricular volumes was carried out in SPSS Version 15 (SPSS, Chicago, IL.). To investigate effects of dehydration, we first compared regional volumes measured before and after exercise using paired samples t‐tests (separately for whole‐brain, lateral, and third ventricle). Effect sizes were calculated using the formula (Vol1 − Vol2)/SDVoldiff where Vol1 is the volume at first scan, Vol2 is the volume at second scan, and SDVoldiff is the standard deviation of the difference score (Vol1 − Vol2). To explore relationships between dehydration effects and regional brain volumes, Pearson correlation coefficients were calculated between percentage changes both in regional volume and body mass, for each anatomical variable.
We then carried out a least‐products regression analysis [Ludbrook, 1997] to investigate both systematic as well as random change over the two scans. In all cases, statistical significance was taken to be P < 0.05.
RESULTS
Change in Body Mass
All participants completed the test procedures and no moderate or severe symptoms of discomforts were reported. Body mass decreased from 77.8 ± 9.7 kg before dehydration to 76.1 ± 9.6 kg after dehydration (t 6 = 11.6, P < 0.001). This equated to (2.19% ± 0.54%) loss in body mass.
Change in Brain Volume (SIENA)
From the SIENA global brain volume analysis, there was no reduction in global brain volume after acute dehydration (P = 0.13, mean change in brain volume = −0.23%, SD = 0.34%), see Figure 1. However from the SIENA voxelwise analysis there was expansion of the ventricular system after acute dehydration, see Figure 2. The most extensive expansion occurred in the left lateral ventricle (Z = 5.4, P = 0.001 corrected for multiple comparisons, Montreal Neurological Institute (MNI) coordinates x = −22, y = −26, z = 18, mean displacement = 0.12 mm, SD = 0.01 mm). No correlation of ventricular expansion and body weight loss passing the P < 0.05 corrected threshold was found using the SIENA voxelwise analysis.
Figure 1.

Global percentage change in brain volume after acute dehydration measured by SIENA, n = 7. Individual participants are shown on the left and the mean and standard deviation of the group is shown on the right.
Figure 2.
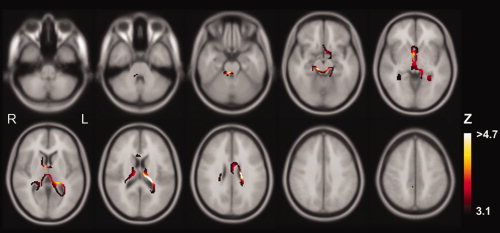
Regional changes in brain volume after acute dehydration measured by SIENA. Colored regions indicate volume loss at a P < 0.001 uncorrected voxel‐level threshold (Z > 3.1). Regions where color graduates to white indicate volume loss at P < 0.05 corrected voxel‐level threshold (Z > 4.7).
Change in Brain and Ventricular Volumes (MEASURE)
Descriptive statistics and effect sizes of whole‐brain and ventricular volumes before and after exercise are presented in Table I. There were no changes as a result of dehydration for any of the structures evaluated here (Table II). All effect sizes were in the small range [Cohen, 1988].
Table I.
Descriptive statistics for whole‐brain and ventricular volumes (MEASURE)
| Before dehydration | After dehydration | Effect size | |
|---|---|---|---|
| Whole‐brain | 1104 (74) | 1104 (75) | 0.004 |
| Third ventricle | 0.55 (0.24) | 0.57 (0.23) | −0.17 |
| Lateral ventricle | 13.3 (8.0) | 14.6 (10.1) | −0.37 |
All volumes are given as means (standard deviations) in cm3. Whole‐brain volume comprises grey and white matter. The sample size for all variables is N = 7.
Table II.
Statistical analysis of whole‐brain and ventricular volumes (MEASURE)
| t‐test | LPR Value of Loss Function | LPR Parameters | ||
|---|---|---|---|---|
| a | b | |||
| Whole‐brain | t 6 = 0.01, P = 0.99 | 14535a | 1.70E–007 | 1.00 |
| Third ventricle | t 6 = −0.49,P = 0.65 | 0.08b | −0.05 | 1.05 |
| Lateral ventricle | t 6 = −1.56, P = 0.17 | 3.19c | 1.74 | 0.79 |
LPR, least products regression.
Optimal solution found after 1 iteration.
Optimal solution found after 5 iterations.
Optimal solution found after 8 iterations. The sample size for all analyses is N = 7.
Least products regression (LPR) indicated that there was only very small systematic change in volume across scans and low random change, i.e. no overall differences and good stability in volumes from before to after dehydration.
Percentage body mass change was positively correlated with percentage change in third ventricle volume (r = 0.79, P = 0.03), indicating that loss in body mass was associated with greater third ventricular enlargements (Fig. 3). Change in body mass was negatively correlated with percentage change in brain volume (r = −0.75, P = 0.054), indicating that greater body mass loss was associated with greater brain volume reductions (Fig. 3). There was no correlation between changes in body mass and lateral ventricle volume (P = 0.39).
Figure 3.
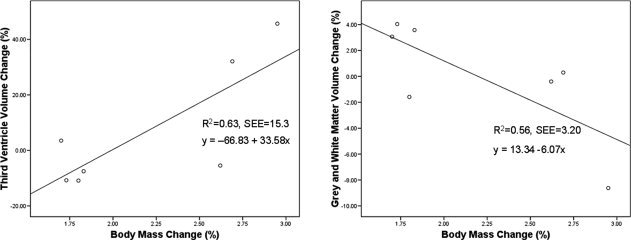
Relationship between change in body weight and anatomical volumes (MEASURE). The left panel shows the relationship between percentage change in body mass and third ventricle volume. The right panel shows the relationship between percentage change in body mass and whole‐brain volume. SEE, Standard Error of the Estimate.
DISCUSSION
The present study employed a rigorous thermal‐exercise protocol to achieve acute dehydration in healthy individuals. The thermal‐exercise protocol has previously been validated in experimental studies of sports medicine [Smith et al., 2000]. In our study, 90 min of thermal‐exercise led to a (2.2% ± 0.5%) loss of body mass, supporting the validity of the dehydration method employed here.
The study's aim was to identify the effects of acute dehydration on brain morphology in healthy humans. To provide an analysis of changes in brain morphology, we used two complementary image analysis methods that investigated gross anatomical changes in brain volume and ventricles: a stereological region‐of‐interest (ROI) method (MEASURE) and a more detailed voxel‐by‐voxel analysis (SIENA).
Brain Changes Following Dehydration
The SIENA analysis revealed expansion of the left lateral ventricle and suggested expansion of the right lateral, third, and fourth ventricle after dehydration (the latter results not passing correction for multiple comparisons). No expansion of CSF filled spaces adjacent to the interior surface of the skull was found. Although the mean displacement of the ventricle wall was small, and reflects the sensitivity of SIENA to subvoxel changes [Smith et al., 2002], a displacement of this magnitude over the entire surface of the ventricles would lead to a more appreciable change in total ventricular volume.
Dehydration increases the osmolality of extracellular fluid in the body and decreases blood volume [Costill et al., 1976]. Both are processes that could reduce total brain volume and lead to a corresponding increase in CSF volume. Increased concentrations of solutes in extracellular fluid cause water to move from inside cells to the extracellular fluid along the osmotic gradient, causing cellular shrinkage [Gullans and Verbalis, 1993]. However, cells prevent large increases and decreases in volume by actively regulating their intracellular solute (particularly potassium ions), which is of vital importance in the brain because of the fixed volume of the cranium [Stricker and Verbalis, 2003]. Indeed, if such homeostatic processes were not active we might expect to see larger changes in brain structure following dehydration. As brain volume decreases, the empty space is filled by CSF; this may come from an increase in production or a decrease in absorption of CSF, or from the CSF filled spinal dural sack which unlike the cranium, can change its volume in response to intracranial pressure [Lee et al., 2001; Lofgren and Zwetnow, 1973].
The ROI analysis using MEASURE did not identify any differences in third or lateral ventricular volume following dehydration. The failure to observe such an effect using the ROI method might be because it fails to consider subsections of the structures studied. A previous study using a manual ROI segmentation of the ventricles also did not find a systematic effect of dehydration on overall volume [Dickson et al., 2005]. However, both the present study and Dickson et al. [2005] observed a relationship between change in body mass and ventricular enlargement. While Dickson et al. [2005] studied the ventricular system without distinguishing between third and lateral ventricles, our study indicates that the finding might be specific to the third ventricle. The observed relationship indicates that greater loss in body mass was associated with greater third ventricle enlargement. As in the study by Dickson et al. [2005], we observed that small reductions in body mass after dehydration (<2%) were paradoxically associated with decreased ventricle volume, while larger body mass reductions (>2.5%) were associated with ventricular enlargement.
Additionally, we observed a relationship between changes in body mass and brain volume (assessed using MEASURE). This relationship indicated that greater body weight loss was associated with greater brain volume reductions. However, there was no evidence of changes in overall brain volume from before to after dehydration. This observation was made using both the manual ROI analysis (MEASURE) and the fully automated analysis (SIENA). This result is in contrast with a previous study that reported reductions in brain volume following dehydration [Duning et al., 2005]. Differences in study protocols could account for the discrepancy. For example, while we used an acute, 90‐min thermal‐exercise method to achieve dehydration, Dunning et al. [2005] restricted fluid intake in their participants for 16 h. Moreover, we had fewer participants than Dunning et al. [2005] and hence, could have been underpowered to detect the reduction in total brain volume. The failure of our study to detect changes in brain volume but to detect ventricular expansion, suggests that the latter measure may be more sensitive to dehydration.
Limitations
A limitation of this study is that only seven participants were included, future studies with a larger number of subjects may be able to detect changes in total brain volume and more extensive changes in ventricular system. All the participants in this study were young, healthy males which may limit the extrapolation of our findings to the general population. Furthermore, the SIENA analysis is restricted to displacement of the brain boundary and it is possible that this analysis may have missed changes in volume of structures within the brain. Voxel‐based morphometry is another technique which could have been applied to the data to detect regional changes. Likewise the MEASURE analysis was restricted to the whole brain volume, lateral ventricles, and third ventricle and mayhave missed other regional changes. Although the MEASURE intra‐rater reliability was high, the small variability between measures may have masked the even smaller effect of dehydration.
Implications
The current finding of subtle increases in ventricular volume after dehydration has several implications: first, the increase in ventricular volume may be important for athletes who use acute dehydration regimes and compete in contact weight‐classified sports such as boxing and martial arts. Increased CSF volume could allow the brain to move further in the cranium following a blow to the head, thus increasing deceleration forces as the brain impacts into the cranium. Such rapid deceleration of the brain can cause contusion injuries [Besenski, 2002].
Second, abnormal fluid intake occurs in neuropsychiatric conditions and may thus affect the measurement of brain volumes in these patient populations. For example, while polydipsia is observed in some cases of psychosis [McKinley et al., 2004], patients with dementia often display symptoms of dehydration because of poorly maintained fluid intake. The present findings and those of previous studies [Dickson et al., 2005; Duning et al., 2005] thus have clinical as well as scientific implications. Clinically, abnormal regulation of fluid intake may adversely affect brain structure and function and should thus be recognized at an early stage. Scientifically, group differences in level of dehydration may introduce error in comparisons of brain volumes. However, it should be noted that the dehydration effects observed here are relatively small compared with group differences seen in the psychiatric literature [Wright et al., 2000].
Future Work
If neurons are forced to increase intracellular solutes during dehydration to maintain their volume, one might anticipate this process to affect their function. Accordingly, it would be useful to assess the effects of dehydration on brain function via functional MRI. It would also be important to observe regional changes in brain structure following rehydration to verify that the observed lateral ventricle expansion is reversed. In addition, it would be of interest to try and separate the effects of dehydration (increased extracellular osmolality and decreased plasma volume) on brain structure by scanning volunteers before and after increased salt intake or blood donation, respectively.
CONCLUSIONS
Overall, the present study reveals ventricular expansion following acute dehydration, a finding which may have implications for athletes of weight‐classified sports. Dehydration effects on brain structure are of a small magnitude and are better detected with automated processes such as SIENA compared with point‐counting techniques.
Acknowledgements
The authors acknowledge the support provided to Luke Smith during his MSc in Sports Science from Manchester Metropolitan University. The research was carried out at the Centre for Neuroimaging Sciences, Institute of Psychiatry, King's College London, London, UK. Ulrich Ettinger is funded by a NIHR (National Institute for Health Research) Personal Award. The views expressed in this publication are those of the authors and not necessarily those of the NHS, NIHR or Department of Health.
REFERENCES
- Adolph EF ( 1947): Physiology of Man in the Desert. New York: Interscience. [Google Scholar]
- Anderson VM,Fernando KT,Davies GR,Rashid W,Frost C,Fox NC,Miller DH( 2007): Cerebral atrophy measurement in clinically isolated syndromes and relapsing remitting multiple sclerosis: A comparison of registration‐based methods. J Neuroimaging 17: 61–68. [DOI] [PubMed] [Google Scholar]
- Armstrong LE( 2000): Performing in Extreme Environments. Champaign, IL: Extreme Kinetics. [Google Scholar]
- Armstrong LE,Costill DL,Fink WJ( 1985): Influence of diuretic‐induced dehydration on competitive running performance. Med Sci Sports Exerc 17: 456–461. [DOI] [PubMed] [Google Scholar]
- Barta PE,Dhingra L,Royall R,Schwartz E( 1997): Improving stereological estimates for the volume of structures identified in three‐dimensional arrays of spatial data. J Neurosci Methods 75: 111–118. [DOI] [PubMed] [Google Scholar]
- Bartsch AJ,Homola G,Biller A,Smith SM,Weijers HG,Wiesbeck GA,Jenkinson M,De SN,Solymosi L,Bendszus M( 2007): Manifestations of early brain recovery associated with abstinence from alcoholism. Brain 130(Part 1): 36–47. [DOI] [PubMed] [Google Scholar]
- Besenski N( 2002): Traumatic injuries: Imaging of head injuries. Eur Radiol 12: 1237–1252. [DOI] [PubMed] [Google Scholar]
- Callister R,Callister RJ,Staron RS,Fleck SJ,Tesch P,Dudley GA( 1991): Physiological characteristics of elite judo athletes. Int J Sports Med 12: 196–203. [DOI] [PubMed] [Google Scholar]
- Carnall D,Warden J( 1995): Tighter medical controls proposed for boxing. BMJ 311: 1183. [DOI] [PubMed] [Google Scholar]
- Cohen J( 1988): Statistical Power Analysis for the Behavioral Sciences. Hillsdale, NJ: Lawrence Earlbaum Associates, Inc. [Google Scholar]
- Costill DL,Cote R,Fink W( 1976): Muscle water and electrolytes following varied levels of dehydration in man. J Appl Physiol 40: 6–11. [DOI] [PubMed] [Google Scholar]
- DeLisi LE,Tew W,Xie S,Hoff AL,Sakuma M,Kushner M,Lee G,Shedlack K,Smith AM,Grimson R( 1995): A prospective follow‐up study of brain morphology and cognition in first‐episode schizophrenic patients: preliminary findings. Biol Psychiatry 38: 349–360. [DOI] [PubMed] [Google Scholar]
- Dickson JM,Weavers HM,Mitchell N,Winter EM,Wilkinson ID,VanBeek EJ,Griffiths PD( 2003): Choice of cross size in stereology—A cautionary note. Neuroradiology 45: 896–899. [DOI] [PubMed] [Google Scholar]
- Dickson JM,Weavers HM,Mitchell N,Winter EM,Wilkinson ID,Van Beek EJ,Wild JM,Griffiths PD( 2005): The effects of dehydration on brain volume—Preliminary results. Int J Sports Med 26: 481–485. [DOI] [PubMed] [Google Scholar]
- Duning T,Kloska S,Steinstrater O,Kugel H,Heindel W,Knecht S( 2005): Dehydration confounds the assessment of brain atrophy. Neurology 64: 548–550. [DOI] [PubMed] [Google Scholar]
- Ettinger U,Picchioni M,Landau S,Matsumoto K,van Haren NE,Marshall N,Hall MH,Schulze K,Toulopoulou T,Davies N,Ribchester T,McGuire PK,Murray RM ( 2007): Magnetic resonance imaging of the thalamus and adhesio interthalamica in twins with schizophrenia. Arch Gen Psychiatry 64: 401–409. [DOI] [PubMed] [Google Scholar]
- Fannon D,Tennakoon L,Sumich A,O'Ceallaigh S,Doku V,Chitnis X,Lowe J,Soni W,Sharma T( 2000): Third ventricle enlargement and developmental delay in first‐episode psychosis: Preliminary findings. Br J Psychiatry 177: 354–359. [DOI] [PubMed] [Google Scholar]
- Fogelholm M( 1994): Effects of bodyweight reduction on sports performance. Sports Med 18: 249–267. [DOI] [PubMed] [Google Scholar]
- Gisolfi CV,Duchman SM( 1992): Guidelines for optimal replacement beverages for different athletic events. Med Sci Sports Exerc 24: 679–687. [PubMed] [Google Scholar]
- Gore CJ, Australian Sports C ( 2000): Physiological Tests for Elite Athletes. Champaign, IL: Human Kinetics. [Google Scholar]
- Gullans SR,Verbalis JG( 1993): Control of brain volume during hyperosmolar and hypoosmolar conditions. Annu Rev Med 44: 289–301. [DOI] [PubMed] [Google Scholar]
- Harrison MH( 1985): Effects on thermal stress and exercise on blood volume in humans. Physiol Rev 65: 149–209. [DOI] [PubMed] [Google Scholar]
- Hickner RC,Horswill CA,Welker JM,Scott J,Roemmich JN,Costill DL( 1991): Test development for the study of physical performance in wrestlers following weight loss. Int J Sports Med 12: 557–562. [DOI] [PubMed] [Google Scholar]
- Hoffman JR,Stavsky H,Falk B( 1995): The effect of water restriction on anaerobic power and vertical jumping height in basketball players. Int J Sports Med 16: 214–218. [DOI] [PubMed] [Google Scholar]
- Jenkinson M,Smith S( 2001): A global optimisation method for robust affine registration of brain images. Med Image Anal 5: 143–156. [DOI] [PubMed] [Google Scholar]
- Jenkinson M,Bannister P,Brady M,Smith S ( 2002): Improved optimization for the robust and accurate linear registration and motion correction of brain images. Neuroimage 17: 825–841. [DOI] [PubMed] [Google Scholar]
- Lee RR,Abraham RA,Quinn CB ( 2001): Dynamic physiologic changes in lumbar CSF volume quantitatively measured by three‐dimensional fast spin‐echo MRI. Spine 26: 1172–1178. [DOI] [PubMed] [Google Scholar]
- Lofgren J,Zwetnow NN ( 1973): Cranial and spinal components of the cerebrospinal fluid pressure‐volume curve. Acta Neurol Scand 49: 575–585. [DOI] [PubMed] [Google Scholar]
- Ludbrook J ( 1997): Comparing methods of measurements. Clin Exp Pharmacol Physiol 24: 193–203. [DOI] [PubMed] [Google Scholar]
- Maughan RJ,Noakes TD ( 1991): Fluid replacement and exercise stress. A brief review of studies on fluid replacement and some guidelines for the athlete. Sports Med 12: 16–31. [DOI] [PubMed] [Google Scholar]
- McKinley MJ,Cairns MJ,Denton DA,Egan G,Mathai ML,Uschakov A,Wade JD,Weisinger RS,Oldfield BJ( 2004): Physiological and pathophysiological influences on thirst. Physiol Behav 81: 795–803. [DOI] [PubMed] [Google Scholar]
- Mellanby AR,Reveley MA( 1982): Effects of acute dehydration on computerized tomographic assessment of cerebral density and ventricular volume. Lancet 2: 874. [DOI] [PubMed] [Google Scholar]
- Mezzapesa DM,Ceccarelli A,Dicuonzo F,Carella A,De Caro MF,Lopez M,Samarelli V,Livrea P,Simone IL ( 2007): Whole‐brain and regional brain atrophy in amyotrophic lateral sclerosis. AJNR Am J Neuroradiol 28: 255–259. [PMC free article] [PubMed] [Google Scholar]
- Nadel ER,Fortney SM,Wenger CB( 1980): Effect of hydration state of circulatory and thermal regulations. J Appl Physiol 49: 715–721. [DOI] [PubMed] [Google Scholar]
- Peters N,Holtmannspotter M,Opherk C,Gschwendtner A,Herzog J,Samann P,Dichgans M( 2006): Brain volume changes in CADASIL: A serial MRI study in pure subcortical ischemic vascular disease. Neurology 66: 1517–1522. [DOI] [PubMed] [Google Scholar]
- Roberts N,Puddephat MJ,McNulty V( 2000): The benefit of stereology for quantitative radiology. Br J Radiol 73: 679–697. [DOI] [PubMed] [Google Scholar]
- Schulze K,McDonald C,Frangou S,Sham P,Grech A,Toulopoulou T,Walshe M,Sharma T,Sigmundsson T,Taylor M,Murray RM( 2003): Hippocampal volume in familial and nonfamilial schizophrenic probands and their unaffected relatives. Biol Psychiatry 53: 562–570. [DOI] [PubMed] [Google Scholar]
- Smith MS( 1998): Sport Specific Ergometry and the physiological demands of amateur boxing. PhD thesis, Southampton University.
- Smith MS( 2006): Physiological profile of Senior and Junior England international amateur boxers. J Sports Sci Med CSSI 5: 74–89. [PMC free article] [PubMed] [Google Scholar]
- Smith MS,Dyson R,Hale T,Harrison JH,McManus P ( 2000): The effects in humans of rapid loss of body mass on a boxing‐related task. Eur J Appl Physiol 83: 34–39. [DOI] [PubMed] [Google Scholar]
- Smith SM( 2002): Fast robust automated brain extraction. Hum Brain Mapp 17: 143–155. [DOI] [PMC free article] [PubMed] [Google Scholar]
- Smith SM,Zhang Y,Jenkinson M,Chen J,Matthews PM,Federico A,De SN( 2002): Accurate, robust, and automated longitudinal and cross‐sectional brain change analysis. Neuroimage 17: 479–489. [DOI] [PubMed] [Google Scholar]
- Stricker EM,Verbalis JG( 2003): Water intake and body fluids In: Squire LR,Bloom FE, McConnell SK, Roberts JL,Spitzer NC, Zigmond MJ, editors. Fundamental Neuroscience. London: Academic Press; pp 1011–1028. [Google Scholar]
- Wright IC,Rabe‐Hesketh S,Woodruff PW,David AS,Murray RM,Bullmore ET( 2000): Meta‐analysis of regional brain volumes in schizophrenia. Am J Psychiatry 157: 16–25. [DOI] [PubMed] [Google Scholar]
- Zhang Y,Brady M,Smith S( 2001): Segmentation of brain MR images through a hidden Markov random field model and the expectation‐maximization algorithm. IEEE Trans Med Imaging 20: 45–57. [DOI] [PubMed] [Google Scholar]